i 1
The University of Sydney
2Dairy Science Group
34
5
Feed management to optimise robot utilisation in
6automatic milking systems
78
Alex James John
910
A thesis submitted in fulfilment of the requirements for the degree of
11Doctor of Philosophy
12Faculty of Science
13 14September 2018
15ii
Table of Contents
16 Abstract ... vii 17 Acknowledgements ... ix 18 Preface ... x 19 Statement of Originality ... xi 20 Abbreviations ... xii 21 List of Figures ... xv 22List of Tables ... xviii 23
Publications Originated from this Candidature ... xx 24
Publications in peer-reviewed journals ... xx 25
Manuscripts submitted to peer-reviewed journals ... xx 26
Non peer-reviewed conference papers ... xx 27
General Publications ... xxi 28
Awards ... xxi 29
Confirmation of Co-Authorship of Published Work ... xxii 30
CHAPTER 1: General Introduction ... 1 31
1.1 Introduction ... 2 32
1.11 Overview of Australian dairy industry ... 2 33
1.12 Product markets ... 3 34
1.13 Feeding systems ... 3 35
1.14 Labour challenges associated with the dairy industry ... 5 36
iii
1.15 Introducing automatic milking systems ... 6 37
1.16 Why farmers choose automatic milking systems ... 7 38
1.2 References ... 8 39
CHAPTER 2: Review: Milking robot utilization – a successful precision livestock 40 farming evolution ... 11 41 2.1 Overview of Chapter 2 ... 12 42 2.2 Abstract ... 13 43 2.3 Keywords ... 13 44 2.4 Introduction ... 14 45
2.5 Material and methods ... 16 46 2.6 Results ... 18 47 2.7 Discussion ... 20 48 2.71 Feed factors ... 20 49 2.72 Animal factors ... 26 50 2.73 Management factors ... 29 51 2.8 Conclusions ... 32 52 2.9 Acknowledgements ... 33 53 2.10 References ... 34 54
CHAPTER 3: Case study of seven commercial pasture-based automatic milking 55
systems’ robot utilisation and their pasture management practices ... 44 56
3.1 Overview of Chapter 3 ... 45 57
3.2 Abstract ... 46 58
iv
3.3 Keywords ... 47 59
3.4 Introduction ... 48 60
3.5 Materials and Methods ... 50 61 3.6 Results ... 52 62 3.7 Discussion ... 56 63 3.8 Conclusion ... 61 64 3.9 Acknowledgements ... 61 65 3.10 References ... 62 66
CHAPTER 4: Robot utilisation of pasture-based dairy cows with varying levels of 67 milking frequency ... 66 68 4.1 Overview of Chapter 4 ... 67 69 4.2 Abstract ... 68 70 4.3 Keywords ... 68 71 4.4 Introduction ... 69 72
4.5 Material and Methods ... 71 73 4.6 Results ... 74 74 4.7 Discussion ... 76 75 4.8 Conclusion ... 80 76 4.9 Acknowledgements ... 81 77 4.10 References ... 81 78
CHAPTER 5: Diurnal feed intake and lying behaviour of dairy cows when access to a 79
feed of consistent nutritive value is restricted ... 84 80
v 5.1 Overview of Chapter 5 ... 85 81 5.2 Abstract ... 86 82 5.3 Keywords ... 87 83 5.4 Introduction ... 88 84
5.5 Material and Methods ... 90 85
5.6 Results and Discussion ... 94 86 5.7 Conclusion ... 98 87 5.8 Acknowledgements ... 98 88 5.9 References ... 99 89
CHAPTER 6: The effect of temporal variation in feed quality and quantity on the diurnal 90
feeding behaviour patterns of non-lactating dairy cows ... 103 91 6.1 Overview of Chapter 6 ... 104 92 6.2 Abstract ... 105 93 6.3 Keywords ... 106 94 6.4 Introduction ... 107 95
6.5 Materials and Methods ... 109 96 6.6 Results ... 112 97 6.7 Discussion ... 116 98 6.8 Conclusion ... 120 99 6.9 Acknowledgements ... 121 100 6.10 References ... 121 101
vi
CHAPTER 7: The effect of temporal variation of pasture quantity on milking robot 102 utilisation ... 125 103 7.1 Overview of Chapter 7 ... 126 104 7.2 Abstract ... 127 105 7.3 Keywords ... 128 106 7.4 Introduction ... 129 107
7.5 Materials and Methods ... 131 108 7.6 Results ... 136 109 7.7 Discussion ... 139 110 7.8 Conclusion ... 143 111 7.9 Acknowledgements ... 143 112 7.10 References ... 144 113
CHAPTER 8: General Discussion and Conclusion... 148 114 8.1 Discussion ... 149 115 8.2 Conclusion ... 155 116 8.3 References ... 157 117 Appendix ... 160 118 119
vii
Abstract
120
Automatic milking systems (AMS) have revolutionised dairy farming around the world. 121
Whilst robots control the milking process, there have also been numerous changes to 122
how the whole farm system is managed. Milking is no longer performed in defined 123
sessions; rather, the cow can now choose when to be milked in AMS, allowing milking 124
to be distributed throughout a 24 h period. Achieving a consistent level of robot 125
utilisation (RU) throughout 24 h is key to maximising AMS efficiency. Despite this, 126
there has been little attention given to RU throughout 24 h in the research space. The 127
aim of this thesis is to provide the fundamental knowledge of cow feeding behaviour 128
in response to changes in feeding management (quantity and quality) and apply this 129
knowledge to improve RU in pasture-based AMS through the formulation of novel 130
feeding strategies. The literature review (Chapter 2) explored the different feed, animal 131
and management factors that could influence RU in both indoor and pasture-based 132
AMS. A study of commercial pasture-based AMS (Chapter 3) uncovered the extent of 133
RU variability on Australian farms. Further investigation of a high performing pasture-134
based AMS farm (Chapter 4) found cows with a high milking frequency (MF) visited 135
the milking robots more often at night (77% of nights) compared to medium and low 136
MF cows (57 and 50%, respectively). High MF cows also concentrated their milking 137
events to coincide with new pasture allocations, whereas medium and low MF cows 138
milked 2 and 4 h later, respectively. Additionally, this study highlighted the unique 139
pasture management employed on this high performing farm, whereby the farmer 140
varied the temporal allocation of herbage quantity to encourage cow traffic. From this 141
a component trial (Chapter 5) determined the feeding patterns of cows in the absence 142
of diurnal feed variation, whilst also determining if there were any negative impacts on 143
cow welfare. Using the information from the first component trial, a second component 144
viii
trial (Chapter 6) tested the effect of varying feed quantity and quality on cow feeding 145
behaviour. This study found that feed quantity was the most effective way to 146
manipulate feeding behaviour. The final study (Chapter 7) tested three different 147
methods of feed allocation on the pasture-based AMS farm. This study highlighted the 148
ability to manipulate RU by varying the quantity of herbage offered throughout 24 h. 149
This thesis provides a comprehensive analysis of cow feeding patterns and how this 150
knowledge can be used to manipulate RU, providing a framework for future research 151
to develop methods to improve feeding management in pasture-based AMS. 152
ix
Acknowledgements
153
I acknowledge the University of Sydney and FutureDairy for funding my stipend for the 154
duration of my candidature. Secondly, I gratefully acknowledge the Dairy Research 155
Foundation for its support of the Dairy Science Group and the investors of the 156
FutureDairy project (Dairy Australia, The University of Sydney, and DeLaval) for 157
providing the operating funds to complete my research. 158
I would like to offer my sincere thanks to my supervisors for the guidance and expertise 159
they provided me. To Cameron Clark, you instilled an enthusiasm for research in me 160
for which I will be forever grateful, coupled with your dedication and encouragement 161
to provide me with new experiences and opportunities. To Kendra Kerrisk, it was a 162
pleasure to be able to work along side a world expert in automatic milking systems. 163
To Yani Garcia, thank you for providing your depth of knowledge in the scientific 164
process; and for the many enjoyable games of squash we had after work. Finally, to 165
Mark Freeman, who despite being multiple states away always had time for any 166
question big or small. 167
I must also thank the many people that make up the Dairy Science Group. It was a 168
pleasure to work alongside such a fantastic group of people, whom I not only call my 169
colleagues, but also my friends. There was never a dull moment whilst being part of 170
the MC Franklin family. 171
Finally, I would like to thank my family for their love and encouragement throughout 172
these years: Nan and Pop, Mum and Dad, Erin, Jenna, James, Andrew and my nieces 173
and nephews Cooper, Tait, Halle, Avalon, Florence, Alexandra, Evan and Genevieve. 174
Lastly, thank you to my best friend, Ha Truong, I am so happy to have met you on this 175
journey. Thank you for your patience and never-ending support. 176
x
Preface
177
This thesis is presented as a collection of manuscripts. Some of the chapters 178
contained within the thesis form the basis of journal publications or have been 179
submitted to journals. The work of this thesis has also formed the basis for 180
presentations at symposia, conferences and industry presentations. 181
xi
Statement of Originality
182
This is to certify that to the best of my knowledge, the content of this thesis is my own 183
work and contains no material written by another person except where due references 184
are made. This thesis has not been submitted for any other degree or purposes. 185
186
I certify that the intellectual content of this thesis is mine and that all the assistance 187
received in preparing this thesis and sources have been acknowledged. 188
189
Alex James John 190
March 2018 191
xii
Abbreviations
192
The following is a complete list of abbreviations used throughout this thesis. 193
Abbreviations are also defined at first use in each chapter. 194 $ Australian dollar 195 ℃ Degrees Celcius 196 % Percent 197
ADF Acid detergent fibre 198
AMR Automatic milking rotary 199
AMS Automatic milking system (s) 200
ANOVA Analysis of variance
201
BGHI Black globe humidity index 202
BW Bodyweight
203
cm Centimetres
204
CMS Conventional milking system (s) 205 CP Crude protein 206 d Day (s) 207 DM Dry matter 208
DMD Dry matter digestibility 209
DMI Dry matter intake 210
xiii
g Grams
211
GLMM Generalised linear mixed model 212 h Hour 213 ha Hectare 214 I.D. Identification 215 kg Kilograms 216 L Litres 217
LSD Least significant difference 218 m Metres 219 ME Metabolizable energy 220 MF Milking frequency 221 MI Milking interval 222 min Minute (s) 223 MJ Megajoules 224 mm Millimetres 225 mo Month 226 MS Milk solids 227 MY Milk yield 228 n Number 229
xiv
NDF Neutral detergent fibre 230
P P – value
231
PLF Precision livestock farming 232
PMR Partial mixed ration 233
PN Proportion of nights milked 234
REML Restricted maximum likelihood procedure 235 RU Robot utilisation 236 SD Standard deviation 237 SE Standard error 238
SED Average standard error of the difference 239
SOL Stage of lactation 240
t Tonne
241
THI Temperature-humidity index 242
TMR Total mixed ration 243
WSC Water soluble carbohydrate 244
2WG Two-way grazing
245
3WG Three-way grazing 246
xv
List of Figures
247
CHAPTER 1: General Introduction 248
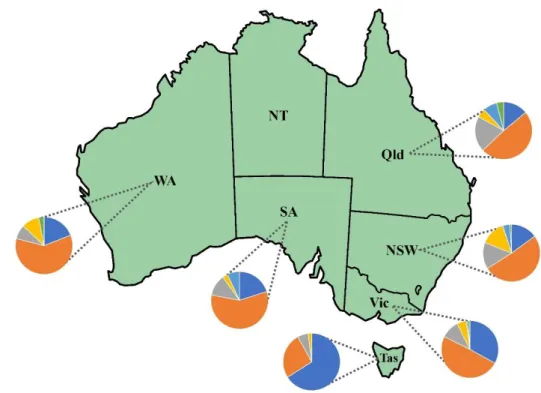
Figure 1 Distribution of feeding systems (1 , 2 , 3 , 4 , 5 , Other ) by 249
state, derived from Little (2010) ………….…....……….. 4 250
CHAPTER 2: Review: Milking robot utilization – a successful precision livestock 251
farming evolution 252
Figure 1 Proportion of milkings/h (% total) for dairy cattle in indoor automatic 253
milking systems from Belle et al. (2012) ( ), Halachmi et al. (2000) 254
( ), Halachmi et al. (2001) ( ), Halachmi (2004) (period A ; 255
period B ), Stefanowska et al. (1999) ( ), Wagner-Storch and 256
Palmer (2003) ( ) and Winnicki et al. (2010) ( ) …...……… 19 257
Figure 2 Proportion of milkings/h (% total) for dairy cattle in pasture-based 258
automatic milking systems taken from Davis et al. (2005) ( ), John et al. 259
(2013) (farm A ; farm B ), Lyons et al. (2005) ( ), Scott et al. 260
(2015) ( ), van Dooren (2004) ( ), and Woolford et al. (2004) 261
( ) ………..……….….………. 19
262
Figure 3 Mean proportion of dairy cattle milkings/h (% total) for pasture-based 263
( , SD = 0.9%, n = 7), and indoor ( , SD = 0.6%, n = 8), automatic 264
milking systems …….………..……… 20 265
CHAPTER 3: Case study of seven commercial pasture-based automatic milking 266
systems’ robot utilisation and their pasture management practices 267
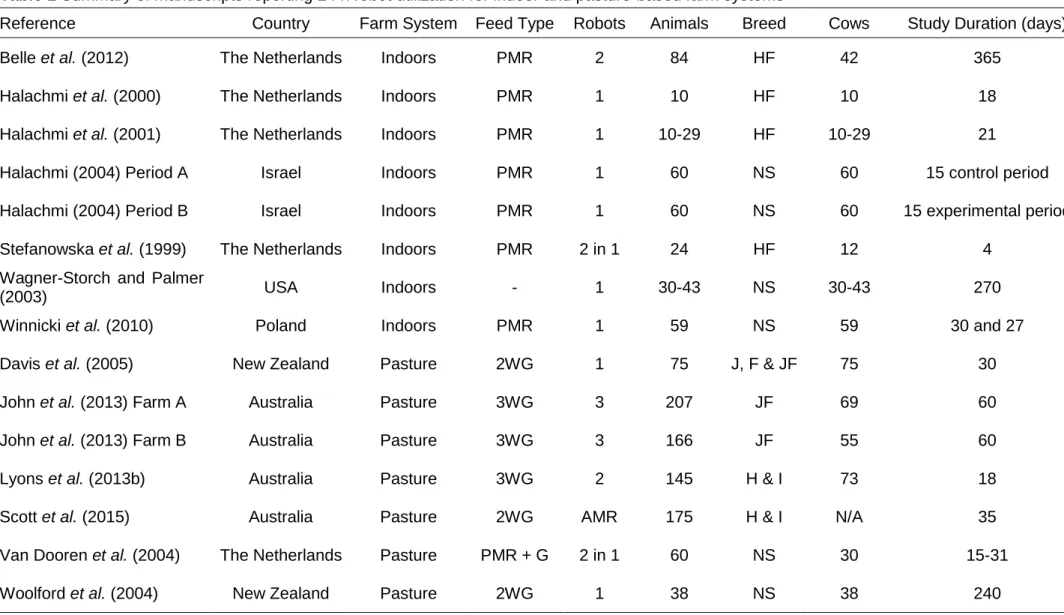
Figure 1 Predicted mean for hourly robot utilisation (milkings per robot) of farm 268
1 (a), farm 2 (b), farm 3 (c), farm 4 (d), farm 5 (e), farm 6 (f) and farm 7 (g). 269
Gate change times, where a new allocation of pasture is offered, are indicated 270
by the dashed vertical lines. The proportion of herbage offered, as a percentage 271
of the total daily allocation, is indicated for each allocation period. Each hour 272
represents milkings occurring within a 60 min period, e.g. 16 = all milkings 273
occurring between 1600 – 1659 h ………..……… 53 274
xvi
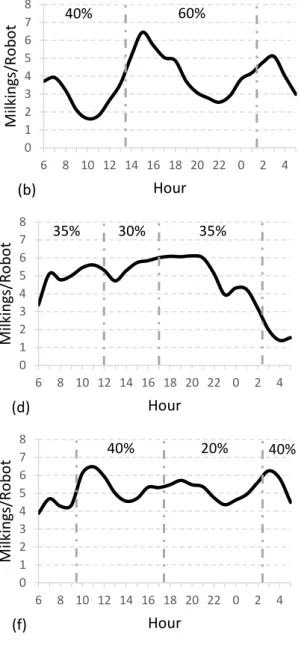
Figure 2 Predicted means of robot utilisation (milkings per robot per h) for 275
spring ( ), summer ( ), autumn ( ) and winter ( ). Each 276
point represents milkings occurring during the indicated hour, e.g. 16 = milkings 277
occurring between 1600 – 1659 h. Average SED = 0.1034 …………..….….. 54 278
CHAPTER 4: Robot utilisation of pasture-based dairy cows with varying levels 279
of milking frequency 280
Figure 1 Mean daily milking events per hour for the entire herd, performed by 281
three milking robots. Error bars represent SE ……….……. 75 282
Figure 2 Mean daily milking events per hour for high ( ), medium 283
( ) and low ( ) MF groups. Dashed vertical lines denote gate 284
change times. Error bars represent SE ………...………...………….. 76 285
CHAPTER 5: Diurnal feed intake and lying behaviour of dairy cows when access 286
to a feed of consistent nutritive value is restricted 287
Figure 1 Layout of the 30x10 m pens, separated by two-wire fences, and 288
distribution of the three treatment groups (A, B and C). Feeders are represented 289
by green squares ( ) and water access by blue circles ( ) ………..……….. 91 290
Figure 2 Probability of cows feeding throughout 24 h when offered lucerne hay 291
cubes of a consisent nutritive value with full access (24h, ), day access 292
(0600-1800 h, ) and night access (1800-0600 h, ) ……….... 96 293
Figure 3 Probability of cows lying throughout 24 h when offered lucerne hay 294
cubes of a consisent nutritive value with full access (24h, ), day access 295
(0600-1800 h, ) and night access (1800-0600 h, ) ………..………. 97 296
CHAPTER 6: The impact of temporal variation in feed quality and quantity on the 297
diurnal feeding behaviour patterns of non-lactating dairy cows 298
Figure 1 Total daily intake (kg DM) of each treatment during the 0600-1200 h 299
( ), 1200-1800 h ( ), 1800-2400 h ( ) and 2400-0600 h ( ) periods. Significant 300
differences denoted by superscripts (a, b…, i) …………..………....…… 113 301
xvii
Figure 2 Probability of cows feeding throughout 24 h when offered standard 303
feed ad libitum (AL, ), standard feed ad libitum replaced by a preferred 304
feed between 2400-0600 (AL+P, ), offered standard feed at variable rate 305
throughout 24 h (VA, ) and offered standard feed at a variable rate 306
throughout 24 h replaced by a preferred feed between 2400-0600 h 307
(VA+P, ). Each point on the x axis represents occurrence of behaviour for 308
entire hour (e.g. 18 = 1800 – 1859 h) ………..……..………...……114 309
Figure 3 Probability of cows ruminating throughout 24 h when offered standard 310
feed ad libitum (AL, ), standard feed ad libitum replaced by a preferred 311
feed between 2400-0600 h (AL+P, ), offered standard feed at variable 312
rate throughout 24 h (VA, ) and offered standard feed at a variable rate 313
throughout 24 h replaced by a preferred feed between 2400-0600 h 314
(VA+P, ). Each point on the x axis represents occurrence of behaviour for 315
entire hour (e.g. 18 = 1800 – 1859 h) .………...…….. 115 316
Figure 4 Probability of cows resting throughout 24 h when offered standard 317
feed ad libitum (AL, ), standard feed ad libitum replaced by a preferred 318
feed between 2400-0600 h (AL+P, ), offered standard feed at variable 319
rate throughout 24 h (VA, ) and offered standard feed at a variable rate 320
throughout 24 h replaced by a preferred feed between 2400-0600 h 321
(VA+P, ). Each point on the x axis represents occurrence of behaviour for 322
entire hour (e.g. 18 = 1800 – 1859 h) ………...………….. 116 323
CHAPTER 7: The effect of temporal variation of pasture quantity on milking 324
robot utilisation 325
Figure 1 Robot utilisation, shown as the number of milking events performed 326
per hour, for the control ( ), day ( ) and night ( ) treatments. Each 327
of the three daily pasture allocations are denoted by capital letters (A, B and C) 328
and vertical dashed lines. Significant differences within hour are indicated by 329
letters (a, b, c) …………..……….…. 138 330
xviii
List of Tables
331
CHAPTER 2: Review: Milking robot utilization – a successful precision livestock 332
farming evolution 333
Table 1 Summary of manuscripts reporting 24 h robot utilization for indoor and 334
pasture-based farm systems ………..………17 335
CHAPTER 3: Case study of seven commercial pasture-based automatic milking 336
systems’ robot utilisation and their pasture management practices 337
Table 1 Farm location (state), cows (peak), brand (manufacturer of robot), robots 338
(count of milking units), grazing area (GA; ha), years of operation (Y; years), furthest 339
walking distance to paddock (D; km) and main animal breed (B) ……….…………. 51 340
Table 2 Predicted means for daily milking frequency (MF, milkings per cow per 341
day), milk yield (MY, milk yield per cow per day), cows milked (cows per robot) 342
and milkings (milkings per robot per day) ….……… 55 343
CHAPTER 4: Robot utilisation of pasture-based dairy cows with varying levels 344
of milking frequency 345
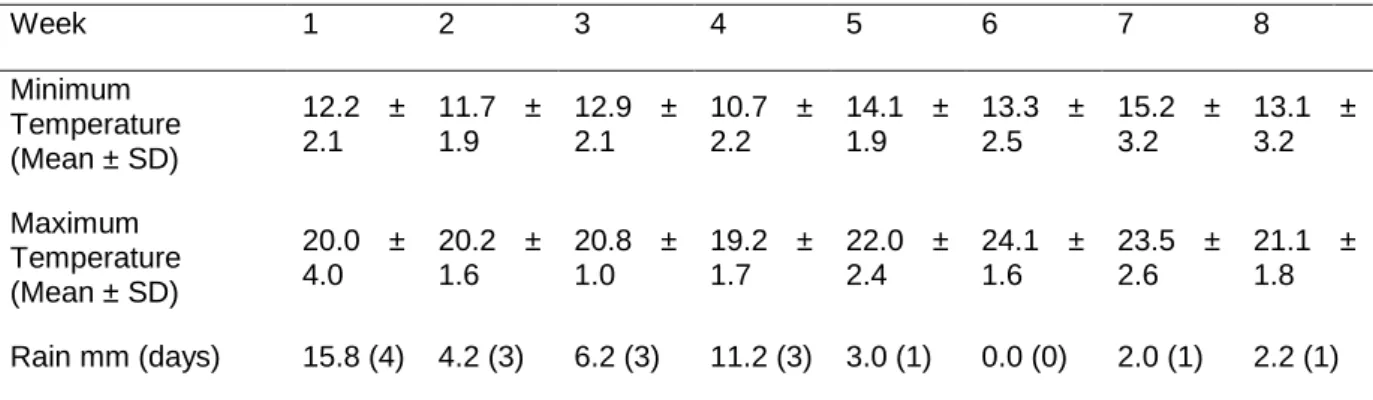
Table 1 Weekly averages for minimum temperature, maximum temperature 346
and total rainfall ………..……….. 71 347
Table 2 Three-way grazing parameters ………..………..….. 74 348
Table 3 Predicted Means for MF Group ………... 75 349
Table 4 Proportion of milkings (mean % ± SE) occurring either early, mid or late 350
within each pasture allocation for high, medium and low milking frequency 351
groups ………... 77 352
CHAPTER 5: Diurnal feed intake and lying behaviour of dairy cows when access 353
to a feed of consistent nutritive value is restricted 354
Table 1 The proportion (mean % ± SEM) of total dry matter intake consumed 355
in each feeding period ………..………….…..……… 95 356
xix
CHAPTER 6: The impact of temporal variation in feed quality and quantity on the 357
diurnal feeding behaviour patterns of non-lactating dairy cows 358
Table 1 Feed type and quantity offered in the four daily feeding periods for each 359
treatment ……….... 110
360
CHAPTER 7: The effect of temporal variation of pasture quantity on milking 361
robot utilisation 362
Table 1 Weekly (mean ± SD) minimum temperature, maximum temperature 363
and total rainfall ………..……… 131 364
Table 2 Experimental treatments, including quantity of herbage allocated and 365
proportion of herbage allocated per hour of access for each pasture allocation 366
……….. 133 367
Table 3 Predicted means for animal performance during each treatment 368
(CONTROL, DAY and NIGHT), reported on a per cow per day basis ……. 137 369
xx
Publications Originated from this Candidature
370
Publications in peer-reviewed journals 371
John AJ, Clark CEF, Freeman MJ, Kerrisk KL, Garcia SC and Halachmi I 2016. 372
Review: Milking robot utilization, a successful precision livestock farming 373
evolution. Animal 10, 1484-1492. 374
John AJ, Garcia SC, Kerrisk KL, Freeman MJ, Islam MR and Clark CEF 2017. Short 375
communication: The diurnal intake and behavior of dairy cows when access to a 376
feed of consistent nutritive value is restricted. Journal of Dairy Science 100, 377
9279-9284. 378
Manuscripts submitted to peer-reviewed journals 379
John AJ, Freeman MJ, Kerrisk KL, Garcia SC and Clark CEF 2018. Robot utilisation 380
of pasture-based dairy cows with varying levels of milking frequency. Manuscript 381
submitted to Animal, January 2018. 382
John AJ, Garcia SC, Kerrisk KL, Freeman MJ, Islam MR and Clark CEF 2018. The 383
impact of temporal variation in feed quality and quantity on the diurnal feeding 384
behaviour of dairy cows. Manuscript submitted to Animal, March 2018. 385
John AJ, Cullen BR, Oluboyede K, Freeman MJ, Kerrisk KL, Garcia SC and Clark CEF 386
2018. The impact of pasture quantity temporal variation on milking robot 387
utilisation. Manuscript submitted to Journal of Dairy Science, March 2018. 388
Non peer-reviewed conference papers 389
John A, Freeman M, Kerrisk K and Clark C 2015. Herd Synchronisation in a Pasture-390
Based Automatic Milking System. In Dairy Research Foundation's 2015 391
Symposium, pp. 122-127. The University of Sydney, Camden, Australia. 392
xxi
John A, Garcia S, Freeman M, Kerrisk K and Clark C 2016. Diurnal feeding patterns 393
of dairy cattle and implications for automatic milking systems. In Dairy Research 394
Foundation's 2016 Symposium, pp. 80-85. The University of Sydney, Wagga 395
Wagga, Australia. 396
John A, Garcia S, Kerrisk K, Freeman M, Islam M and Clark C 2017. Manipulating the 397
diurnal feeding behaviour of dairy cows using feed type and quantity. In Dairy 398
Research Foundation's 2017 Symposium, pp. 91-95. The University of Sydney, 399
Port Macquarie, Australia. 400
General Publications 401
John, A and Kerrisk, K 2017. Increasing overnight milking sessions on AMS farms. 402
The Australian Dairyfarmer, May-June. pp. 88 403
404
Awards
405
Awarded “Emerging Scientist - Best Paper” at Dairy Research Foundation’s 2017 406
Symposium, Port Macquarie, Australia. 407
xxii
Confirmation of Co-Authorship of Published Work
408
Publication 1 409
I, Alex James John, critically analysed published sources of literature which relate to 410
robot utilisation in automatic milking systems. I selected the appropriate papers and 411
summarised their content into a literature review, including all relevant material 412
pertaining to the study, or has influence on, robot utilisation in automatic milking 413
systems. The review highlighted topics and concepts not previously covered by 414
reviews of automatic milking systems. I produced a series of figures summarising the 415
robot utilisation patterns previously reported in the literature. 416
The review is titled “Review: Milking robot utilization, a successful precision livestock 417 farming evolution”. 418 419 Student ________________________________ Date __21/03/2018____ 420
I, as a Co-Author, endorse that this level of contribution by myself and the candidate 421
indicated above is appropriate. 422
Dr Cameron Clark ________________________ Date __21/03/2018____ 423
Mr Mark Freeman ________________________ Date ___21/03/2018___ 424
Dr Kendra Kerrisk ________________________ Date __22/03/2018____ 425
Dr Sergio Garcia _________________________ Date ___22/03/2018___ 426
Prof. Ilan Halachmi _______________________ Date __21 March 2018__ 427
xxiii Publication 2
428
I, Alex James John, as a co-author, contributed to the experimental work, data 429
collection and analysis and the writing up of the publication listed below. Dr Rafiq Islam 430
assisted with laboratory analysis of feed samples. Dr Cameron Clark, Mr Mark 431
Freeman, Dr Sergio Garcia and Dr Kendra Kerrisk assisted in finalising the manuscript 432
prior to submission. 433
The publication is titled “Short communication:The diurnal intake and behavior of dairy 434
cows when access to a feed of consistent nutritive value is restricted”. 435
436
Student ________________________________ Date __21/03/2018____ 437
I, as a Co-Author, endorse that this level of contribution by myself and the candidate 438
indicated above is appropriate. 439
Dr Sergio Garcia _________________________ Date ___22/03/2018___ 440
Dr Kendra Kerrisk ________________________ Date ___22/03/2018___ 441
Mr Mark Freeman ________________________ Date ___21/03/2018____ 442
Dr Rafiq Islam ___________________________ Date __21/03/2018_____ 443
Dr Cameron Clark ________________________ Date __21/03/2018_____ 444
Alex J John PhD Thesis • Page 1 445 446 447 448 449 450
CHAPTER 1: General Introduction
451 452 453 454 455 456 457 458 459 460 461 462
Alex J John PhD Thesis • Page 2 1.1 Introduction
463
Automatic milking systems (AMS) represent a relatively new development in the 464
Australian dairy industry, with the first Australian AMS installed in 2001 (Greenall et 465
al., 2004). Dairy farming in Australia has faced many challenges, both past and 466
present, and AMS represents a new opportunity to address some of those challenges. 467
AMS has the potential to reduce the need for labour, improve conditions for farm staff 468
and improve animal welfare. However, there are many challenges that need to be 469
addressed when incorporating AMS with grazed herbage, and for this reason, the 470
uptake of AMS has been relatively slow as the industry continues to learn from the 471
early adopters. Adoption is now increasing, and although still a small segment of the 472
Australian dairy industry with only 40 farms nationwide, AMS provides a glimpse into 473
the future of dairy farming. 474
1.11 Overview of Australian dairy industry
475
The dairy industry is Australian’s third largest agricultural industry, valued at $3.7 476
billion (Dairy Australia, 2017). This value is generated from 1.5 million cows, producing 477
9 billion litres of milk annually, milked across 5,789 farms. The dairy industry provides 478
direct employment for 24,500 people, with a further 17,600 employed in dairy product 479
manufacturing. The majority of farms are located in Victoria (67%), followed by New 480
South Wales (11%), Tasmania (8%), Queensland (7%), South Australia (4%) and 481
Western Australia (3%), respectively. Annual milk production has remained relatively 482
steady during the past decade, despite the number of dairy farms decreasing over the 483
same period. In order to take advantage of increased economy of scale and with the 484
national herd size remaining relatively constant, the average herd size has increased 485
from 85 cows in 1980 to 261 cows in 2017 (Dairy Australia, 2017). 486
Alex J John PhD Thesis • Page 3
1.12 Product markets
487
Export markets are an important avenue for Australian dairy products and world 488
market prices have a large impact on the income Australian farmers receive for their 489
milk. Thirty-seven percent of all milk produced was destined for the international 490
market in 2017. International sales of milk powder, butter and cheese contributed $3 491
billion to the Australian economy, whilst representing 8% of global trade in 2017 (Dairy 492
Australia, 2017). The main destination for these products is South East Asia, 493
accounting for 80% of Australian dairy exports, and due to the growing affluence per 494
capita income of citizens within this region, is an important export market for Australian 495
dairy trade. With an open market, manufactured dairy products consumed 496
domestically are still subject international pricing in order to remain competitive against 497
imported counterparts. This is reflected in the price farmers receive for the milk they 498
produce, particularly in Victoria, Tasmania, and to an extent South Australia, where 499
most of the milk produced is manufactured into a range of dairy products. In contrast, 500
100% of milk produced in Queensland is consumed domestically as fresh milk. This 501
creates a wide range in the price farmers receive for their milk, ranging from 37.1 cents 502
per litre in South Australia through to 60 cents per litre in Queensland (Dairy Australia, 503
2017). This disparity is also reflected in the cost of production and the types of 504
production systems prevailing in each state, with 1 kg of milk solids (fat and protein) 505
costing $6.13 to produce in Queensland, compared to $4.15 in Victoria, due to feed 506
generally costing more in Queensland. 507
1.13 Feeding systems
508
A range of farming systems are used throughout Australia and can be categorised into 509
five distinct feeding systems (Little, 2010). Feeding systems 1 and 2 are similar, both 510
feeding grazed herbage and fodder and either supplemented with <1 t or >1 t of grain 511
Alex J John PhD Thesis • Page 4
or concentrate per cow per lactation and represents 30% and 50% of Australian farms, 512
respectively. System 3 accounts for a further 11% of farms and introduces partial 513
mixed ration (PMR) to the diet, offered on a feed pad, alongside grazed herbage for 514
most or all the year. Approximately 5% of farms use system 4, which is similar to 515
system 3 except that herbage is grazed for less than 9 months of the year. In system 516
5 cows are “housed” indoors and offered a total mixed ration (TMR), representing 517
approximately 2% of farms. 518
519
Figure 1 Distribution of feeding systems (1 , 2 , 3 , 4 , 5 , Other ) by state, 520
derived from Little (2010) 521
The prevalence of each feeding system varies throughout Australia (Figure 1), based 522
on the economic, geographic and climatic conditions of each region (Rawnsley et al., 523
2013). Two out of three farms in Queensland and New South Wales use system 1 or 524
2. In South Australia, Western Australia and Victoria that figure increases to four of 525
five; whilst in Tasmania, nine out of ten farms use feeding systems 1 or 2. The 526
Alex J John PhD Thesis • Page 5
dominance of systems 1 and 2 is due to grazed herbage being the cheapest source 527
of feed available. The ability to utilise home-grown feed allows Australia to remain 528
competitive in the global milk market, as cost of production is relatively low compared 529
to most other countries (Dillon et al., 2005). Grazing systems continue to evolve as 530
cost of production and competition for natural resources increases. Research has 531
shown the potential to grow 42 t DM per ha per year using maize (Zea mays L.), forage 532
rape (Brassica napus L.) and Persian clover (Trifolium repesinatum L.), compared to 533
17 t DM per ha per year using kikuyu (Pennisetum clandestinum Hoach ex Chiov.) 534
over-sown with ryegrass (Lolium multiforum L.), whilst keeping nitrogen and water 535
inputs similar between forage systems (Garcia et al., 2008). This ability to utilise large 536
quantities of home-grown feed translates into highly profitable businesses, with 537
pasture utilisation directly linked to farm profits (Romera and Doole, 2015) and allows 538
Australia to be a world leader in global dairy exports. 539
1.14 Labour challenges associated with the dairy industry
540
There are many challenges that face the dairy industry, with labour being one of the 541
more pertinent issues identified by industry, as affordable and reliable labour has 542
become more difficult to procure (Nettle and Oliver, 2009). In the 5 years prior to the 543
report by Nettle and Oliver (2009), 59% of dairy farms in Australia had job vacancies 544
within their business and half had difficulty filling vacancies. Associated with the 545
difficulty of finding labour, staff retention is also a major issue within the dairy industry, 546
with poor working conditions, career development and lucrative alternatives, such as 547
the mining industry, cited as leading to a high staff turnover rate (Nettle et al., 2011). 548
A major component of work on dairy farms is the milking process itself, which accounts 549
for one-third of a farmer’s working day (Clarke, 2018) and consigns much of the 550
working day to performing strenuous and repetitive tasks. As the timing of milking 551
Alex J John PhD Thesis • Page 6
sessions is typically fixed, with one session generally scheduled early in the morning 552
and one late in the afternoon, seven days per week, there is minimal flexibility in 553
working hours and limited opportunity for time off. To solve this issue, human resource 554
development has become a key focus area for the dairy industry moving forward 555
program (Dairy Australia, 2016). Automation of tasks on dairy farms, especially 556
milking, is one potential solution addressing labour issues in the industry. 557
1.15 Introducing automatic milking systems
558
In AMS, milking is performed automatically, with robots removing the need for hands-559
on human involvement in the milking process. This requires the robot to perform all 560
milking related tasks including animal identification, teat preparation, cup attachment, 561
milk quality monitoring and post milking sanitation (de Koning, 2011). Additionally, the 562
robot must utilise a range of sensors to monitor and identify health anomalies and take 563
the appropriate action, such as separation of contaminated milk and if necessary 564
automatically draft an affected animal out of the herd for farmer intervention. 565
There are three important differences between pasture-based AMS and conventional 566
milking systems (Kerrisk, 2010). First, the system relies on voluntary cow traffic, with 567
cows free to move around the system. The aim of voluntary traffic is for cows to move 568
between allocations of pasture and the dairy without the need for manual intervention 569
by the farmer. Second, milking is possible throughout 24 h, rather than being 570
performed only at defined times. This creates the possibility to increase cow milking 571
frequency (MF). Stockdale (2006) has shown that an increase from 2 to 3 milkings per 572
cow per day, can improve a cow’s daily milk yield by 3.5-3.8 kg MS regardless of 573
existing milk yield. The caveat however, is that increased MF is not guaranteed and is 574
reliant on establishing consistent voluntary cow traffic. Third, AMS operates an 575
incentive-based system to encourage voluntary cow traffic. Currently, feed is used as 576
Alex J John PhD Thesis • Page 7
the incentive that encourages cows to traffic through the system (Prescott et al., 1998). 577
This requires accurate allocation of feed in order to optimise cow trafficking throughout 578
24 h. 579
The majority of AMS farms use what are commonly referred to as “box robots”, 580
whereby cows enter an individual stall, and a single robotic arm performs all milking 581
related tasks. A variation of this system is the “multi-box” robot, which has a single arm 582
capable of moving between multiple boxes. These box systems are generally used to 583
milk 60 cows per robot, with multiple robots being used to milk larger herds (de Koning, 584
2011). More recently, developments for larger farms milking more than 500 cows has 585
seen the invention of the automatic milking rotary (DeLaval AMR, Tumba, Sweden), 586
with 24 bails and 5 robotic arms. In comparison to the 6-10 milkings per hour 587
throughput of box robots, the AMR is capable of up to 90 milkings per hour, making 588
AMS technology feasible for Australia’s larger average herd size (Future Dairy, 2012). 589
This throughput has been further improved to between 120-400 cows per hour with 590
the DairyProQ (GEA, Dusseldorf, Germany) robotic rotary, containing 28-80 bails, 591
each with their own robotic arm. 592
1.16 Why farmers choose automatic milking systems
593
Automatic milking systems provide an alternative for farmers facing challenges with 594
labour, removing the repetitive and labour-intensive task of milking and thereby 595
allowing farmers to redistribute their time to other tasks. Dutch farmers realised a 596
labour saving of 20% after transitioning from a conventional milking system to AMS 597
(Mathijs, 2004). This is reflected in the decision-making process of Europe dairy 598
farmers who considered adopting AMS, with the improved lifestyle that robots provide 599
being more important than outright profitability (Jensen, 2004, Kerrisk and Ravenhill, 600
2010). Improvements to working hours have also been observed in pasture-based 601
Alex J John PhD Thesis • Page 8
AMS, with an audit of 5 AMS farms in Australia finding the typical work day began at 602
0740 h and generally ended at 1720 h (Molfino et al., 2014). However, the initial 603
commissioning of a pasture-based AMS has often been difficult for farmers and getting 604
the system running smoothly has taken up to 12 months in most cases (Kerrisk and 605
Ravenhill, 2010). Achieving consistent RU throughout 24 h is important to the efficient 606
running of an AMS. The aim of this thesis is to provide a thorough understanding of 607
cow feeding behaviour in response to changes in feeding management (quantity and 608
quality) and apply this knowledge to improve RU in pasture-based AMS through the 609
formulation of novel feeding strategies. 610
611
1.2 References 612
Clarke P 2018. Discussion groups - Labour efficiency and practices. In 2018 Irish 613
Grassland Association Annual Dairy Conference, Cork, Ireland. 614
Dairy Australia 2016. Australian Dairy Industry Sustainability Report 2016. Dairy 615
Australia, Melbourne, Australia. 616
Dairy Australia 2017. Dairy Industry in Focus 2017. Dairy Australia, Melbourne, 617
Australia. 618
de Koning C 2011. Automatic Milking: Common Practice on Over 10,000 Dairy Farms 619
Worldwide. In Proceedings of Dairy Research Foundation Symposium 16, 620
Camden, NSW, pp. 14-31. 621
Dillon P, Roche J, Shalloo L and Horan B 2005. Optimising the financial return from 622
grazing in temperate pastures. In Proceedings of a satellite workshop of the XXth 623
International Grassland Congress, Cork, Irleand, 624
Alex J John PhD Thesis • Page 9
Future Dairy 2012. Robotic Rotary: Automatic milking for larger herds. Future Dairy, 625
Camden, Australia. 626
Garcia SC, Fulkerson WJ and Brookes SU 2008. Dry matter production, nutritive value 627
and efficiency of nutrient utilization of a complementary forage rotation compared 628
to a grass pasture system. Grass Forage Science 63, 284-300. 629
Greenall R, Warren E, Warren M, Meijering A, Hogeveen H and de Koning C 2004. 630
Integrating automatic milking installations (AMIs) into grazing systems - Lessons 631
from Australia. In Automatic Milking - A Better Understanding, Wageningen, The 632
Netherlands, pp. 273-279. 633
Jensen T 2004. Expectations of automatic milking and the realized socio-economic 634
effects. In Automatic Milking: A Better Understanding (eds. A Meijering, H 635
Hogeveen and C De Koning), pp. 78-79, Wageningen Academic Publishers, 636
Wageningen, The Netherlands. 637
Kerrisk K 2010. Management Guidelines for Pasture-Based AMS Farms. Dairy 638
Australia, Melbourne, Australia. 639
Kerrisk K and Ravenhill B 2010. Automatic Milking Systems: Experience from early 640
adopters. FutureDairy, Camden, Australia. 641
Little S 2010. Feeding Systems Used by Australian Dairy Farmers. Dairy Australia, 642
Melbourne, Australia. 643
Mathijs E 2004. Socio-economic aspects of automatic milking. In Automatic Milking: A 644
Better Understanding, Wageningen, The Netherlands, pp. 46-55. 645
Molfino J, Kerrisk K and Garcia S 2014. Investigation into the labour and lifestyle 646
impacts of automatic milking systems (AMS) on commercial farms in Australia. 647
In 5th Australasian Dairy Science Symposium, Hamilton, New Zealand, 648
Alex J John PhD Thesis • Page 10
Nettle R and Oliver D 2009. Workforce planning and action for the Australian dairy 649
industry. University of Melbourne, Victoria, Australia. 650
Nettle R, Semmelroth A, Ford R, Zheng C and Ullah A 2011. Retention of people in 651
dairyfarming – what is working and why? Gardiner Foundation, Melbourne, 652
Australia. 653
Prescott N, Mottram T and Webster A 1998. Relative motivations of dairy cows to be 654
milked or fed in a Y-maze and an automatic milking system. Applied Animal 655
Behaviour Science 57, 23-33. 656
Rawnsley RP, Chapman DF, Jacobs JL, Garcia SC, Callow MN, Edwards GR and 657
Pembleton KP 2013. Complementary forages – integration at a whole-farm level. 658
Animal Production Science 53(9), 976-987. 659
Romera AJ and Doole GJ 2015. Optimising the interrelationship between intake per 660
cow and intake per hectare. Animal Production Science 55, 384-396. 661
Stockdale CR 2006. Influence of milking frequency on the productivity of dairy cows. 662
Australian Journal of Experimental Agriculture 46, 965-974. 663
Alex J John PhD Thesis • Page 11 664 665 666 667 668 669
CHAPTER 2: Review: Milking
robot utilization – a successful
670
precision livestock farming evolution
671 672 673 674 675 676 677 678 679 680 681 682
Alex J John PhD Thesis • Page 12 2.1 Overview of Chapter 2 683
The increase in prevalence of automatic milking systems requires continual reflection 684
and development of scientific knowledge. Robot utilisation is an area of automatic 685
milking systems where improvement is likely to realise significant gains for farmers, 686
yet robot utilisation has had minimal attention in the scientific literature. The literature 687
review in Chapter 2 draws together the current knowledge of robot utilisation and 688
suggests a number of areas for research to focus on. 689
Minor changes have been made to this chapter to correct some mistakes found in the 690 published text. 691 692 693 694 695 696 697 698 699 700 701 702
Alex J John PhD Thesis • Page 13 2.2 Abstract
703
Automatic milking systems (AMS), one of the earliest precision livestock farming (PLF) 704
developments, have revolutionised dairy farming around the world. Whilst robots 705
control the milking process, there have also been numerous changes to how the whole 706
farm system is managed. Milking is no longer performed in defined sessions; rather, 707
the cow can now choose when to be milked in AMS, allowing milking to be distributed 708
throughout a 24 h period. Despite this ability, there has been little attention given to 709
milking robot utilization across 24 h. In order to formulate relevant research questions 710
and improve farm AMS management there is a need to determine the current 711
knowledge gaps regarding the distribution of robot utilization. Feed, animal and 712
management factors and their interplay on levels of milking robot utilization across 24 713
h for both indoor and pasture-based systems are here reviewed. The impact of the 714
timing, type and quantity of feed offered and their interaction with the distance of feed 715
from the parlour, herd social dynamics, climate and various other management factors 716
on robot utilization through 24 h are provided. This review identifies both the 717
opportunities and challenges that exist for farm management to use the factors listed 718
above to improve system efficiency through further research. 719 720 721 722 723 2.3 Keywords 724
Automatic milking system, feeding behaviour 725
Alex J John PhD Thesis • Page 14 2.4 Introduction
726
Robotic milking systems have revolutionised the dairy industry. The first dairy cow was 727
milked, more or less without traditional human involvement, in 1986 with a robotic 728
milking box at the experimental farm de Waiboerhoeve, Lelystad, the Netherlands by 729
Gascoigne Melotte, following the US Patent 4010714 A (Notsuki and Ueno, 1977). A 730
system from the company Prolion was installed on the experimental farm IMAG-DLO 731
Duiven, the Netherlands, in 1990 and on a commercial dairy in 1992. More institutes 732
and companies became active in the development of robotic milking systems in the 733
1990s as described by Kuipers and Rossing (1996). Since that time until 2011, 734
automatic milking systems (AMS) have been installed on over 10 000 farms worldwide 735
(de Koning, 2011). These installations are predominantly for ‘indoor’ systems where 736
cows are generally ‘housed’ in barns and offered a partial mixed ration (PMR) in the 737
feeding alley and grain-based concentrate supplement either in the milking unit or in 738
a nearby concentrate self-feeder. Whilst there have been numerous AMS installations 739
in indoor dairy systems, there is an increasing interest regarding the integration of 740
AMS into pasture-based dairy systems. Ketelaar-de Lauwere (1999) pioneered the 741
concept of pasture-based AMS as a hybrid ‘housed grazing’ system in The 742
Netherlands, followed by entirely pasture-based AMS in Australia (Greenall et al., 743
2004), New Zealand (Woolford et al., 2004), and more recently partial grazing in 744
America (Utsumi, 2011) and Ireland (O'Brien, 2012). This interest and global spread 745
in pasture-based AMS is likely to accelerate given the ability to follow established 746
grazing management principles as developed in conventional systems and achieve 747
high levels of pasture utilization (Clark et al., 2015). However, grazing systems add 748
another factor, and element of complexity, to consider when targeting optimised robot 749
utilization. 750
Alex J John PhD Thesis • Page 15
Irrespective of geographic location or feeding regime (PMR or pasture), a milking robot 751
represents a large capital investment for farmers and utilising this investment across 752
the full 24 h period in a day is a requirement to achieve an acceptable return on asset 753
(Wade et al., 2004; Jago et al., 2006). As time is required for the system to wash, 754
coupled with milking failures, periods of non-attendance and technical maintenance, 755
levels of achievable robot utilization of between 20 and 22 h/day are deemed the 756
sustainable maximum (Halachmi, 2004; Lyons et al., 2014). Such high levels of 757
utilization can be achieved by milking more cows/robot, at the expense of reduced 758
herd milking frequency (Woolford et al., 2004); or if milking frequency is maintained, 759
increased waiting time in the pre-milking yard (Halachmi, 2009) and associated 760
reduction in animal health and production due to extended time, away from feed, and 761
increased milking interval. A comprehensive review of milking frequency management 762
conducted by Lyons et al. (2014), provides a good understanding of different factors 763
such as age and experience of the cow, environmental conditions and management 764
strategies that impact the static mean daily milking frequency, however, the dynamic 765
nature of milking robot utilization across a 24 h period, which is of equal importance to 766
the overall performance of any AMS, is still poorly understood. Irrespective of milking 767
frequency targets that may differ with feeding system (Lyons et al., 2014), achieving 768
high milking robot utilization by having cows present to the milking robot across 24 h 769
with minimal waiting time is ideal for all AMS farmers. 770
This review draws together current knowledge on indoor and pasture-based robot 771
utilization across 24 h, with a specific focus on the factors that impact utilization levels. 772
It is the intent of this novel review to explore both the opportunities that exist for 773
improved system efficiencies on-farm and those that exist for further research. 774
Alex J John PhD Thesis • Page 16 2.5 Material and methods 776
A thorough review of the published literature found 15 data sets across 13 studies 777
(Table 1) that provided robot utilization over 24 h. Results from the literature were 778
categorized according to predominant feeding system (indoor or pasture-based AMS). 779
Indoor AMS studies (n=8) predominantly featured an indoor barn or open shed type 780
layout and PMR as the cow’s primary feed source, with some studies including a 781
period of access to pasture during the day. Pasture-based AMS studies (n=7) offered 782
cows grazed herbage as the cow’s primary feed source. Levels of milking robot 783
utilization for each study were converted to a ‘proportion of total milkings/h’ to allow 784
the presentation of results on a common scale (Figures 1 and 2). In this way, achieving 785
4.2% of milkings/h (100%/24 h) would represent an entirely uniform and distributed 786
milking pattern. 787
The number of cows across the studies ranged from 10 to 207, with a mean of 83.9 ± 788
63.0 (± SD). The large disparity in herd size, environment and management between 789
studies needs to be taken into consideration when interpreting the findings. For this 790
reason, possible tendencies as well as significant differences were considered. 791
2.51 Statistical Analysis 792
The distribution of milking robot utilization/h was determined to be normal from visual 793
analysis of normal probability plots. Repeated measures ANOVA function in Genstat 794
16th Edition was used to determine the impact of feeding system (S) (‘indoor’ and
795
‘pasture-based’), cows/robot (R) (‘high’ ≥50 cows/robot and ‘low’ <50 cows/robot) and 796
time of day (T) (0100 h, 0200 h… 2400 h) factors on milking robot utilization using the 797
following model: 798
𝑌𝑖𝑗𝑘 = 𝑇𝑖+ 𝑇𝑆𝑖𝑗 + 𝑇𝑅𝑗𝑘+ 𝜀𝑖𝑗𝑘
Alex J John PhD Thesis • Page 17
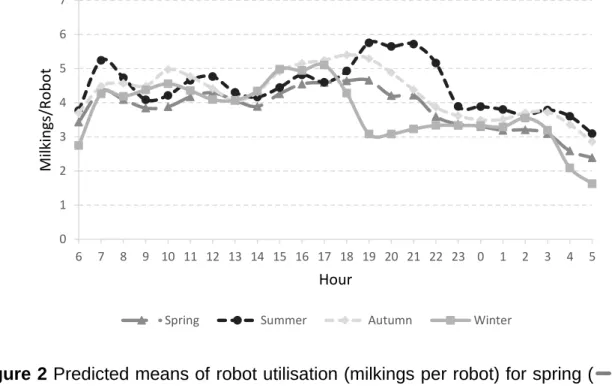
Table 1 Summary of manuscripts reporting 24 h robot utilization for indoor and pasture-based farm systems
Reference Country Farm System Feed Type Robots Animals Breed Cows Study Duration (days)
Belle et al. (2012) The Netherlands Indoors PMR 2 84 HF 42 365
Halachmi et al. (2000) The Netherlands Indoors PMR 1 10 HF 10 18 Halachmi et al. (2001) The Netherlands Indoors PMR 1 10-29 HF 10-29 21
Halachmi (2004) Period A Israel Indoors PMR 1 60 NS 60 15 control period Halachmi (2004) Period B Israel Indoors PMR 1 60 NS 60 15 experimental period Stefanowska et al. (1999) The Netherlands Indoors PMR 2 in 1 24 HF 12 4
Wagner-Storch and Palmer
(2003) USA Indoors - 1 30-43 NS 30-43 270
Winnicki et al. (2010) Poland Indoors PMR 1 59 NS 59 30 and 27
Davis et al. (2005) New Zealand Pasture 2WG 1 75 J, F & JF 75 30
John et al. (2013) Farm A Australia Pasture 3WG 3 207 JF 69 60
John et al. (2013) Farm B Australia Pasture 3WG 3 166 JF 55 60
Lyons et al. (2013b) Australia Pasture 3WG 2 145 H & I 73 18 Scott et al. (2015) Australia Pasture 2WG AMR 175 H & I N/A 35 Van Dooren et al. (2004) The Netherlands Pasture PMR + G 2 in 1 60 NS 30 15-31
Woolford et al. (2004) New Zealand Pasture 2WG 1 38 NS 38 240
PMR = Partial Mixed Ration; 2WG = Two-Way Grazing; 3WG = Three-Way Grazing; G = Grazing; 2 in 1 = two boxes with one robotic arm; AMR = Automatic Milking Rotary; HF = Holstein Friesian; J = Jersey; JF = Jersey Friesian Cross; H = Holstein; I = Illawarra; NS = Not Specified
Alex J John PhD Thesis • Page 18
where Y is the dependent variable (proportion of total milkings/h) and 𝜀𝑖𝑗𝑘 is the 801
random error. Due to the source data requiring transformation to proportion of total 802
milkings/h allowing for comparison between studies, the main factors ‘feeding system’ 803
and ‘cows/robot’ were unable to be statistically compared as individual main factors, 804
as the categories within these factors all shared the same mean of 4.2% milkings/h. 805
Mean hourly robot utilization and standard deviation were calculated for both feeding 806
systems. The lack of replicates within regions (Australia, The Netherlands, New 807
Zealand, USA, Israel and Poland) prevented region being a factor in the analysis.
808
809
2.6 Results 810
Across all studies, the distribution of milking robot utilization varied by time of day (P 811
< 0.01). Levels of robot utilization through time for each individual farm are shown in 812
Figures 1 (indoor farms) and 2 (pasture-based farms). 813
There was no interaction (P = 0.43) between cows/robot and time of day on milking 814
robot utilization through time. Likewise, the interaction between feeding system and 815
time of day on robot utilization through time was not significant (P = 0.24), although 816
both feeding systems tended to have reduced milking robot utilization in the early 817
hours of the morning (0200 and 0600 h) with the reduction in number of milkings during 818
the morning greater for pasture-based feeding systems (Figure 3) and 50% more 819
variability in the proportion of milkings across time for pasture-based (SD = 0.9%) 820
compared to indoor (SD = 0.6%) feeding systems. 821
Alex J John PhD Thesis • Page 19 823
Figure 1 Proportion of milkings/h (% total) for dairy cattle in indoor automatic milking 824
systems from Belle et al. (2012) ( ), Halachmi et al. (2000) ( ), Halachmi 825
et al. (2001) ( ), Halachmi (2004) (period A ; period B ), 826
Stefanowska et al. (1999) ( ), Wagner-Storch and Palmer (2003) ( ) and 827
Winnicki et al. (2010) ( ) 828
829
Figure 2 Proportion of milkings/h (% total) for dairy cattle in pasture-based automatic 830
milking systems taken from Davis et al. (2005) ( ), John et al. (2013) (farm A 831
; farm B ), Lyons et al. (2005) ( ), Scott et al. (2015) ( ), 832
van Dooren (2004) ( ), and Woolford et al. (2004) ( ) 833
Alex J John PhD Thesis • Page 20 834
Figure 3 Mean proportion of dairy cattle milkings/h (% total) for pasture-based ( , 835
SD = 0.9%, n = 7), and indoor ( , SD = 0.6%, n = 8), automatic milking systems 836
837
2.7 Discussion 838
The following discussion examines factors impacting robot utilization through time and 839
has been divided into three main sections: feed, animal and management factors. 840
Each of these factors are explored through the 15 data sets provided in the current 841
analysis as well as drawing on information from 53 other studies relating to AMS. 842
2.71 Feed factors
843
Timing of allocation. Given the choice of consuming feed or being milked, cows will 844
choose the option to consume feed (Prescott et al., 1998). As such, feed is the most 845
important influence on voluntary cow traffic in both indoor and pasture-based AMS. 846
Therefore, the timing, type and quantity of feed offered play vital roles in encouraging 847
voluntary cow traffic in AMS. Pasture-based cows seek out and ingest feed (graze) 848
during daylight hours predominantly around dawn and dusk, with night feeding activity 849
only accounting for 10-15% of daily grazing time and intake (Stobbs, 1970; Krysl and 850
Hess, 1993). These behaviours can be attributed to a multitude of factors, including 851
Alex J John PhD Thesis • Page 21
variation in diurnal feed quality, photoperiod and cow hormone levels (Gregorini, 852
2012). Decreased milking robot utilization in pasture-based AMS during the period 853
0200 to 0600 h (Figure 2) can be primarily attributed to the circadian eating behaviour 854
of cows, with pasture-based cows exhibiting a more diurnal pattern compared to those 855
offered a PMR (Jago et al., 2005). 856
Diurnal feeding behaviour has also been observed in indoor dairy systems (DeVries 857
et al., 2003). Wagner-Storch and Palmer (2003) observed a large decline in both feed 858
bunk activity and milking robot utilization in the early morning period of an indoor AMS, 859
with the majority of feed bunk utilization between 0700 and 2000 h and robot utilization 860
following a similar trend. Differences between indoor AMS voluntary traffic across time 861
are likely related to feed bunk activity as per Halachmi et al. (2000) where feed bunk 862
activity was evenly distributed throughout 24 h alongside milking robot utilization. This 863
hypothesis is supported by DeVries et al. (2005) who found an increase in feeding 864
activity and diurnal feeding pattern during the early morning when PMR was offered 865
four times per day as compared to two times per day. However, the evenly distributed 866
milking robot utilization achieved in the Halachmi et al. (2000) study was likely 867
influenced by the 6 h (four feeding periods per day) concentrate feeding regime, along 868
with the PMR offered in this system, whereby each animal could access a new 869
allocation of concentrate in each of the four feeding periods. As cow feeding activity is 870
the main motivator for voluntary cow traffic to and from the milking robots (Prescott et 871
al., 1998; Kerrisk, 2010) and appears to be linked with milking robot utilization, ways 872
to alter the number and timing of feed allocations, both forage and concentrate, to 873
achieve an evenly distributed feeding pattern throughout 24 h is a clear opportunity for 874
improving robot utilization for indoor AMS and for future research particularly on 875
pasture-based AMS. 876
Alex J John PhD Thesis • Page 22
Reduced early morning milking frequency and milking robot utilization in pasture-877
based AMS was the basis behind the work of Lyons et al. (2013b). This work aimed 878
to modify the diurnal pattern by offering a third allocation of pasture, known as three-879
way grazing (3WG), within a 24 h period, compared to offering two-way grazing. With 880
3WG, milking robot utilization levels were increased throughout the day and remained 881
consistent throughout 24 h. However, most pasture-based AMS farmers in Australia 882
use 3WG and still report a decline in milking robot utilization at night in commercial 883
systems (N. Lyons, personal communication). Dalley et al. (2001) offered fresh 884
pasture between 0200 - 0600 h and found decreased grazing duration during daylight 885
whilst maintaining total time spent grazing, highlighting the ability to manipulate when 886
cows are actively eating without impacting intake. Also, Livshin et al. (1995) found that 887
cows subjected to 4 and 6 h feeding periods were able to learn each routine and adapt 888
the timing of their movement to, and from, the feed bunk to match the duration of the 889
feeding period applied. Thus, voluntary attendance to the grain-based concentrate 890
feeders was a result of the cows ‘learning’ the system, raising the possibility of 891
controlling AMS cow traffic by modifying the frequency of feeding. The work of Belle 892
et al. (2012) found early morning milking robot utilization was greater on farms using 893
an automatic TMR feeder compared to conventional TMR feeding, with an automatic 894
feeding event in the early morning possibly encouraging the cows to move to the feed 895
bunk at this period of the morning. This may partially explain the earlier increase in 896
milking robot utilization levels observed in the indoor AMS studies in Table 1, as cows 897
may have increased motivation to move through the milking robot due to PMR being 898
available and of consistent nutritive value. Thus, manipulating the diurnal feeding 899
patterns of cows is one of the key areas that is both under the control of the farmer 900
Alex J John PhD Thesis • Page 23
and likely to have an impact on cow grazing behaviour and therefore warrants further 901
investigation. 902
Feeding system. From the compilation of literature presented as Figures 1 and 2, dairy 903
cows tend to be more motivated to consistently visit the milking robot throughout 24 h 904
in an indoor AMS, compared to pasture-based AMS. A possible explanation for these 905
findings is the consistent nutritive value of a PMR compared to pasture as per Charlton 906
et al. (2011a), who showed when given the choice, cows will prefer PMR versus 907
pasture two out of three times, with an even larger difference found in the total time 908
spent indoors (92%) as compared with pasture (8%). In contrast, studies by Charlton 909
et al. (2011b) and Motupalli et al. (2014) found a partial preference for cows to be at 910
pasture versus indoors. Motupalli et al. (2014) hypothesised that the animal’s lack of 911
exposure to pasture in the study by Charlton et al. (2011a) was the likely cause for 912
their greater preference to be indoors compared to the other studies. Clark (2013) 913
found the herbage intake of individual animals in pasture-based AMS varies in quality 914
and quantity depending on when a cow enters the pasture allocation, as herbage has 915
been shown to decrease in nutritive value as it is grazed over the duration of its 916
allocation. These findings concur with those of Ketelaar-de Lauwere et al. (2000), who 917
found an increased number of visits to the robotic milking unit as herbage mass (and 918
presumably quality) decreased. The consistency of PMR quality compared to the 919
inconsistent characteristics of grazed herbage, is a clear distinction between indoor 920
and pasture-based systems and likely to be a key factor in the larger variability in robot 921
utilization seen in pasture-based AMS farms throughout the day. 922
Dairy cows are highly selective when presented with multiple forage options and this 923
preference changes not only with forage species, but also across seasons, with water 924
soluble carbohydrate (WSC) content of the forage the main driver of cow preference 925
Alex J John PhD Thesis • Page 24
(Horadagoda et al., 2009). Indoors, the replacement of roughage by soy hulls (greater 926
NDF digestibility) had no impact on total dry matter intake or attendance rate to the 927
milking robot (Halachmi et al., 2006), though an increase in milk production was 928
observed due to an increased intake of digestible NDF (Halachmi et al., 2004). 929
Likewise, the incorporation of grazed soybean (Glycine max) into the rotation of a 930
pasture-based AMS has also been investigated (Clark et al., 2014b); however, there 931
was no significant improvement in voluntary traffic or milk yield associated with grazing 932
a soybean (WSC = 10.0% DM) and kikuyu (Pennisetum clandestinum Hoach ex 933
Chiov.) sward (WSC = 8.5% DM) compared to a kikuyu sward alone. Despite the cow 934
preference for forages with a greater content of WSC, it would appear that levels of 935
WSC, or the type of forage offered, have limited impact on voluntary cow traffic 936
particularly when forages are located away from the milking robot as per pasture-937
based AMS. However, Raubenheimer and Simpson (2007) suggest, through their 938
geometric framework approach to nutrition, that behavioural and physiological 939
responses cannot be attributed to a single limiting component such as WSC, rather, 940
animals have a dynamic intake target for different macronutrients based on their 941
current physiological state. Therefore, the ratio of macronutrients, in this case protein 942
and carbohydrates, may play a role in a cow’s willingness to seek out certain feeds 943
and presents