International Classification of Diseases categories,
2006-2009
Utilization and Costs
Data Points #5
In 2009, Medicare reimbursement for inpatient claims totaled $126.7 billion, more than 25 percent of which was for circula-tory diseases. The total per claim reimburse-ment was greatest for congenital anomalies, about $15,600 per inpatient claim. In 2009, Medicare reimbursement for
noninstitutional outpatient (Carrier) claims totaled $81.7 billion, about 15 percent of which was for circulatory diseases. The total per claim reimbursement was greatest for neoplasms, about $225 per Carrier claim.
In 2009, Medicare reimbursement for skilled nursing facility claims totaled $25.5 billion, more than 30 percent of which was for supplementary classification of factors influencing health status and contact with health services (V-codes). The total per claim reimbursement was also greatest for V-codes, nearly $5,200 per skilled nursing facility claim.
Findings above are reflective of population under study (discussed on p. 8). The United States spends more on health care per capita
than any other developed country in the world.1 Health
care is currently responsible for 16.2 percent of the Gross Domestic Product (GDP) in the United States but is expected to rise to 25.2 percent by 2025.2,3 Chronic diseases account for the greatest surge in spending. High costs are associated with many chronic diseases that are increasing in prevalence, including mental disorders, hypertension, heart disease, pulmonary disorders, spine-related care, gastrointestinal upset, and kidney disease.2,4,5,6
Chronic diseases disproportionately affect older adults.2
Among the Medicare population, 10 conditions account for half of the inflation-adjusted growth in spending for Medicare in the past two decades.7 Specifically, the most
notable increases in recent spending are attributable to diabetes, chronic obstructive pulmonary disease, kidney disease, hyperlipidemia, hypertension, mental disorders, and arthritis. Hypertension alone has been associated with $108.8 billion in expenditures.8 Multiple comorbidities further
contribute to high spending by Medicare; heart failure and diabetes together result in greater Medicare spending than either condition alone.9 These pervasive conditions require
considerable care in inpatient, outpatient, and skilled nursing home settings. Also, specific conditions are more burden-some in a particular setting, rather than across settings. For example, wound care is most prevalent in skilled nursing home facilities and comprises a large portion of Medicare reimbursement.10
The goal of this Data Points is to examine disease burden among Medicare beneficiaries and associated reimbursement costs within inpatient, outpatient, and skilled nursing facility claims. Further, we examine geographic trends in reimburse-ment per claim for high-cost conditions that are common in the Medicare population.
Data Points • #5 • Prevalence and Medicare reimbursement by recurrent ICD-9 categories, 2006-2009
FINDINGS
†Inpatient Claims
In 2009, nearly 14.7 million inpatient claims were submit-ted to Medicare. The total Medicare reimbursement on these claims was $126.7 billion, up from $118.1 billion in 2006. Based on the principal diagnosis on each inpatient claim, the International Classification of Diseases, 9th Revision (ICD-9) chapters accounting for the five highest Medicare reimbursements were: (1) Diseases of the circulatory system;
(2) Diseases of the respiratory system; (3) Injury and poisoning;
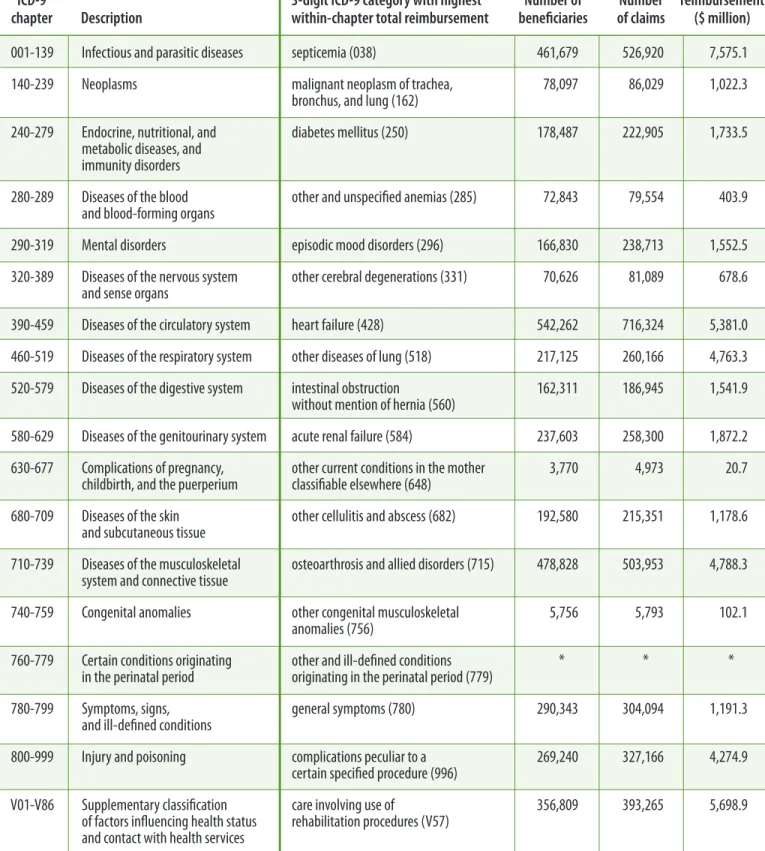
(4) Diseases of the digestive system; and (5) Diseases of the mus-culoskeletal system and connective tissue. These rankings did not change over the 4-year study period (see Study Pe-riod, p. 8), as illustrated in Figure 1. Total Medicare reim-bursements per claim are presented in Figure 2. Of note, the ICD-9 chapters accounting for the highest Medicare re-imbursements per claim did not overlap with those with the highest total reimbursements overall, except for Injury and poisoning. For each of the 18 ICD-9 chapters, Table 1 lists the 3-digit ICD-9 categories representing the highest total Medicare reimbursement among inpatient claims.
Noninstitutional O
u
tpatient (Carrier) Claims
In 2009, more than 841.8 million noninstitutional outpatient claims (as identified via the Carrier file) were submitted. The total Medicare reimbursement on these claims was $81.7 bil-lion, up from $76.4 billion in 2006. Based on the principal diagnosis on each Carrier claim, ICD-9 chapters accounting for the five highest Medicare reimbursements were: (1) Diseas-es of the circulatory system; (2) Neoplasms; (3) Diseases of the mus-culoskeletal system and connective tissue; (4) Symptoms, signs, and ill-defined conditions; and (5) Diseases of the nervous system and sense organs. These rankings did not change over the 4-year study period, as illustrated in Figure 3. Total Medicare re-imbursements per claim are presented in Figure 4. Of note, the ICD-9 chapters accounting for the highest Medicare re-imbursements per claim did not overlap with those with the highest total reimbursements overall, except for Neoplasms
and Diseases of the nervous system and sense organs. For each of the 18 ICD-9 chapters (plus E-codes), Table 2 lists the 3-digit ICD-9 categories representing the highest total Medicare
reimbursement among noninstitutional outpatient (Carrier) claims.
Figure 1:
Percentage of total Medicare inpatient reimbursement for the five highest cost ICD-9 chapters among inpatient claims40 30 20 10 0 % 2006 2007 2008 2009 Circulatory diseases Respiratory diseases Injury and poisoning Digestive diseases Musculoskeletal diseases
$ billion
118.1 118.2 122.4 126.7
Figure 2:
Total Medicare reimbursement per inpatient claim for the five highest cost per inpatient claim ICD-9 chapters20 15 10 0 $ thousand 2006 2007 2008 2009 Congenital anomalies V-codes*
Infectious and parasitic diseases Neoplasms
Injury and poisoning
Figure 3:
Percentage of total Medicare noninstitutional outpatient (Carrier) reimbursement for the five highest cost ICD-9 chapters among Carrier claims20 16 12 8 4 0 % 2006 2007 2008 2009 Circulatory diseases Neoplasms Musculoskeletal diseases
Symptoms, signs, & ill-defined conditions Nervous system diseases
$ billion
76.4 76.9 78.8 81.7
Figure 4:
Total Medicare reimbursement per noninstitutional outpatient (Carrier) claim for the five highest cost per Carrier claim ICD-9 chapters 0.25 0.20 0.15 0.10 0 $ thousand Neoplasms Nervous system diseasesComplications of pregnancy, childbirth, and puerperium E-codes*
Digestive system diseases
Table 1.
Three-digit ICD-9 categories with the highest total Medicare reimbursement within each ICD-9 chapter, inpatient claims, 2009
3
ICD-9
chapter Description 3-digit ICD-9 category with highest within-chapter total reimbursement beneficiariesNumber of of claimsNumber
Total Medicare reimbursement
($ million)
001-139 Infectious and parasitic diseases septicemia (038) 461,679 526,920 7,575.1
140-239 Neoplasms malignant neoplasm of trachea,
bronchus, and lung (162) 78,097 86,029 1,022.3
240-279 Endocrine, nutritional, and metabolic diseases, and immunity disorders
diabetes mellitus (250) 178,487 222,905 1,733.5
280-289 Diseases of the blood
and blood-forming organs other and unspecified anemias (285) 72,843 79,554 403.9
290-319 Mental disorders episodic mood disorders (296) 166,830 238,713 1,552.5
320-389 Diseases of the nervous system
and sense organs other cerebral degenerations (331) 70,626 81,089 678.6
390-459 Diseases of the circulatory system heart failure (428) 542,262 716,324 5,381.0
460-519 Diseases of the respiratory system other diseases of lung (518) 217,125 260,166 4,763.3
520-579 Diseases of the digestive system intestinal obstruction
without mention of hernia (560) 162,311 186,945 1,541.9
580-629 Diseases of the genitourinary system acute renal failure (584) 237,603 258,300 1,872.2
630-677 Complications of pregnancy,
childbirth, and the puerperium other current conditions in the mother classifiable elsewhere (648) 3,770 4,973 20.7 680-709 Diseases of the skin
and subcutaneous tissue other cellulitis and abscess (682) 192,580 215,351 1,178.6
710-739 Diseases of the musculoskeletal
system and connective tissue osteoarthrosis and allied disorders (715) 478,828 503,953 4,788.3
740-759 Congenital anomalies other congenital musculoskeletal
anomalies (756) 5,756 5,793 102.1
760-779 Certain conditions originating
in the perinatal period other and ill-defined conditions originating in the perinatal period (779) * * * 780-799 Symptoms, signs,
and ill-defined conditions general symptoms (780) 290,343 304,094 1,191.3
800-999 Injury and poisoning complications peculiar to a
certain specified procedure (996) 269,240 327,166 4,274.9
V01-V86 Supplementary classification of factors influencing health status and contact with health services
care involving use of
rehabilitation procedures (V57) 356,809 393,265 5,698.9
Data Points • #5 • Prevalence and Medicare reimbursement by recurrent ICD-9 categories, 2006-2009
Table 2:
Three-digit ICD-9 categories with the highest total Medicare reimbursement within each ICD-9 chapter, noninstitutional
outpatient (Carrier) claims, 2009
ICD-9
chapter Description 3-digit ICD-9 category with highest within-chapter total reimbursement beneficiariesNumber of of claimsNumber
Total Medicare reimbursement
($ million)
001-139 Infectious and parasitic diseases dermatophytosis (110) 2,967,294 7,556,081 299.3
140-239 Neoplasms malignant neoplasm of
female breast (174) 738,293 5,501,110 1,330.3
240-279 Endocrine, nutritional, and metabolic diseases, and immunity disorders
diabetes mellitus (250) 7,300,708 32,213,992 1,927.3
280-289 Diseases of the blood and
blood-forming organs other and unspecified anemias (285) 2,790,457 9,816,430 920.0
290-319 Mental disorders episodic mood disorders (296) 1,472,793 9,366,336 512.5
320-389 Diseases of the nervous system
and sense organs cataract (366) 5,969,684 14,752,057 2,783.5
390-459 Diseases of the circulatory system essential hypertension (401) 13,758,863 38,385,790 2,129.2
460-519 Diseases of the respiratory system other diseases of lung (518) 2,636,031 8,364,954 929.4
520-579 Diseases of the digestive system gastrointestinal hemorrhage (578) 905,366 2,625,464 349.4
580-629 Diseases of the genitourinary system chronic kidney disease (585) 1,637,128 13,765,987 1,805.9 630-677 Complications of pregnancy,
childbirth, and the puerperium normal delivery (650) 6,468 9,431 4.9
680-709 Diseases of the skin and
subcutaneous tissue other dermatoses (702) 3,410,322 5,657,197 542.6
710-739 Diseases of the musculoskeletal
system and connective tissue other and unspecified disorders of back (724) 4,469,019 17,807,518 1,827.4 740-759 Congenital anomalies other congenital musculoskeletal
anomalies (756) 99,642 186,465 27.6
760-779 Certain conditions originating
in the perinatal period other respiratory conditions of fetus and newborn (770) 4,070 5,750 0.5 780-799
Symptoms, signs, and ill-defined conditions symptoms involving respiratory system and other chest symptoms (786) 9,836,544 32,389,712 2,974.6 800-999 Injury and poisoning complications peculiar to a certain
specified procedure (996) 736,640 2,366,216 578.9
V01-V86 Supplementary classification of factors influencing health status and contact with health services
encounter for other and unspecified
procedures and aftercare (V58) 4,349,740 16,868,402 796.1
E800-E999 Supplementary classification of external causes of injury and poisoning
5
Skilled Nursing Facility Claims
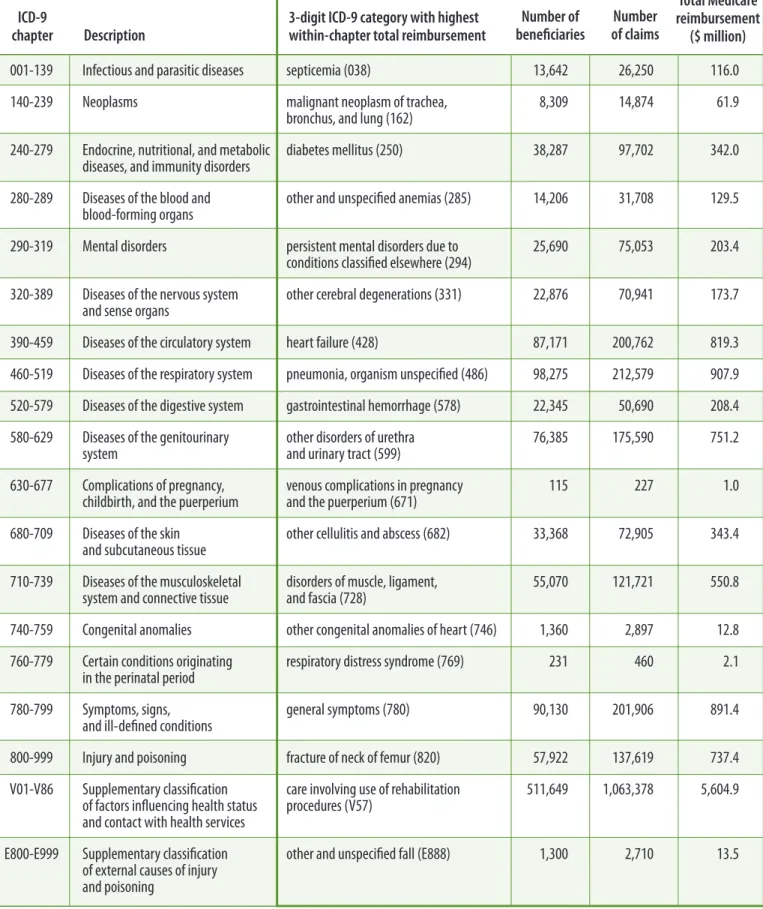
In 2009, more than 5.6 million skilled nursing facility claims were submitted. The total Medicare reimbursement on these claims was $25.5 billion, up from $20.5 billion in 2006. Based on the principal diagnosis on each skilled nursing facility claim, ICD-9 chapters accounting for the five highest Medicare reimbursements were: (1) Supplementary classification of factors influencing health status and contact with health services (i.e., V-codes); (2) Diseases of the circulatory system; (3) Injury and poisoning; (4) Diseases of the respiratory system; and (5) Symptoms, signs, and ill-defined conditions. These rankings did not change over the 4-year study period, as illustrated in Figure 5. Total Medicare reimbursements per claim are presented in Figure 6. Of note, the ICD-9 chapters accounting for the highest Medicare reimbursements per claim did not overlap with those with the highest total reimbursements overall, except for Supplementary classification of factors influencing health status and contact with health services and Injury and poisoning.
For each of the 18 ICD-9 chapters (plus E-codes), Table 3 lists the 3-digit ICD-9 categories representing the highest total Medicare reimbursement among skilled nursing facility claims.
Similar data for institutional outpatient (i.e., non-Carrier), home health, hospice, and durable medical equipment claims are available online at www.effectivehealthcare. ahrq.gov/index.cfm/search-for-guides-reviews-and-reports/?pageaction=displayproduct& productid=509.
Figure 5:
Percentage of total Medicare skilled nursing facility reimbursement for the five highestcost ICD-9 chapters among skilled nursing facility claims40 30 20 10 0 % 2006 2007 2008 2009 V-codes* Circulatory diseases Injury and poisoning Respiratory diseases
Symptoms, signs, and ill-defined conditions
$ billion
20.5 22.3 24.3 25.5
* Supplementary classification of factors influencing health status and contact with health services
Figure 6:
Total Medicare reimbursement per skilled nursing facility claim for the five highest cost per skilled nursing facility claim ICD-9 chaptersV-codes* Injury and poisoning Infectious and parasitic diseases E-codes**
Certain conditions of perinatal period
6 5 4 0 $ thousands 2006 2007 2008 2009
* Supplementary classification of factors influencing health status and contact with health services ** Supplementary classification of external causes of injury and poisoning
Data Points • #5 • Prevalence and Medicare reimbursement by recurrent ICD-9 categories, 2006-2009
Table 3:
Three-digit ICD-9 categories with the highest total Medicare reimbursement within each ICD-9 chapter, skilled nursing facility
claims, 2009
ICD-9
chapter Description 3-digit ICD-9 category with highest within-chapter total reimbursement beneficiariesNumber of of claimsNumber
Total Medicare reimbursement
($ million)
001-139 Infectious and parasitic diseases septicemia (038) 13,642 26,250 116.0
140-239 Neoplasms malignant neoplasm of trachea,
bronchus, and lung (162) 8,309 14,874 61.9
240-279 Endocrine, nutritional, and metabolic
diseases, and immunity disorders diabetes mellitus (250) 38,287 97,702 342.0
280-289 Diseases of the blood and
blood-forming organs other and unspecified anemias (285) 14,206 31,708 129.5
290-319 Mental disorders persistent mental disorders due to
conditions classified elsewhere (294) 25,690 75,053 203.4
320-389 Diseases of the nervous system
and sense organs other cerebral degenerations (331) 22,876 70,941 173.7
390-459 Diseases of the circulatory system heart failure (428) 87,171 200,762 819.3
460-519 Diseases of the respiratory system pneumonia, organism unspecified (486) 98,275 212,579 907.9
520-579 Diseases of the digestive system gastrointestinal hemorrhage (578) 22,345 50,690 208.4
580-629 Diseases of the genitourinary
system other disorders of urethra and urinary tract (599) 76,385 175,590 751.2
630-677 Complications of pregnancy,
childbirth, and the puerperium venous complications in pregnancy and the puerperium (671) 115 227 1.0 680-709 Diseases of the skin
and subcutaneous tissue other cellulitis and abscess (682) 33,368 72,905 343.4
710-739 Diseases of the musculoskeletal
system and connective tissue disorders of muscle, ligament, and fascia (728) 55,070 121,721 550.8
740-759 Congenital anomalies other congenital anomalies of heart (746) 1,360 2,897 12.8
760-779 Certain conditions originating
in the perinatal period respiratory distress syndrome (769) 231 460 2.1
780-799 Symptoms, signs,
and ill-defined conditions general symptoms (780) 90,130 201,906 891.4
800-999 Injury and poisoning fracture of neck of femur (820) 57,922 137,619 737.4
V01-V86 Supplementary classification of factors influencing health status and contact with health services
care involving use of rehabilitation
procedures (V57) 511,649 1,063,378 5,604.9
E800-E999 Supplementary classification of external causes of injury and poisoning
7
Geographic Trends in the Reimbursement
per Claim for Select Medical Conditions
As described in the Generation of Maps section (p. 9), we examined trends in the reimbursement per claim for high-prevalence, high-cost conditions that overlapped with Medicare Modernization Act priority conditions, by hospital referral regions (HRRs). These included: cardiac dysrhythmias (ICD-9 427; Figure 7) and other disorders of urethra and urinary tract (ICD-9 599; Figure 8) in the inpatient setting; osteoarthrosis and allied disorders (ICD-9 715; Figure 9) in the noninstitutional outpatient setting; and pneumonia, organism unspecified (ICD-9 486; Figure 10) and care involving use of rehabilitation procedures
(ICD-9 V57; Figure 11) in the skilled nursing facility setting.
Figure 7:
Average Medicare reimbursement ($ thousand) per claim for cardiac dysrhythmias as a principal diagnosis on inpatient claims, by hospital referral region2006
2009
2.4 – 5.9 5.9 – 6.7 6.7 – 7.5 7.5 –13.9 White corresponds to areas that lack an HRRFigure 8
:
Average Medicare reimbursement ($ thousand) per claim for other disorders of urethra and urinary tract as a principal diagnosis on inpatient claims, by hospital referral region2006
2009
1.8 – 3.9 3.9 – 4.3 4.3 – 4.8 4.8 – 8.7 White corresponds to areas that lack an HRRFigure 9:
Average Medicare reimbursement ($ thousand) per claim for osteoarthrosis and allied disorders as a principal diagnosis on noninstitutional outpatient (Carrier) claims, by hospital referral region2006
2009
0.07 – 1.03 1.03 – 1.13 1.13 – 1.24 1.24 – 1.71 White corresponds to areas that lack an HRRData Points • #5 • Prevalence and Medicare reimbursement by recurrent ICD-9 categories, 2
0
06-2009
Figure 10:
Average Medicare reimbursement ($ thousand) per claim for pneumonia (organism unspecified) as a principal diagnosis on skilled nursing facility claims, by hospital referral region2006
2009
Small cell 1.2 – 3.3 3.3 – 3.9 3.9 – 4.4 4.4 – 7.5 White corresponds to areas that lack an HRRFigure 11:
Average Medicare reimbursement ($ thousand) per claim for care involving use of rehabilitation procedures as a principal diagnosis on skilled nursing facility claims, by hospital referral region2006
2009
Small cell 1.4 – 3.8 3.8 – 4.4 4.4 – 5.1 5.1 – 9.3 White corresponds toDATA SOURCE
The Department of Health and Human Services’ Medicare data were used for this brief. Specifically, a version of the Common Working File (CWF) current through April 30, 2010, was used to identify 2006-2009 claims billed under Medicare Parts A and B. Medicare Part C claims were not considered. The use of these data was covered under a project-specific data use agreement with the Centers for Medicare & Medicaid Services.
STUDY PERIOD
The study period over which disease burden and costs were examined was 2006-2009.
DEFINITIONS AND METHODS
Determination of Counts of Beneficiaries
and Claims
For each study year, claims were extracted from the CWF. The principal (i.e., first-listed) diagnosis on each claim was identified and placed into each of four diagnostic groupings of increasing granularity: (1) ICD-9 chapter (e.g., 390 -459 = Diseases of the circulatory system); (2) ICD-9 subchapter (e.g., 420-429 = other forms of heart disease); (3) 3-digit ICD-9 category (e.g., 427 = cardiac dysrhythmias); and (4)
5-digit ICD-9 code (e.g., 427.41 = ventricular fibrillation). More information on ICD-9 conventions and diagnoses can be found at www.cdc.gov/nchs/data/icd9/icdguide10.pdf. Claims with nonnumeral diagnoses (except characters E and V, indicative of Supplementary classification codes) were labeled as invalid and reported as such.
Claims were further stratified by the setting from which they arose. Institutional claims included the following claim types: inpatient; home health; hospice; outpatient (i.e., non-Carrier); and skilled nursing facility. Noninstitutional claims included Carrier and durable medical equipment transactions.
Numbers of claims and beneficiaries were summed across diagnostic groups.
Determination of Cost
For the Medicare Parts A and B claims identified above, to-tal Medicare reimbursement was calculated using the claim payment amount variable. Payments were summed across diagnostic groups.
Determination of Hospital Referral Regions
For institutional claims, the provider identification number on each claim was identified and mapped to ZIP Code based on the Provider of Services (POS) file. The POS file, an extract of the Online Survey and Certification Reporting System database, provides identification number, name, and address
9
information for participating institutional providers. ForCar-rier claims, the performing provider ZIP Code was extracted directly from the line item with the highest line payment. For durable medical equipment claims, the ordering physi-cian identification number on each claim was identified and mapped to ZIPCode using National Provider Identifier files. For 2006 claims, ZIP Codes were then mapped to Dartmouth Atlas of Health Care HRRs using the 2006 hospital service area-HRR crosswalk file. For 2007-2009 claims, ZIP Codes were then mapped to Dartmouth Atlas of Health Care HRRs using the 2007 hospital service area-HRR crosswalk file (the most recent available). Crosswalk files were downloaded from www.dartmouthatlas.org/downloads.aspx.
Generation of Maps
Maps were generated using Dartmouth Atlas of Health Care HRRs (www.dartmouthatlas.org). Reimbursement amounts were grouped into quartiles and mapped accordingly. Regions with fewer than 11 beneficiaries contributing to the proportio presented were mapped in a striped pattern. Geographic regio that did not correspond to an HRR were mapped in white. Conditions were selected for presentation as maps based on th following methodology. Using the 3-digit ICD-9 categories, conditions were rankordered separately by: (1) number of beneficiaries, (2) number of claims, and (3) total Medicare rei bursement. The intersection of the 10 highest ranked condi-tions across these three groups was then identified for inpatie outpatient, and skilled nursing facility claims. From this listin of high-prevalence high-cost conditions, the funding agency selected conditions of interest, in alignment with Medicare Modernization Act priority conditions.
ns ns e m-nt, g
ADDITIONAL FINDINGS AVAILABLE ONLINE
TABLES
B
eneficiar
y and Claim Counts,
by File Type and
Catego
ry
of Primar
y
D
iagnosis Code
: Summary
Statistics
The following five tables are available for each of the following file types: inpatient, outpatient, skilled nursing facility, home health, hospice, durable medical equip-ment, and Carrier.
Number of Beneficiaries, Number of Claims, and
Total Medicare Reimbursement in File Type by
5-
D
igit ICD
-
9 Code of Principal D
i
agnosis,
2006-2009
Number of Beneficiaries, Number of Claims, and
Total Medicare Reimbursement in File Type by
3-
D
igit ICD
-
9 Categor
y
of Principal D
i
agnosis,
2006-2009
Number of Beneficiaries, Number of Claims, and
Total Medicare Reimbursement in File Type by
ICD-9 Subchapter of Principal Diagnosis,
2006-2009
Number of Beneficiaries, Number of Claims, and
Total Medicare Reimbursement in File Type by
ICD-9 Chapter of Principal Diagnosis,
2006-2009
Number of Beneficiaries, Number of Claims, and
Total Medicare Reimbursement in File Type by
Provider Hospital Referral Region and ICD-9
Chapter of Principal Diagnosis, 2006 - 2009
MAPS
Average Medicare Reimbursement per
Average Medicare Reimbursement
Claim for Cardiac Dysrhythmias as a
per Claim for Osteoarthrosis and
Principal Diagnosis on All Claims, by
Allied Disorders as a Principal
Diagno-Hospital Referral Region, 2006-2009
sis on All Claims, by Hospital Referral
Region, 2006-2009
Average Medicare Reimbursement per
Claim for Cardiac Dysrhythmias as a
Average Medicare Reimbursement per
Principal Diagnosis on Inpatient Claims, Claim for Osteoarthrosis and Allied
by Hospital Referral Region, 2006-2009
Disorders as a Principal Diagnosis on
Carrier Claims, by Hospital Referral
Average Medicare Reimbursement per
Region, 2006-2009
Claim for Pneumonia (Organism
Unspec-ified) as a Principal Diagnosis on All
Average Medicare Reimbursement
Claims, by Hospital Referral Region,
per Claim for Care Involving Use of
2006-2009
Rehabilitation Procedures as a
Princi-pal Diagnosis on All Claims, by
Hospi-Average Medicare Reimbursement per
tal Referral Region, 2006-2009
Claim for Pneumonia (Organism
Unspec-ified) as a Principal Diagnosis on Skilled Average Medicare Reimbursement
Nursing Facility Claims, by Hospital
per Claim for Care Involving Use of
Referral Region, 2006-2009
Rehabilitation Procedures as a
Princi-pal Diagnosis on Skilled Nursing
Facili-Average Medicare Reimbursement per
ty Claims, by Hospital Referral Region,
Claim for Other Disorders of Urethra and 2006-2009
Urinary Tract as a Principal Diagnosis on
All Claims, by Hospital Referral Region,
2006-2009
Direct your Web browser to:
Average Medicare Reimbursement per
www.effectivehealthcare.ahrq.Claim for Other Disorders of Urethra and
gov/index.cfm/search-for-guides-Urinary Tract as a Principal Diagnosis on
reviews-and-reports/?pageaction=Inpatient Claims, by Hospital Referral
displayproduct&productid=509.Region, 2006-2009
.Data Points • #5 • Prevalence and Medicare reimbursement by recurrent ICD-9 categories, 2006-2009
REFERENCES
1. Reinhardt UE, Hussey PS, Anderson GF. U.S. health care spending in an international context. Health Aff (Millwood) 2004;23(3):10-25.
2. Thorpe KE, Ogden LL, Galactionova K. Chronic conditions account for rise in Medicare spending from 1987 to 2006. Health Aff (Millwood) 2010;29(4):718-24.
3. Munoz E, Munoz W 3rd, Wise L. National and surgical health care expenditures, 2005-2025. Ann Surg 2010; 251(2):195-200.
4. Martin BI, Turner JA, Mir za SK, et al. Trends in health
care expenditures, utilization, and health status among
U.S. adults with spine problems.Spine 2009;34(19):
2077-84.
5. Cryer BL, Wicox CM, Henk HJ, et al. The economics of
upper gastrointestinal bleeding in a U.S. managed-care
setting: a retrospective, claims-based analysis. J Med Econ
2010;13(1):70-77.
6. Yu W, Ravelo A, Wagner TH, et al. The relationshipsamong
age, chronic conditions, and healthcare costs. Am J Manag
Care 2004;10(12):909-16.
7. Thorpe KE, Howard DH. The rise in spending among Medicare beneficiaries: the role of chronic disease prevalence and changes in treatment intensity. Health Aff (Millwood)
2006;25(5):w378-88.
8. Hodgson TA, Cai L. Medical care expenditures for hyperten-sion, its complications, and its comorbidities. Med Care 2001;39(6):599-615.
9. Bogner HR, Miller SD, de Vries HF, et al. Assessment of
cost and health resource utilization for elderly patients with
heart failure and diabetes mellitus.J Card Fail2010;16(6):
454-60.
10. Davanzo JE, El-Gamil AM, Dobson A, et al. A retrospective comparison of clinical outcomes and Medicare expenditures in skilled nursing facility residents with chronic wounds. Ostomy Wound Manage 2010;56(9):44-54.
AUTHORS
Charles E. Leonard, Pharm.D.1,2 Cristin P. Freeman, M.P.H. 1,2 Thomas MaCurdy, Ph.D. 3
Craig A. Umscheid, M.D., M.S.C.E. 1,2,4 Karla López de Nava, Ph.D.3
Teresa Molina, B.A. 3 Sean MaCurdy, B.A. 3
Christina D. Kang-Yi, Ph.D.1,5 Hanieh Razzaghi, M.P.H. 1,2 David Hsia, J.D., M.D., M.P.H.6
1 University of Pennsylvania Developing Evidence to Inform Decisions about Effectiveness (DEcIDE) Center, University of Pennsylvania School of Medicine, Philadelphia, PA
2 Center for Clinical Epidemiology and Biostatistics, University of Pennsylvania School of Medicine, Philadelphia, PA
3 Acumen LLC DEcIDE Center, Burlingame, CA 4 Center for Evidence-Based Practice, University of
Pennsylvania Health System, Philadelphia, PA
5 Center for Mental Health Policy and Services Research, Department of Psychiatry, University of Pennsylvania School of Medicine, Philadelphia, PA
6 Agency for Healthcare Research and Quality, Rockville, MD
This project was funded under Contract No. HHSA29020050041I from the Agency for Healthcare Research and Quality, U.S. Deprtment of Health and Human Services, as part of the D evelop-ing Evidence to Inform Decisions about Effectiveness (DEcIDE) program. The authors of this report are responsible for its content. Statements in the report should not be construed as endorsement by the Agency for Healthcare Research and Quality or the U.S. Department of Health and Human Services.
Acknowledgments: The authors wish to thank Dr. Sean Hennessy for his guidance and Medicare claims expertise, Ms. Mary A. Leonard, Ms. Anne L. Pugh, and Ms. Doreen Bonnett for their graphic design expertise, and Mr. Edmund Weisberg for his medical editing expertise. Futhermore, the work presented herein was based on the authors’ interests in prior publications by Dr. Thomas A. Hodgson, such as Prev Med 1999;29:173-86 andMed Care 1999; 37(10):944-1012.
Suggested Citation: Leonard CE, Freeman CP, MaCurdy T, et al. Prevalence and Medicare reimbursement by recurrent International Classification of Diseases categories, 2006-2009. Utilization and Costs. Data Points #5 (prepared by the University of Pennsylvania DEcIDE Center under contract no. HHSA29020050041I). Rockville, MD: Agency for Healthcare Research and Quality. 2011. AHRQ Publication No. 11-EHC036.