University of South Carolina
Scholar Commons
Theses and Dissertations
2017
The Impact of Autoimmune Disease on Breast
Cancer Survival
Samantha Truman University of South Carolina
Follow this and additional works at:https://scholarcommons.sc.edu/etd Part of theEpidemiology Commons
This Open Access Thesis is brought to you by Scholar Commons. It has been accepted for inclusion in Theses and Dissertations by an authorized administrator of Scholar Commons. For more information, please [email protected].
Recommended Citation
Truman, S.(2017).The Impact of Autoimmune Disease on Breast Cancer Survival.(Master's thesis). Retrieved from
T
HE IMPACT OF AUTOIMMUNE DISEASE ON BREAST CANCER SURVIVAL bySamantha Truman
Bachelor of Science
University of South Carolina, 2014
Submitted in Partial Fulfillment of the Requirements
For the Degree of Master of Science in
Epidemiology
The Norman J. Arnold School of Public Health
University of South Carolina
2017
Accepted by:
Swann Adams, Director of Thesis
Jan Eberth, Reader
Andrew Ortaglia, Reader
ii
iii
Abstract
Background
Breast cancer is the second leading cause of cancer death for women in developed
countries, while autoimmune disease effects approximately 10 million people in the
United States, of which approximately 80% are female. Both diseases are associated
with hormonal risk factors and are related to the divergent effects of the cellular and
humoral immunity that is associated with the T-helper 1 and T-helper 2 immune
response. To investigate the potential implications that autoimmune disease may have
on breast cancer-specific mortality, we have conducted a population-based
retrospective cohort study of women who were diagnosed with breast cancer between
January 1, 1996 to December 31, 2010 in South Carolina.
Methods
This study included 3,286 female breast cancer patients. The participants were
identified through administrative claims databases, the South Carolina Medicaid
Program and the South Carolina State Employee Health Plan, and were linked by a
unique identifier to the South Carolina Central Cancer Registry. The autoimmune
disease (AD) cohort was identified as those that had at least one AD present (n = 629),
while those without an AD diagnosis were placed into a second cohort (n = 2,657). A
iv
AD and a T-helper 2 (Th2) dominant AD; these two groups were then compared to those
without an AD present. Kaplan Meier and Cox regression was used to test for
associations between AD and breast cancer-specific survival.
Results
Breast cancer-specific survival was not significantly different between the AD and no AD
cohorts. However, the crude analysis showed a significant reduction in breast cancer
mortality (54%) for those with a Th1 dominant AD compared to those without an AD.
When controlling for chemotherapy and radiation therapy, the relationship remained
significant with a 55% reduction in breast cancer mortality among those with a Th1
dominant AD compared to those without an AD (HR: 0.45, 95% CI: 0.23, 0.87).
Conclusion
Among women who are diagnosed with breast cancer, the presence of a Th1 dominant
v
Table of Contents
Abstract ... iii
List of Tables ... vii
List of Figures ... viii
List of Abbreviations ... ix
Chapter 1: Introduction and Thesis Overview ... 1
1.1 Introduction ... 1
1.2 Significance of Research ... 2
1.3 Thesis Overview ... 3
Chapter 2: Review of the Literature ... 4
2.1 Autoimmune Disease and the Immune System ... 4
2.2 Breast Cancer and the Immune System ... 6
2.3 Breast Cancer and Autoimmune Disease ... 7
2.4 Introduction ... 14
Chapter 3: Methods ... 15
3.1 Purpose and Objectives ... 15
3.2 Hypothesis ... 15
3.3 Study Design ... 16
3.4 Measurements ... 17
3.5 Statistical Analyses ... 19
Chapter 4: Results ... 22
vi
4.2 Secondary outcome ... 31
Chapter 5: Discussion ... 37
vii
List of Tables
Table 2.1: Gender prevalence ratio for various autoimmune diseases………5
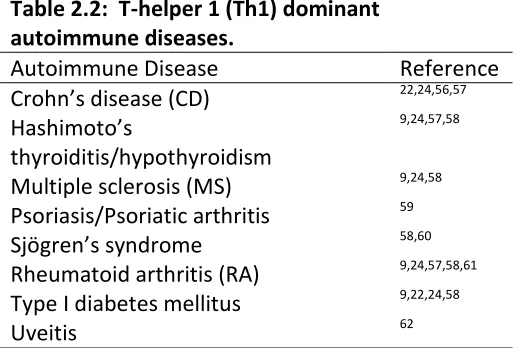
Table 2.2: T-helper 1 (Th1) dominant autoimmune diseases……..……….8
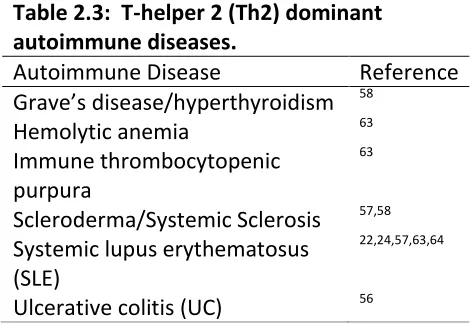
Table 2.3: T-helper 2 (Th2) dominant autoimmune diseases……….10
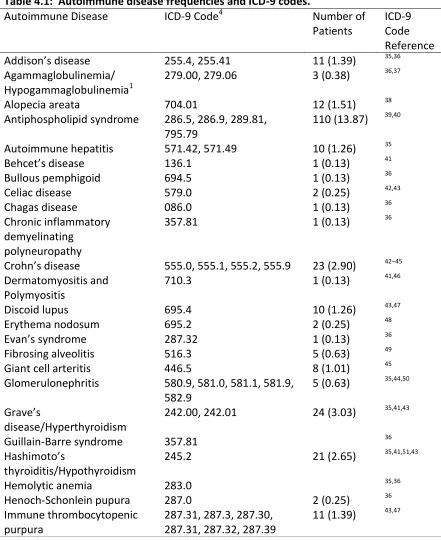
Table 4.1: Autoimmune disease frequencies and ICD-9 codes………..24
Table 4.2: Baseline patient, tumor, and treatment characteristics of breast cancer patients with and without an AD………26
Table 4.3: Cause of death among those with and without an AD………27
Table 4.4: Three, five, and ten-year survival comparison among those with and without an AD………..29
Table 4.5: Cox model for breast cancer specific mortality among those with and without an AD………30
Table 4.6: Bivariate Cox model for breast cancer specific mortality among those with and without an AD……….………30
Table 4.7: Cause of death among those with a Th1 dominant and Th2 dominant AD and those without an AD……….33
Table 4.8: Three, five, and ten-year survival comparison among those with a Th1 dominant and Th2 dominant AD and those without an AD………..34
Table 4.9: Cox model breast cancer specific mortality among those with a Th1 dominant and Th2 dominant AD and those without an AD………..35
viii
List of Figures
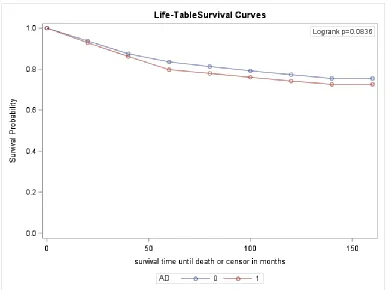
Figure 4.1: Breast cancer specific survival for those diagnosed with at least one AD (indicated by the red line) and those without an AD (indicated by the blue line)…………28
Figure 4.2: All cause survival for those with at least one AD (indicated by the red line) and those without an AD (indicated by the blue line)……….29
Figure 4.3: Breast cancer specific survival for those diagnosed with Th1 dominant AD (indicated by the red line), Th2 dominant AD (indicated by the green line), and no AD (indicated by the blue line)………33
ix
List of Abbreviations
AD………...Autoimmune disease
CD………Crohn’s disease
CI……….Confidence Interval
ER……….Estrogen
ICD-9………International Classification of Disease, Ninth Revision
IL………..Interleukin
MS………..Multiple sclerosis
NK………..Natural killer
PR……….Progesterone
RA………Rheumatoid arthritis
SCCR……….South Carolina Central Cancer Registry
SIR……….Standardized incidence ratio
SLE………Systemic lupus erythematosus
Th1………..………T-helper 1
Th2………T-helper 2
1
Chapter 1
Introduction and Thesis Overview
1.1 Introduction
Breast cancer is the most common cancer among women in developed countries
1
. In 2017, an estimated 252,710 women in the United States will be diagnosed with
invasive breast carcinoma, accounting for 30% of all female cancer cases 2. While
survival rates for breast cancer have improved significantly over time, breast remains
the second leading cause of cancer mortality among American women. The American
Cancer Society estimates that 282,500 women will die of cancer in 2017 with 40,610 of
these deaths being attributed to breast cancer 2. There are several known risk factors
for breast cancer, however these only account for approximately 45% to 55% of the
cases that occur 3.
Epidemiological studies have indicated that the overall risk for developing breast
carcinoma may be partially attributed to the immune status of the individual 4. The
immune system consists of both the innate and adaptive immune response, which work
together to protect the body against disease5. An autoimmune disease (AD) occurs
when the adaptive immune system fails to recognize the difference between what is
foreign and what is self, resulting in an attack of healthy tissues5. There are between 70
to 100 identified autoimmune diseases. It is estimated that approximately 10 million
2
There have been several hypotheses to why women are more likely to be affected by AD
than men. One proposed theory is the difference and fluctuations of sex hormones, as
several studies have presented an association between remission and flares that occur
with AD and the hormonal fluctuations that occur in women, such as during pregnancy
and the menstrual cycle 7.
Numerous studies have presented the associations between autoimmune
disease and breast cancer risk, with conflicting results; however, little data exists
regarding the association of AD with breast cancer survival. This is an important gap in
the literature, given the potential hormonal implications that both these diseases share
in common.
1.2 Significance of Research
The primary objective of this study was to investigate the association of AD with
breast cancer specific survival among a cohort of female breast cancer patients in South
Carolina. This research will provide insight into the relationship between AD prevalence
and breast cancer survival. There have been many studies conducted looking at
individual ADs in their relationship to breast cancer risk, however, few have looked at
survival, and to date no population-based studies have analyzed the potential
association that the T-helper 1 (Th1) and T-helper 2 (Th2) dominant ADs have on breast
3
Association states that only 24 ADs contain reputable epidemiological studies8. In
conducting an analysis on all potential ADs and those with Th1 and Th2 dominance, this
will help to fill a major gap that currently exists in the literature.
1.3 Thesis Overview
This thesis is comprised of five chapters. The first chapter provides a brief
overview of the issues around AD and breast cancer, the primary purpose and objectives
of this research, and a thesis overview. The second chapter includes a background of
the current literature for both AD and breast cancer, discussing the studies that have
been conducted to analyze the association between AD and cancer, with a specific focus
on those studies that relate to breast cancer. This background information will provide
information on the most relevant literature to help the reader in being able to critically
evaluate the results and implications of this study. The third chapter provides
information regarding the study design, methodological details, and the statistical
methods that were used. The fourth chapter provides the results of the survival and
multivariable analyses. The final chapter will include the discussion, highlighting the
limitations of the study and providing an overall conclusion with suggestions regarding
4
Chapter 2
Review of the Literature
2.1 Autoimmune Disease and the Immune System
The immune system is regulated by antigen presenting cells which are comprised
of the innate and adaptive immunity9. The innate immune response, consists of
phagocytes, which include your macrophages, granulocytes, dendritic cells, and natural
killer cells4. The innate immune response communicates and activates the adaptive
immune response in order to eliminate pathogens5. There are two types of adaptive
immune responses, the humoral immunity, comprised the B lymphocytes, and the
cellular immunity, made up of T lymphocytes. The B lymphocytes are programmed to
create specific antibodies to target pathogens, while the T cells contribute to the
immune defense by directing and regulating the immune response through the helper T
cells, T-helper 1 (Th1) and T-helper 2 (Th2) cells10. Autoimmune diseases occur when
the B cells develop antibodies to the organs and/or tissues and therefore misidentify
normal body tissues as invaders10.
The Th1 cytokines secrete IFN-ꭚ, IL-2, and TNF-α to promote cellular immunity,
while the Th2 cytokines secrete IL-4 and IL-10 to promote humoral immunity4,9. Studies
have shown that females tend to have stronger cellular and humoral immune response
5
causing females to be more susceptible to developing an AD8,11. Collectively AD effects
three times more women than men8. Approximately 80% of patients are women for
Sjögren’s syndrome, Systemic lupus erythematosus, Primary biliary cirrhosis,
Autoimmune thyroid disease, and Scleroderma, while 60% to 75% of patients are
women for multiple sclerosis, myasthenia gravis, and rheumatoid arthritis 6.
Table 2.1: Gender prevalence ratio for various autoimmune diseases.
Autoimmune Disease Ratio (female/male) Reference
Addison’s Disease 12.3:1 11
Antiphospholipid syndrome 9:1 7,11,12
Autoimmune hepatitis 7.5 – 8:1 7,11–13
Celiac disease 1.8 – 3.3:1 11,14
Crohn’s disease 0.45 – 3:1 11
Dermatomyositis 2:1 11,13
Grave’s disease 2.7 – 4:1 11–13,15
Hashimoto’s thyroiditis/hypothyroidism 5.2 – 50:1 7,11–13,15,16
Mixed connective tissue disease 8:1 11,12
Multiple Sclerosis 2 – 3:1 7,11,12
Myasthenia gravis 1.6 – 3:1 6,7,11,12
Primary biliary cirrhosis 9:1 8
Rheumatoid arthritis 2.7 – 4:1 7,11–13,15,16
Scleroderma 3 – 11.8:1 7,11–13,15
Sjögren’s syndrome 9 – 20:1 7,11–13,15
Systemic lupus erythematosus 7.4 – 9:1 6,7,11–13,15,16
Thrombocytopenic purpura 2:1 8
6
2.2 Breast Cancer and the Immune System
Breast cancer is the result of malignant tumors developing in the breast 17.
Breast cancer is the most common cancer among women, with a lifetime risk of 12%
and a 5% risk of mortality18. Studies have shown that fluctuations in the immune
system may be associated with an increased risk of breast cancer. Women with
estrogen receptor positive breast cancer typically have a better prognosis than those
with estrogen receptor negative breast cancer, with a 10% difference in 5-year
survival19. A study conducted on over 12,000 breast cancer patients in the United
Kingdom and Canada found that among the women that had estrogen receptor negative
tumors, the presence of CD8+ T cells within the tumor was associated with a significant
reduction in breast cancer specific mortality reporting a hazard of 28% (95% CI: 16% -
38%)20. Additionally, studies have found that when T lymphocytes were present in
malignant tumors the tumors were more likely to have negative auxiliary lymph nodes,
have a smaller tumor diameter, a lower histological grade, and reoccurrence-free
survival4.
As mentioned previously, the T lymphocytes consists of the Th1 and Th2
cytokines. The Th1 cytokines enhance the antitumor immune response through the
secretion of IFN-ꭚ, which causes the anti-tumor directed B cell factors and the CD8+ T
cells to all work together to “favor tumor rejection”4. In contrast, the chronic activation
of the Th2 cytokines secrete pro-growth factors which will decrease the CD8+ T
lymphocytes, resulting in tumor promotion4. A study conducted by Campbell and
7
26 healthy controls, finding that the Th1 cytokines were lower in the breast patients
prior to therapy compared to healthy controls21. The CD8+ T cytokines, Th1 cytokines,
and natural killer (NK) cells are the key players in protecting the body against tumor
development and progression, while the B and Th2 cytokines that are involved in the
humoral immune response promote both tumor development and progression4.
2.3 Breast Cancer and Autoimmune Disease
The association that has been seen between the absence or decrease of T-helper
cells and the increase risk of developing breast carcinoma suggests a possible
beneficiary role that autoimmune diseases may implicate in potentially improving
cancer prognosis, as studies have shown that there is an increase in T-helper cytokines
for those with an AD. It is widely accepted now in the scientific community, that both
the Th1 and Th2 cytokines play a major role in coordinating the immune system. The
Th1/Th2 hypothesis began in the 1980s, when these two subgroups of T lymphocytes
were recognized in mouse models22. This concept was later investigated and connected
to the role that both these cytokine subgroups play in the development of disease. The
Th1 pathways is considered the more aggressive of the two, and have been shown be
the main coordinator in the attack against viruses, bacterial agents, and even cancer
cells22. This subgroup of T cells has been referred to as the “antitumor immune
response”, which occurs when Th1 cytokines secrete IFN-ꭚ, resulting in an activation of
macrophage cytotoxic activity4. However, when the Th1 cells become overactive the
resulting consequence can be the development of an organ-specific AD22. The Th2
8
Table 2.2: T-helper 1 (Th1) dominant autoimmune diseases.
Autoimmune Disease Reference
Crohn’s disease (CD) 22,24,56,57
Hashimoto’s
thyroiditis/hypothyroidism
9,24,57,58
Multiple sclerosis (MS) 9,24,58
Psoriasis/Psoriatic arthritis 59
Sjögren’s syndrome 58,60
Rheumatoid arthritis (RA) 9,24,57,58,61
Type I diabetes mellitus 9,22,24,58
Uveitis 62
cytokines, IL-4 and IL-109. This pathway is thought to be involved in downregulating the
cell-mediated anti-tumor response and enhancing the “protumor humoral response”4.
The overactivation of the Th2 cytokines has been associated with increasing the risk of
developing allergies, IgE-related diseases, as well as systemic ADs22.
2.3.1 Th1 Dominant Autoimmune Diseases and Breast Cancer
Autoimmune diseases, such as Multiple sclerosis, Rheumatoid arthritis, and Type
I diabetes mellitus, have been associated with a Th1 dominant immune response.
Several studies have looked at the association between these Th1 dominant ADs and
pregnancy, as pregnancy tends to enhance the Th2 cytokines and reduce the Th1
cytokines23. This shift from a Th1 to a Th2 immune response, often causes those with
Th1 associated AD to undergo remission during pregnancy. However, during the
postpartum period the Th1 related ADs will typically increase in severity23. The ADs, RA,
MS, Type I diabetes mellitus, and Crohn’s disease, have an excess of IL-12 and TNF-α,
both of which are associated with the Th1 immune response. Women with these ADs,
9
levels of cortisol which suppresses the pro-inflammatory cytokines, IL-12 and TNF-α,
while promoting the anti-inflammatory cytokines, IL-4 and IL-1024.
As mention previously, the Th1 immune response has been seen to be
associated with the downregulation of tumor growth24. Hemminki and colleagues
conducted a study in Sweden, analyzing the risk and survival of female cancers among
those women with an AD25. Of the 199,466 patients that were studied, 4,607 patients
developed breast cancer. The standardized incidence ratio (SIR) was calculated as the
ratio of what was observed in the Swedish Hospital Discharge Register to the ratio
expected of that in the general population. The overall risk for breast cancer was
significantly lower for those with an AD, with an SIR of 0.94 (95% CI: 0.91 to 0.97). Four
of the six Th1 dominant ADs represented in this study had a significantly lower risk of
developing breast cancer. There was a 15% reduced risk seen in Crohn’s disease
patients with an SIR of 0.85 (95% CI: 0.75 to 0.97). Hashimoto’s thyroiditis patients had
a significantly lower risk as well with an SIR of 0.78 (95% CI: 0.66 to 0.91)25. In addition,
a cohort study conducted in Ontario, Canada identified 178,186 women with breast
cancer and found that those with hypothyroidism had a significantly lower risk of dying
compared to those that did not have hypothyroidism (HR: 0.87, 95% CI: 0.77 to 0.98)1.
Hemminki and colleagues similarly found a significantly reduced risk for developing
breast cancer among women with RA (SIR: 0.84, 95% CI: 0.79 to 0.89), results which
were consistent with a study conducted through the Danish Cancer Registry25,26.
However, Ji and colleagues found that those with RA compared to those without RA had
10
Table 2.3: T-helper 2 (Th2) dominant autoimmune diseases.
Autoimmune Disease Reference
Grave’s disease/hyperthyroidism 58
Hemolytic anemia 63
Immune thrombocytopenic purpura
63
Scleroderma/Systemic Sclerosis 57,58 Systemic lupus erythematosus
(SLE)
22,24,57,63,64
Ulcerative colitis (UC) 56
specific survival and 1.55 (95% CI: 1.40 to 1.71) for overall survival27. In addition to
Crohn’s disease, Hashimoto’s thyroiditis, and RA, those patients with Sögren’s syndrome
had a significantly reduced risk as well, with an SIR of 0.46 (95% CI: 0.26 to 0.75)25.
2.3.2 Th2 Dominant Autoimmune Diseases and Breast Cancer
While, the Th1 dominant ADs that were represented in Hemminki and colleagues
study were either not significant or provided results that showed a significant reduction
in risk of developing breast cancer, two of the six Th2 dominant ADs represented in this
study had a significantly higher risk of developing AD while the other Th2 ADs that were
represented did not yield significant results. Grave’s disease had a significant SIR of 1.13
(95% CI: 1.06 to 1.21), while ulcerative colitis had a significant SIR of 1.12 (95% CI:
1.01-1.24)25. While ulcerative colitis had a significant increase in risk for developing breast
cancer, those patients with ulcerative colitis had a 25% reduced risk of dying compared
to the general population (HR: 0.75, 95% CI: 0.58 to 0.98)25. While systemic lupus
erythematosus (SLE), did not yield significant results in the previously mentioned study,
11
hormone replacement therapy and oral contraceptive history, women with lupus had a
higher risk of developing breast cancer26.
2.3.3 Breast Cancer and Autoimmune Disease Risk Factors
Autoimmune diseases are estimated to effect approximately 3% of the
population in the United States28. Prevalence rates very across the different ADs, with
the more common ADs being grave’s disease, RA, and hashimoto’s thyroiditis with
prevalence rates estimated at 500 per 100,000 people28. Risk factors vary across the
wide range of ADs, but share some similarities with that of breast cancer, such as race,
estrogen exposure, and taking certain medications such as hormone replacement
therapy.
Among African Americans, the lifetimes risk of developing breast cancer for
those 80 years of age and younger is 11%, while Caucasians have a 13% risk of
developing breast cancer.18 However, for those women younger than 45 years, African
American women tend to have higher rates of breast cancer compared to Caucasian
women, while the reverse association is true for those over the age of 6018. Within the
United States, African Americans have a higher risk for developing SLE and scleroderma
compared to Caucasians28. In addition, African Americans also tend to be diagnosed on
average 7 years younger for both previously mentioned diseases compared to
Caucasians. In contrast, the risk for type-I diabetes mellitus and MS is higher among
12
As mentioned previously those with a Th2 dominant AD were more likely to
develop breast cancer compared to those with a Th1 dominant AD. This could be
because estrogen aids in regulating the Th2 immune response, therefore an increase in
estrogen results in an increase in the Th2 response11. Lifetime exposure to estrogen is a
known risk factor for developing breast cancer. Women who began their period at age
12 compared to those at age 14, had a 20% higher risk of developing breast cancer29.
Lifetime estrogen exposure and breast cancer risk are linearly association, meaning that
the younger a woman begins her menstrual cycle and the later a woman begins
menopause the more at risk a woman is to developing breast cancer due to the lifetime
exposure of estrogen30.
It has been shown that within the first 2 to 3 years of taking combination
hormone replacement therapy, breast cancer risk increases by approximately 75% and
then goes back down 2 years after stopping the medication31. Hormone replacement
therapy not only increases the risk of developing breast cancer, but has been shown to
increase the risk of developing CD as well. A nested case-control conducted in the
United Kingdom used frequency-matched controls to determine potential risk factors
that may be associated with CD or UC. The results found that the longer-term use of
hormone replacement therapy significantly increased the risk for developing CD (OR:
2.60, 95%CI: 1.04 to 6.49)32.
2.3.4 Breast Cancer Survival Factors and Autoimmune Disease
While the breast cancer death rate among females has declined by 38% from
13
among women2. The five-year survival rate for invasive breast carcinoma is 90%, while
the ten-year survival rate decreases to 83%. Patient and tumor characteristics have all
been shown to play a major role in determining survival.
Patient characteristics that effect breast cancer survival consist of characteristics such as
age at diagnosis, time after diagnosis, socioeconomic status, and race. A retrospective
cohort study conducted on 10,356 women breast cancer patients all under the age of
50, found that compared to those in the 45 to 49-year age group those who were less
than 35 years old and those that were between 35 to 39 years of age had a significantly
higher risk of dying, with an adjusted relative risk of 1.46 (95% CI: 1.27 to 1.70) and 1.26
(95% CI: 1.12 to 1.42), respectively33. These results are consistent with other studies,
and can be attributed to the fact that younger women tend to be at higher risk for
having a higher histopathologic grade and having tumors that are both larger in size and
hormone-receptor-negative18,33. Race also plays a major factor for breast cancer
survival. A study found that ten years following treatment 58% of African Americans
survived compared to the 66% of Caucasian Americans that died, even after adjusting
for additional prognostic factors there was still a 41% difference between the two racial
groups18.
Tumor size has been noted to be one of the strongest indicators of breast cancer
survival. The cohort study mentioned previously, found that compared to those with a
tumor size of 2cm or less, those patients with a tumor size of more than 2cm had a
significant increase in risk of dying33. A case-control study assessed the association
14
hypothyroidism were significantly more likely to have a smaller tumor size compared to
those without the AD34. In addition, Cristofanilli and colleagues found that those with
hypothyroidism were significantly more likely to be diagnosed with an earlier stage of
breast cancer than those without the AD34. Stage, also known as histological grade, has
been consistently shown to be associated with long-term breast cancer survival among
those with the lowest score18.
2.4 Introduction
Many studies have analyzed the associations between individual autoimmune
diseases and breast cancer risk. However, few studies have looked at the association
between AD and breast cancer survival and even fewer studies have looked at ADs
collectively. There are also no known studies that have analyzed the potential
implications that the Th1 and Th2 dominant ADs have on breast cancer survival. This
study will provide an important gap in the literature and will include all ADs that have
been identified by the American Autoimmune Diseases Association. In addition, a sub
analysis will be included to address the potential implications that the Th1 and Th2
15
Chapter 3
Methods
3.1 Purpose and Objectives
The primary objective of this study was to investigate the association of AD presence
with breast cancer mortality in a cohort of 3,286 female breast cancer patients. To
explore the possible associations between breast cancer survival and AD, the following
specific aims were proposed:
1. Assess and compare the baseline patient, tumor, and treatment characteristics
for those with and without AD among this cohort of female breast cancer
patients.
2. Conduct multivariable analyses on the differences in breast cancer specific
survival among those with and without an AD.
3. Conduct multivariable analyses on the differences in breast cancer specific
survival among those that have a T-helper 1 dominant AD, T-helper 2 dominant
AD, and those without an AD.
3.2 Hypothesis
Women with AD will experience an increase in breast cancer survival compared
16
3.3 Study Design
3.3.1 Study Population
This retrospective cohort study includes 3,286 female breast cancer patients in
South Carolina that were diagnosed with primary breast cancer between the dates
January 1, 1996 to December 31, 2010 and are 65 years of age or younger.
3.3.2 Database
To create a cohort of diverse women, we linked individual data contained within
the South Carolina Employee Health Plan, the South Carolina Medicaid Program, South
Carolina’s National Breast and Cervical Cancer Early Detection Program (Best Chance
Network), and the South Carolina Central Cancer Registry (SCCR). This provided us with
complete data on screening, treatment, mortality, medical procedures, co-morbid
condition, prescriptions, and corresponding-dates of cancer treatment/services.
The two administrative claims databases that were used in this study were the
South Carolina Medicaid Program and the South Carolina Employee State Health Plan.
Medicaid is considered one of South Carolina’s largest insurance providers and covers
approximately one-quarter of the state’s population. The South Carolina Employee
State Health Plan covers 600 different employer groups in South Carolina, consisting of
422,000 spouses and dependents, 178,000 active employees, and 63,000 retirees. The
Best Chance Network began in 1992, and provides screening services (i.e.,
mammograms, diagnostic procedures, community education, etc.) to underserved
women that are between the ages of 47 to 64 years. All women diagnosed in this
17
cancer treatment. The SCCCR is a population-based data system collecting cancer
incidence in South Carolina, and has achieved and maintained gold certification
awarded by the NAACCR since its’ first evaluation in 1997.
3.3.3 Inclusion and Exclusion Criteria
To be included in this study, each patient had to be diagnosed with breast cancer
between the dates January 1, 1996 to December 31, 2010 and have information
regarding co-morbid conditions and vital status. This information was provided by the
SCCCR. In addition, the patient had to be either African American or European American
and could have no prior cancer diagnosis to this initial breast cancer diagnosis. Since
Medicare was not included in this analysis, all women had to be less than 65 years of
age.
3.4 Measurements
3.4.1 Exposure Variable
Autoimmune disease was defined by the American Autoimmune Disease
Association. This association provided a comprehensive list of ADs that was used to
identify any patients in the cohort that had an AD. The International Classification of
Disease, Ninth Revision (ICD-9), was used to identify the AD. The ICD-9 codes that were
used in this study were identified through previous literature and the Find-A-Code
database, an online database of medical billing codes and information, the codes that
were used can be seen in table 4.1.
In addition, there were two categories of AD, Th1 and Th2 dominant ADs. These
18
Th1 dominant ADs were defined as patients that had at least one of the following:
Crohn’s disease, Hashimoto’s thyroiditis/hypothyroidism, Multiple sclerosis,
Psoriasis/Psoriatic arthritis, Sjögren’s syndrome, Rheumatoid arthritis, Type I diabetes
mellitus, and Uveitis. The Th2 dominant ADs were defined as patients that had at least
one of the following: Grave’s disease/hypothyroidism, Hemolytic anemia, Immune
thrombocytopenic purpura, Scleroderma/Systemic Sclerosis, Systemic lupus
erythematosus, Ulcerative colitis.
3.4.2 Outcome Variable
The outcome of interest was breast cancer specific mortality, which was
ascertained from the SCCCR. Each year the records in the SCCCR are linked to the
National Death Index to capture information regarding the date and primary cause of
death. The time frame for breast cancer-specific mortality was initiated on the date of
diagnosis and ended on the date of death. All non-deceased participants were censored
December 31, 2013.
3.4.3 Patient and Clinical Variables
Variables were collected regarding the patient, tumor, and treatment
characteristics. Patient characteristics included age at diagnosis, race, insurance type,
and year of diagnosis. Age at diagnosis was analyzed as a continuous variable in this
study, and race was dichotomized as Caucasian or African American. Insurance type
was also dichotomized as type I and type II since due to payor stipulations for data use,
insurance type was encrypted in our dataset. Year of diagnosis was grouped into
19
Tumor characteristics were identified through the SCCCR database and included
histological grade, estrogen receptor status, progesterone receptor status, hormone
receptor status, stage, tumor size, and lymph node status. Both tumor size and lymph
node status were identified using the TNM classification. T describes the size of the
primary tumor, N provides information regarding the extent that the tumor has spread
to nearby lymph nodes, and M indicates if the cancer has metastasized27. For tumor
size, T was used to identify those that were less than or equal to 2cm, those tumors that
were larger than 2cm but less than 5cm, and those that were over 5cm in diameter.
Additionally, N captured the number of positive lymph nodes.
The treatment characteristics of hormone therapy, radiation therapy, and
chemotherapy were also identified by the SCCCR. These variables were dichotomized as
yes/no variables.
3.5 Statistical Analyses
Statistical analyses were run using the Statistical Analysis Software (SAS version
9.2, SAS Institute, Cary, NC). All statistical tests had an alpha level of 0.05.
3.5.1 Baseline Data
Baseline data was stratified by those patients that have at least one AD and
those that do not have an AD. Age at diagnosis was treated as a continuous variable
and analyzed though a t-test, means, standard deviations, and p-values were reported.
Patient, tumor, and treatment characteristics were categorized, as mentioned in the
20
these variables and AD status; corresponding frequencies, row percentages, and
p-values were reported.
3.5.2 Survival Analysis
The primary analysis for this study consisted of comparing breast cancer specific
survival for those with at least one AD and those without an AD, while our secondary
analysis consisted of comparing those with a Th1 or Th2 dominant AD to those that did
not have an AD diagnosis. Survival time was calculated as the date of diagnosis to the
date of death or date of censoring. Since breast cancer-specific survival was our primary
outcome of interest, death due to other causes was censored at the date of death.
Kaplan Meier, a non-parametric method, along with the Log-rank test was used to
analyze the difference between the comparison groups for both the primary and
secondary analysis. Survival probabilities and corresponding p-values were reported at
year 3, 5, and 10.
The Cox proportion hazard regression model was used to estimate the hazard
ratios (HR) and the corresponding 95% confidence intervals (CI) for breast-cancer
specific mortality. Based on previous literature the following variables were considered
for the final fully-adjusted model: race, insurance type, year of diagnosis, stage,
radiation therapy, chemotherapy, and hormone therapy. Hormone receptor status was
not considered for the model, due to the collinearity that exists between both hormone
receptor status and hormone therapy. A collinear pattern also exists for stage, grade,
and lymph node status; since there were more participants with information regarding
21
proportional hazard assumption for the covariates was assessed using Schoenfeld
residuals. Covariates were stratified in the models if they failed to meet the
proportionality assumption. Unadjusted models were analyzed along with models that
22
Chapter 4
Results
Among the 3,286 women diagnosed with breast cancer between 1996 to 2010,
there were 513 breast cancer-specific deaths and 639 total deaths were reported.
19.14% of participants had at least one AD prior to the initial breast cancer diagnosis.
The most common ADs within this study were rheumatoid arthritis, type I diabetes
mellitus, and antiphospholipid syndrome (Table 4.1).
The average age of breast cancer diagnosis for a participant with an AD was
significantly different from that of a participant without an AD, at 52 years versus 50
years, respectively. Those with an AD were more likely to have Type I insurance
compared to those participants without an AD. However, no additional differences
were observed between the two groups (Table 4.2).
4.1 Primary Outcome
No associations were observed between those with an AD and those without an
AD for both breast cancer-specific survival or all-cause survival (Figure 4.1 and 4.2). For
breast cancer-specific survival, the probability of survival was slightly lower for those
with an AD at 3, 5, and 10 years post-diagnosis (Table 4.4). For all-cause survival, those
23 an AD (0.87) 3 years post-diagnosis.
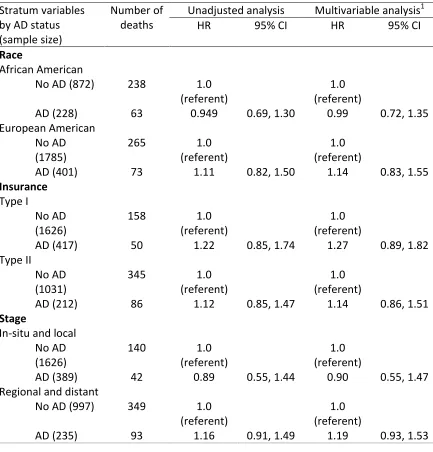
Cox models were initially run with the following covariates: race, insurance type,
stage, hormone medication, chemotherapy, and radiation. When the proportional
hazard assumption was tested with the variables mentioned previously, race, insurance
type, stage, hormone medication, and radiation therapy violated the assumption. Both
adjusted and unadjusted models were run and stratified by the variables that failed to
meet the proportional hazard assumption (Table 4.6). Models were adjusted for by
chemotherapy. Among African Americans, those with an AD had a 5% reduction in
breast cancer mortality compared to those without an AD, while the inverse occurred
for European Americans with a 11% increase in breast cancer mortality among those
with an AD. This inverse association remained when controlling for chemotherapy. An
inverse relationship occurred for stage as well. Compared to those without an AD,
those with an AD had a reduction in breast cancer mortality when they had a carcinoma
that was in-situ or local (HR: 0.89, 95% CI: 0.55, 1.44) and an increase in mortality for
those with a carcinoma that was regional or distant (HR: 1.16, 95% CI: 0.91, 1.49). There
was a 51% increase in breast cancer mortality among patients that did not receive
radiation therapy and had an AD compared to those that did not have an AD. However,
when controlling for chemotherapy there was a 17% increase in breast cancer mortality
among AD patients compared to non-AD patients. There was a 9% reduction in breast
cancer mortality among the AD patients that received radiation therapy compared to
those non-AD patients. The bivariate adjusted and unadjusted Cox models for both
24
mortality among patients with an AD. There was a 6% increase in breast cancer
mortality among patients with an AD compared to those without an AD, and a 9%
increase when controlling for chemotherapy.
Table 4.1: Autoimmune disease frequencies and ICD-9 codes.
Autoimmune Disease ICD-9 Code4 Number of
Patients
ICD-9 Code Reference
Addison’s disease 255.4, 255.41 11 (1.39) 35,36
Agammaglobulinemia/
Hypogammaglobulinemia1
279.00, 279.06 3 (0.38) 36,37
Alopecia areata 704.01 12 (1.51) 38
Antiphospholipid syndrome 286.5, 286.9, 289.81,
795.79
110 (13.87) 39,40
Autoimmune hepatitis 571.42, 571.49 10 (1.26) 35
Behcet’s disease 136.1 1 (0.13) 41
Bullous pemphigoid 694.5 1 (0.13) 36
Celiac disease 579.0 2 (0.25) 42,43
Chagas disease 086.0 1 (0.13) 36
Chronic inflammatory demyelinating
polyneuropathy
357.81 1 (0.13) 36
Crohn’s disease 555.0, 555.1, 555.2, 555.9 23 (2.90) 42–45
Dermatomyositis and Polymyositis
710.3 1 (0.13) 41,46
Discoid lupus 695.4 10 (1.26) 43,47
Erythema nodosum 695.2 2 (0.25) 48
Evan’s syndrome 287.32 1 (0.13) 36
Fibrosing alveolitis 516.3 5 (0.63) 49
Giant cell arteritis 446.5 8 (1.01) 45
Glomerulonephritis 580.9, 581.0, 581.1, 581.9,
582.9
5 (0.63) 35,44,50
Grave’s
disease/Hyperthyroidism
242.00, 242.01 24 (3.03) 35,41,43
Guillain-Barre syndrome 357.81 36
Hashimoto’s
thyroiditis/Hypothyroidism
245.2 21 (2.65) 35,41,51,43
Hemolytic anemia 283.0 35,36
Henoch-Schonlein pupura 287.0 2 (0.25) 36
Immune thrombocytopenic purpura
287.31, 287.3, 287.30, 287.31, 287.32, 287.39
25
Interstitial cystitis 595.1 20 (2.52) 36
Lichens planus 697.0 10 (1.26) 52
Lichen sclerosus 701.0 16 (2.02) 36
Meniere’s disease 386.0, 386.00, 386.01 9 (1.14) 36
Mucha-Habermann disease 696.2 1 (0.13) 36
Multiple sclerosis 340 13 (1.64) 35,43–45
Myasthenia gravis 358.00 1 (0.13) 35,41,44
Neutropenia 288.09 9 (1.14) 36
Optic neuritis 377.30 5 (0.63) 36
Palindromic rheumatism 719.33, 719.34, 719.35,
719.37
3 (0.38) 48
Pernicious anemia 281.0 36 (4.55) 35,43,47
Polyarteritis nodosa 446.0 2 (0.25) 43,47
Polymyaglia rheumatica 725 11 (1.39) 43,46,47
Primary biliary cirrhosis 571.6 1 (0.13) 35,43,47
Primary sclerosing cholangitis 576.1 1 (0.13) 36
Psoriasis/Psoriatic arthritis2 696.0, 696.1, 696.8 46 (5.82) 37,45,53
Raynaud’s phenomenon 443.0 9 (1.14) 48
Retroperitoneal fibrosis 593.4 4 (0.51) 36
Rheumatoid arthritis 714.0, 714.1, 714.2, 714.30 82 (10.37) 35,41,43,44,53,54
Rheumatic fever 390, 391.0 3 (0.38) 35,43,47
Sarcoidosis 135 24 (3.03) 43,47
Scleroderma3 710.1, 701.0 4 (0.51 35,41,46,43
Sjögren’s syndrome 710.2 12 (1.52) 35,41,43,46,52
Subacute bacterial endocarditis
421.0 1 (0.13) 36
Systemic lupus erythematosus 710.0 22 (2.78) 35,41,43,46
Type I diabetes mellitus 250.01, 250.03 126 (15.93) 35,45
Ulcerative colitis 556.0, 556.2, 556.3, 556.5,
556.6, 556.9
21 (2.65) 42–45,47
Uveitis 364.00, 364.01, 364.3,
360.11
23 (2.91) 35,36,41
Vitiligo 709.01 4 (0.51) 35
Wegner’s granulomatosis 446.4 1 (0.13) 50,47
1Agammaglobulinemia and hypogammaglobulinemia were placed in the same category
since the same ICD-9 code is used for both diseases
2
Psoriasis and Psoriatic arthritis were placed in the same category since the same ICD-9 code is used for both diseases
3
This includes both systemic sclerosis and localized scleroderma
4
26
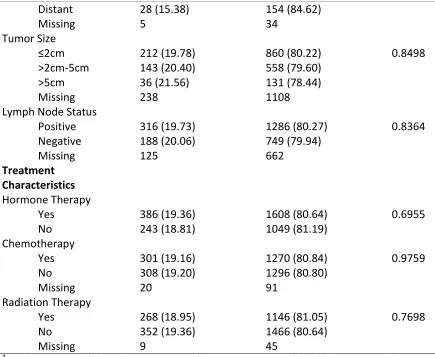
Table 4.2: Baseline patient, tumor, and treatment characteristics of breast cancer patients with and without an AD.
Patients with AD (n=629)
Patients without AD (n=2657)
p-value1
Patient Characteristics
Age at diagnosis 52.05 ± 6.55 50.14 ± 7.83 <.0001
Race
African American 228 (20.73) 872 (79.27) 0.1013
Caucasian 401 (18.34) 1785 (81.66)
Geographic location
Urban 479 (19.38) 1992 (80.62) 0.5375
Rural 150 (18.40) 665 (81.60)
Insurance
Type I 417 (20.41) 1626 (79.59) 0.0177
Type II 212 (17.06) 1031 (82.94)
Year of Diagnosis
2002-2004 175 (17.61) 819 (82.39) 0.3357
2005-2007 203 (19.90) 817 (80.10)
2008-2010 251 (19.73) 1021 (80.27)
Tumor Characteristics Histological Grade
I 93 (19.02) 396 (80.98) 0.3975
II and III 471 (19.42) 1954 (80.58)
IV 7 (12.28) 50 (87.72)
Missing 58 257
Estrogen Receptor Status
ER+ 236 (18.88) 1014 (81.12) 0.2265
ER- 119 (21.33) 439 (78.67)
Missing 274 1204
Progesterone Receptor Status
PR+ 196 (18.33) 873 (81.67) 0.1111
PR- 156 (21.37) 574 (78.63)
Missing 277 1210
Hormone Receptor Status
ER+/PR+ 183 (17.91) 839 (82.09) 0.1022
ER+/PR- 49 (22.90) 165 (77.10)
ER-/PR+ 13 (28.89) 32 (71.11)
ER-/PR- 106 (20.70) 406 (79.30)
Missing 278 1215
Stage
In-situ 101 (18.20) 454 (81.80) 0.4744
Local 275 (19.70) 1121 (80.30)
27
Distant 28 (15.38) 154 (84.62)
Missing 5 34
Tumor Size
≤2cm 212 (19.78) 860 (80.22) 0.8498
>2cm-5cm 143 (20.40) 558 (79.60)
>5cm 36 (21.56) 131 (78.44)
Missing 238 1108
Lymph Node Status
Positive 316 (19.73) 1286 (80.27) 0.8364
Negative 188 (20.06) 749 (79.94)
Missing 125 662
Treatment Characteristics Hormone Therapy
Yes 386 (19.36) 1608 (80.64) 0.6955
No 243 (18.81) 1049 (81.19)
Chemotherapy
Yes 301 (19.16) 1270 (80.84) 0.9759
No 308 (19.20) 1296 (80.80)
Missing 20 91
Radiation Therapy
Yes 268 (18.95) 1146 (81.05) 0.7698
No 352 (19.36) 1466 (80.64)
Missing 9 45
1
P-values were calculated using a t-test for continuous variables (the corresponding mean and standard errors were reported), and a chi-square test for categorical variables (the corresponding frequencies and row percentages were reported)
Abbreviations used: ER (estrogen), PR (progesterone), AD (autoimmune disease)
Table 4.3: Cause of death among those with and without an AD.
Cause of death Patients with AD (n=629) Patients without AD
(n=2657)
p-value1
Alive 493 (18.62) 2154 (81.38) 0.0209
Breast 100 (19.49) 413 (80.51)
Other 36 (28.57) 90 (71.43)
1
P-values were calculated using chi-square test (the corresponding frequencies and row percentages were reported)
28
29
Figure 4.2: All cause survival for those with at least one AD (indicated by the red line) and those without an AD (indicated by the blue line).
Table 4.4: Three, five, and ten-year survival comparison among those with and without an AD.
All Cause Survival Breast Cancer Specific Survival
AD Status by Timepoint
Probability of Survival
p-value1 Probability of
Survival
p-value1
Year 3
AD 0.8855 0.2811 0.9011 0.8763
No AD 0.8712 0.9009
Year 5
AD 0.7998 0.0391 0.8449 0.4728
No AD 0.8371 0.8594
Year 10
AD 0.7442 0.0825 0.8108 0.5677
No AD 0.7742 0.8190
1
30
Table 4.5: Cox model for breast cancer specific mortality among those with and without an AD.
AD status (sample size)
Number of deaths
Unadjusted analysis Multivariable analysis1
HR 95% CI HR 95% CI
No AD (2657) 503 1.0
(referent)
1.0 (referent)
AD (629) 136 1.06 0.85, 1.32 1.09 0.88, 1.36
1
Adjusted for chemotherapy
Abbreviations used: AD (autoimmune disease), HR (hazard ratio), CI (confidence interval)
Table 4.6: Bivariate Cox model for breast cancer specific mortality among those with and without an AD.
Stratum variables by AD status (sample size)
Number of deaths
Unadjusted analysis Multivariable analysis1
HR 95% CI HR 95% CI
Race
African American
No AD (872) 238 1.0
(referent)
1.0 (referent)
AD (228) 63 0.949 0.69, 1.30 0.99 0.72, 1.35
European American No AD (1785)
265 1.0
(referent)
1.0 (referent)
AD (401) 73 1.11 0.82, 1.50 1.14 0.83, 1.55
Insurance Type I
No AD (1626)
158 1.0
(referent)
1.0 (referent)
AD (417) 50 1.22 0.85, 1.74 1.27 0.89, 1.82
Type II
No AD (1031)
345 1.0
(referent)
1.0 (referent)
AD (212) 86 1.12 0.85, 1.47 1.14 0.86, 1.51
Stage
In-situ and local No AD (1626)
140 1.0
(referent)
1.0 (referent)
AD (389) 42 0.89 0.55, 1.44 0.90 0.55, 1.47
Regional and distant
No AD (997) 349 1.0
(referent)
1.0 (referent)
31 Hormone medication Yes No AD (1608)
220 1.0
(referent)
1.0 (referent)
AD (386) 63 1.11 0.80, 1.54 1.14 0.82, 1.59
No
No AD (1049)
283 1.0
(referent)
1.0 (referent)
AD (243) 73 1.03 0.77, 1.39 1.09 0.81, 1.48
Radiation therapy Yes
No AD (1146)
186 1.0
(referent)
1.0 (referent)
AD (268) 43 0.91 0.62, 1.33 0.97 0.67, 1.42
No
No AD (1466)
311 1.0
(referent)
1.0 (referent)
AD (352) 91 1.51 0.88, 1.51 1.17 0.89, 1.54
1
Adjusted for chemotherapy
Abbreviations used: AD (autoimmune disease), HR (hazard ratio), CI (confidence interval)
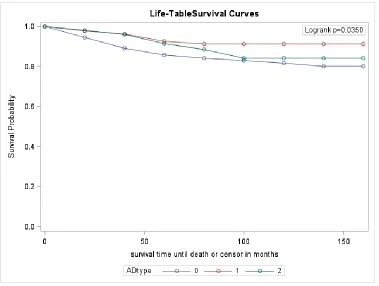
4.2 Secondary outcome
Among the Th1, Th2 dominant AD, and no AD cohorts breast cancer-specific
survival was statistically significant (Figure 4.7). The probability of survival was greater
among the Th1 group compared to the other two groups at all three-time points (Table
4.8). Compared to those without an AD those with a Th2 dominant AD also had a higher
probability of breast cancer-specific survival. All-cause survival was not statistically
significant (Figure 4.3), but at 3-years post-diagnosis that was a significant difference
between the cohorts, with the same pattern that was seen for breast cancer-specific
survival. However, at year 10 those that were in the Th2 cohort had a lower probability
32
Cox models were used to determine the risk of breast cancer mortality among
the three groups. Models were stratified by race, insurance, stage, and hormone
medication due to the time dependence that is associated with these variables.
Adjusted models controlled for both chemotherapy and radiation therapy. There was a
significant reduction in breast cancer mortality for both for those with a Th1 AD
compared to those without an AD (HR: 0.46, 95% CI: 0.25, 0.87). This relationship
remained significant when controlling for both chemotherapy and radiation therapy
with a 55% reduction in breast cancer mortality. A reduction in breast cancer mortality
was also seen for both the adjusted and unadjusted Cox models for those patients with
a Th2 dominant AD, however results were not significant. Among those with breast
carcinoma that was either regional or distant, there was a significant reduction in breast
cancer mortality in both the unadjusted and adjusted Cox models when comparing
those patients with a Th1 AD to those without an AD with a HR of 0.46 (95% CI: 0.23,
0.92) and 0.44 (95% CI: 0.21, 0.93), respectively. However, those with a Th2 AD had an
increase in breast cancer mortality for both the unadjusted and adjusted Cox models
among patients with a breast carcinoma that was either regional or distant.
33 and those without an AD.
Cause of death
Patients with a Th1 AD (n = 136)
Patients with a Th2 AD (n = 53)
Patients without an AD (n = 2657)
p-value1
Alive 121 (5.22) 42 (1.81) 2154 (92.97) 0.0128
Breast 10 (2.33) 6 (1.40) 413 (96.27)
Other 5 (5.00) 5 (5.00) 90 (90.00)
1
P-values were calculated using chi-square test (the corresponding frequencies and row percentages were reported)
Abbreviations used: AD (autoimmune disease), Th1 (T-helper 1), Th2 (T-helper 2)
Figure 4.3: Breast cancer specific survival for those diagnosed with Th1 dominant AD (indicated by the red line), Th2 dominant AD (indicated by the green line), and no AD
34
Figure 4.4: All cause survival for those diagnosed with Th1 dominant AD (indicated by the red line), Th2 dominant AD (indicated by the green line), and no AD (indicated by
the blue line).
Table 4.8: Three, five, and ten-year survival comparison among those with a Th1 dominant and Th2 dominant AD and those without an AD.
All Cause Survival Breast Cancer Specific
Survival AD Status by
Timepoint
Probability of Survival
p-value1 Probability of
Survival
p-value1
Year 3
Th1 AD 0.9559 0.0344 0.9630 0.0197
Th2 AD 0.9245 0.9612
No AD 0.8855 0.9009
Year 5
Th1 AD 0.8946 0.1466 0.9260 0.0358
Th2 AD 0.8417 0.9170
No AD 0.8371 0.8594
Year 10
Th1 AD 0.8593 0.0999 0.9142 0.0378
Th2 AD 0.7156 0.8420
No AD 0.7742 0.8190
1
35
Abbreviations used: AD (autoimmune disease), Th1 (T-helper 1), Th2 (T-helper 2)
Table 4.9: Cox model breast cancer specific mortality among those with a Th1 dominant and Th2 dominant AD and those without an AD.
AD status (sample size)
Number of deaths
Unadjusted analysis Multivariable analysis1
HR 95% CI HR 95% CI
No AD (2657) 503 1.0
(referent)
1.0 (referent)
Th1 AD (136) 15 0.46 0.25, 0.87 0.45 0.23, 0.87
Th2 AD (53) 11 0.70 0.31, 1.58 0.71 0.32, 1.60
1
Adjusted for chemotherapy and radiation therapy
Abbreviations used: AD (autoimmune disease), Th1 (T-helper 1), Th2 (T-helper 2), HR (hazard ratio), CI (confidence interval)
Table 4.10: Bivariate Cox model for breast cancer specific mortality among those with a Th1 dominant and Th2 dominant AD and those without an AD.
Stratum variables by AD status (sample size)
Number of deaths
Unadjusted analysis Multivariable analysis1
HR 95% CI HR 95% CI
Race
African American
No AD (872) 238 1.0
(referent)
1.0 (referent)
Th1 AD (47) 6 0.45 0.19, 1.09 0.48 0.20, 1.17
Th2 AD (20) 4 0.39 0.10, 1.58 0.34 0.08, 1.37
European American No AD (1785)
265 1.0
(referent)
1.0 (referent)
AD (89) 9 0.46 0.19, 1.12 0.40 0.15, 1.08
Th2 AD (33) 7 1.02 0.38, 2.75 1.18 0.44, 3.18
Insurance Type I
No AD (1626)
158 1.0
(referent)
1.0 (referent)
Th1 AD (97) 7 0.66 0.27, 1.61 0.70 0.29, 1.71
Th2 AD (34) 3 0.70 0.17, 2.83 0.70 0.17, 2.83
Type II
No AD (1031)
345 1.0
(referent)
1.0 (referent)
Th1 AD (39) 8 0.45 0.19, 1.09 0.40 0.15, 1.08
Th2 AD (19) 8 0.75 0.28, 2.02 0.76 0.28, 2.04
36 In-situ and local
No AD (1575)
121 1.0
(referent)
1.0 (referent)
Th1 AD (82) 5 0.49 0.12, 2.00 0.50 0.12, 2.04
Th2 AD (39) 5 0.51 0.07, 3.69 0.48 0.07, 3.46
Regional and distant No AD (1048)
368 1.0
(referent)
1.0 (referent)
Th1 AD (53) 10 0.46 0.23, 0.92 0.44 0.21, 0.93
Th2 AD (14) 6 1.09 0.45, 2.63 1.07 0.44, 2.60
Hormone medication Yes
No AD (1608)
220 1.0
(referent)
1.0 (referent)
Th1 AD (84) 6 0.33 0.11, 1.03 0.33 0.11, 1.03
Th2 AD (29) 4 0.61 0.15, 2.46 0.55 0.14, 2.21
No
No AD (1049)
283 1.0
(referent)
1.0 (referent)
Th1 AD (52) 9 0.57 0.27, 1.20 0.61 0.27, 1.38
Th2 AD (24) 7 0.69 0.26, 1.84 0.90 0.34, 2.43
1
Adjusted for chemotherapy and radiation therapy
37
Chapter 5
Discussion
Our study found that there was a significant difference in breast cancer-specific
survival among those with a Th1 dominant AD versus those without an AD diagnosis.
This research suggests that the Th1 immune response that is associated with the Th1
dominant ADs may play a protective role for breast cancer mortality. This study was the
first of its kind to analyze the association between breast cancer survival and the
hypothesized Th1 and Th2 dominant ADs.
An autoimmune disease occurs when B cells develop antibodies to the body’s
organs and/or tissues, resulting in an attack on the body’s otherwise healthy organs and
tissues10. The T helper cells, Th1 and Th2, coordinate and direct the B cells. The Th1
cytokines enhance the antitumor immune response through the secretion of IFN-ƴ,
causing the anti-tumor directed B cell factors and the CD8+ T cells to all work together
to “favor tumor rejection”4. In contrast, the Th2 cytokines secrete pro-growth factors
which ultimately decrease the CD8+ T lymphocytes, resulting in tumor promotion4. This
biological plausibility aligns with the results of this study, showing that the Th1
dominant ADs, Crohn’s disease, Hashimoto’s thyroiditis, Multiple Sclerosis, Psoriasis,
Sjögren’s syndrome, Rheumatoid arthritis, Type I diabetes mellitus, and Uveitis,
38
of this study are consistent with that of other studies. A study conducted by Campbell
and colleagues analyzed the peripheral blood lymphocytes of 84 breast cancer patients
and 26 healthy controls, and found that Th1 cytokines were significantly lower in breast
cancer patients prior to treatment compared to the healthy controls21. An additional
study conducted on over 12,000 breast cancer patients in the United Kingdom and
Canada found that among the women with estrogen receptor negative tumors, the
presence of CD8+ T cells within the tumor, a response that is linked with an increase in
Th1 cytokines, was significantly associated with a 28% reduction in breast cancer
mortality20.
While there have been no studies to date looking at the association between the
Th1 dominant ADs and cancer mortality, there have been a few studies that have
analyzed the association that exists individually for the Th1 ADs that have been
identified in this study. A cohort study conducted in Ontario, Canada identified 178,186
women with breast cancer and found that those with Hashimoto’s thyroiditis had a
significantly lower risk of dying compared to those that did not have an AD (HR: 0.87,
95% CI: 0.77 to 0.98)1. Hemminki and colleagues conducted a study in Sweden,
analyzing the risk and survival of female cancers for individuals ADs, finding a significant
reduction in breast cancer mortality among psoriasis patients (HR: 0.68, 95% CI: 0.50 to
0.94)25.
Strengths of this study include the comprehensive records of each patient that
39
vital status information of each individual from the SCCCR, which updates its’ database
using the National Death Index and the South Carolina Vital Registry. In addition, the
use of both the South Carolina Employee State Health Plan and the South Carolina
Medicaid Program provided a cohort of women that are racially, geographically, and
socioeconomically diverse, providing strong external validity for this study. A weakness
of this present study was the unavailability of data for age at menarche and menopause,
oral contraception, and hormone replacement therapy, all factors that have been
associated with both breast cancer and AD. Many studies have attributed a reduced risk
of cancer seen among individual ADs to immunosuppressive therapy and
anti-inflammatory drug therapies that are often used among AD patients25. Studies have
suggested a link between these therapies and an earlier age at menopause, thus
reducing the risk of developing breast cancer25. Future studies are needed to look at the
40
References
1. Sandhu MK, Brezden-Masley C, Lipscombe LL, Zagorski B, Booth GL. Autoimmune
hypothyroidism and breast cancer in the elderly. Breast Cancer Res Treat.
2009;115(3):635-641. doi:10.1007/s10549-008-0104-4.
2. American Cancer Society. Cancer Facts & Figures. 2016.
doi:10.1101/gad.1593107.
3. Gadalla SM, Amr S, Langenberg P, et al. Breast cancer risk in elderly women with
systemic autoimmune rheumatic diseases: a population-based case-control study.
Br J Cancer. 2009;100(5):817-821. doi:10.1038/sj.bjc.6604906.
4. DeNardo DG, Coussens LM. Inflammation and breast cancer. Balancing immune
response: crosstalk between adaptive and innate immune cells during breast
cancer progression. Breast Cancer Res. 2007;9(4):212. doi:10.1186/bcr1746.
5. Alberts B, Johnson A, Lewis J, Raff M, Roberts K WP. The Adaptive Immune
System. In: The Adaptive Immune System in Molecular Biology of the Cell. 4th ed.
New York: Garland Science; 2002.
6. Lleo A, Battezzati PM, Selmi C, Gershwin ME, Podda M. Is autoimmunity a matter
41
7. Wellhausen S. Autoimmune ( AI ) Diseases : A Women’s Health Epidemic? In:
Society for Women’s Health Research and the National Women’s Health Resource
Center, Inc. ; 2002.
http://drwellhausen.com/wp-content/uploads/2011/07/Autoimmune-in-Women-Wellhausen-July2011.pdf.
8. AARDA. Autoimmune Disease in Women.
http://www.aarda.org/autoimmune-information/autoimmune-disease-in-women/.
9. Elenkov IJ. Glucocorticoids and the Th1/Th2 balance. Ann N Y Acad Sci.
2004;1024:138-146. doi:10.1196/annals.1321.010.
10. Gerstmann L. Immune Deficiency. A Complicated Relationship. IG Living. 2009.
http://www.igliving.com/magazine/articles/IGL_2009-06_AR_Immune-Deficiency-and-Autoimmune-Disease-A-Complicated-Relationship.pdf.
11. Nussinovitch U, Shoenfeld Y. The role of gender and organ specific autoimmunity.
Autoimmun Rev. 2012;11(6-7):377-385. doi:10.1016/j.autrev.2011.11.001.
12. Gleicher N, Barad DH. Gender as risk factor for autoimmune diseases. J
Autoimmun. 2007;28(1):1-6. doi:10.1016/j.jaut.2006.12.004.
13. Jacobson DL, Gange SJ, Rose NR, Graham NMH. Epidemiology and Estimated
Population Burden of Selected Autoimmune Diseases in the United States. Clin
Immunol Immunopathol. 1997;84(3):223-243. doi:10.1006/clin.1997.4412.
42
manifestations of celiac disease: evidence for greater malabsorption in men.
Scand J Gastroenterol. 2005;40(2):183-187. doi:10.1080/00365520510011498.
15. Knudsen GP. Gender bias in autoimmune diseases. X chromosome inactivation in
women with multiple sclerosis. J Neurol Sci. 2009;286(1-2):43-46.
doi:10.1016/j.jns.2009.04.022.
16. Ortona E, Margutti P, Matarrese P, Franconi F, Malorni W. Redox state, cell death
and autoimmune diseases: A gender perspective. Autoimmun Rev.
2008;7(7):579-584. doi:10.1016/j.autrev.2008.06.001.
17. What is Cancer? National Breast Cancer Foundiation, Inc.
http://www.nationalbreastcancer.org/what-is-cancer. Published 2016.
18. Soerjomataram I, Louwman MWJ, Ribot JG, Roukema JA, Coebergh JWW. An
overview of prognostic factors for long-term survivors of breast cancer. Breast
Cancer Res Treat. 2008;107(3):309-330. doi:10.1007/s10549-007-9556-1.
19. Bentzon N, Düring M, Rasmussen BB, Mouridsen H, Kroman N. Prognostic effect
of estrogen receptor status across age in primary breast cancer. Int J Cancer.
2008;122(5):1089-1094. doi:10.1002/ijc.22892.
20. Ali HR, Provenzano E, Dawson SJ, et al. Association between CD8+ T-cell
infiltration and breast cancer survival in 12 439 patients. Ann Oncol.
2014;25(8):1536-1543. doi:10.1093/annonc/mdu191.
43
micrometastases in women with breast cancer. 2005:163-171.
22. Kidd P. Th1/Th2 balance: The hypothesis, its limitations, and implications for
health and disease. Altern Med Rev. 2003;8(3):223-246.
23. van den Broek H, Damoiseaux J, De Baets MH, Hupperts RMM. The influence of
sex hormones on cytokines in multiple sclerosis and experimental autoimmune
encephalomyelitis: a review. Mult Scler. 2005;11(3):349-359.
doi:10.1191/1352458505ms1174rr.
24. Elenkov IJ, Chrousos GP. Stress hormones, Th1/Th2 patterns,
pro/anti-inflammatory cytokines and susceptibility to disease. Trends Endocrinol Metab.
1999;10(9):359-368. doi:10.1016/S1043-2760(99)00188-5.
25. Hemminki K, Liu X, Ji J, Försti A, Sundquist J, Sundquist K. Effect of autoimmune
diseases on risk and survival in female cancers. Gynecol Oncol.
2012;127(1):180-185. doi:10.1016/j.ygyno.2012.07.100.
26. Standish L, Sweet E, Novac J, et al. Breast Cancer and the Immune System. J Soc
Integr Oncol. 2010;6(4):158-168.
doi:10.1097/MPG.0b013e3181a15ae8.Screening.
27. Ji J, Liu X, Sundquist K, Sundquist J. Survival of cancer in patients with rheumatoid
arthritis: a follow-up study in Sweden of patients hospitalized with rheumatoid
arthritis 1 year before diagnosis of cancer. Rheumatology (Oxford).
44
28. Cooper GS, Stroehla BC. The epidemiology of autoimmune diseases. Autoimmun
Rev. 2003;2(3):119-125. doi:10.1016/S1568-9972(03)00006-5.
29. Kelsey JL BL. Epidemiology and prevention of breast cancer. Annu Rev Public Heal
1996. 1996;17(61):47-67. doi:10.1158/1055-9965.EPI-04-0157.
30. Key TJ, Appleby PN, Reeves GK, et al. Circulating sex hormones and breast cancer
risk factors in postmenopausal women: reanalysis of 13 studies. Br J Cancer.
2011;105(5):709-722. doi:10.1038/bjc.2011.254.
31. Using HRT (Hormone Replacement Therapy). Breast Cancer.org.
http://www.breastcancer.org/risk/factors/hrt. Published 2017.
32. García Rodríguez L a, González-Pérez a, Johansson S, Wallander M. Risk factors
for inflammatory bowel disease in the general population. Aliment Pharmacol
Ther. 2005;22(4):309-315. doi:10.1111/j.1365-2036.2005.02564.x.
33. Kroman N, Jensen MB, Wohlfahrt J, Mouridsen HT, Andersen PK, Melbye M.
Factors influencing the effect of age on prognosis in breast cancer: population
based study. BMJ. 2000;320(7233):474-478. doi:10.1136/bmj.320.7233.474.
34. Cristofanilli M, Yamamura Y, Kau SW, Bevers T, ... Thyroid hormone and breast
carcinoma. Cancer. 2005;103(6):1122-1128. doi:10.1002/cncr.20881.
35. Walsh SJ, Rau LM. Autoimmune diseases: a leading cause of death among young
and middle-aged women in the United States. Am J Public Heal.