35
Abstract— In today’s world of flexible automation, users should be able to rely on the performance of robots. The ISO 9283 presents the criteria and related testing methods to determine performance characteristics of industrial manipulators. This paper reports on the process of experimental evaluation, improvement and objective/quantitative comparison among different performance indices of two types of robots: a revolute robot and a prismatic robot. Using certified technical standards, these indices are calculated based on experimental analyses. Additionally in order to further improve the functionability of robots, risk assessment of robot is done using IEC 31010 standard and FMEA approach. Performance indices are compared after and before applying the correction actions obtained from risk assessment. The results show that the accuracy and repeatability of both robots are substantially enhanced after correcting the design and applying the changes on manufactured robots. The main contribution of this paper is the design improvement of robotic workability using FMEA method as well as the calculation of performance indices using experiments and following the international standards.
Keywords— Manipulators, Accuracy, Repeatability, Tracking, Design Validation, Risk Management, Load Capacity.
I. INTRODUCTION
OBOT CALIBRATIONis the process of determining the actual values of kinematic and dynamic parameters of an industrial robot. Kinematic parameters describe the relative position and orientation of links and joints in the robot while the dynamic parameters relate to arm masses and internal joint friction.
A calibrated robot has a higher absolute positioning accuracy than an uncalibrated one, i.e., the real position of the robot end-effector corresponds better to the position calculated from the mathematical model of the robot. Absolute positioning accuracy is particularly relevant in connection with robot exchangeability and off-line programming of precision applications. Industrial robotic systems have been implemented in many fields of human life. The flexibility of the newly introduced robots was quickly seen to be enhanced through visual experimental tests. Particular advantages of calibrated robotic systems include:
- Easily controlled/ programmed movements,
Y. Maddahi is with the University of Manitoba, Winnipeg, MB, Canada (e-mail: [email protected]).
N. Sepehri is with the University of Manitoba Winnipeg, MB, (corresponding author to provide Phone: 204-474-6834; Fax: 204-275-7507; e-mail: [email protected]).
H. Ghorabi is with the Islamic Azad University, Saveh Branch, Saveh, Iran (e-mail: [email protected]).
A. Maddahi is with the Dept. of Mechanical Engineering department at the K. N. Toosi University of Technology, Vanak Sq., Tehran, Iran (e-mail: [email protected]).
- High accuracy,
- High speed and large pay load capacity, - Control system simplicity,
- Inherently stiff structure, - Large working envelope, - Structural simplicity,
Recently, interests in performance analysis, calibration and experimental evaluation of robotic arms have increased with a various theoretical and practical contributions being made. Some [1], [2] focused on planning a sequence of “commutation configurations” for the mobile base when the robot performed a sequence of tasks subject to various constraints and optimization criteria. Korayem et al. [3] presented the design of a robot for an assembly line, and the proposed robot is applied for one of the important stations in the assembly line. Kinematic and dynamic modeling, finite element analysis (FEA), quality function deployment (QFD), and failure mode and effect analysis (FMEA) are used in this paper. Ghayoumi et al. [4] have performed the experimental test on Cartesian robot. They reduced correlation error applying a fuzzy model in stereo vision of a 3p robot.
Azhdari et al. [5] obtained a dynamic model for a two degree-of-freedom planar robot arm. The links of the arm, connected to prismatic and revolute joints, were considered to be flexible. They assumed to be fabricated from either aluminum or laminated composite materials. The model was derived based on the Timoshenkov beam theory in order to account for the rotary inertia and shear deformation.
Callegari et al. [6] presented a high-speed Cartesian robot produced by Campetella Robotic Center. This robot was characterized by good dynamic performances but was chosen by the producer for re-engineering that should allow it to meet even more advance targets. Ion [7] performed some experimental tests on a waling robot in order to determine the condition of robot in static and dynamic stabilities. In this work, different methods of leg adjustments and body adjustments were integrated into the strategy. Also, they analyzed the possibilities of determination of the limit conditions for the stable displacement of the walking robots.
Maddahi et al. [8], [9] proposed an algorithm for determination of load capacity of a redundant mobile robot and performed some experimental tests in order to determine the performance of robot. Also, they implemented some designed tests on a 4R pick and place robot including path tracking (kinematically) and determination of load carrying capacity (dynamically).
Ismail et al [10] evaluated the performance of an industrial robot under payload and various distances within the working envelope. Relationship between the location and payload versus repeatability were obtained. Jackson et al. [11] addressed the issues that must be accounted to develop the architecture for
Testing Robotic Manipulators: Improvement
and Experience
Y. Maddahi, N. Sepehri, H. Ghorabi and A. Maddahi
36 robotics within the infrastructure. These issues are the basis for design decisions in developing robotic infrastructure systems.
Baron and Tondu [12] presented a deductive method for safety analysis. In order to apply this technique for a medical robot, they analyzed human safety factors by using FMEA and FTA, as well as obtained different failure modes and their effects on the human.
In this paper, we show how the performance indices in robotic arms can be influenced by risk reduction and design improvement. The proposed approach is a combination of requirements of IEC 31010 standard, FMEA method and two-camera measurement technique. The approach is used to increase the accuracy and repeatability based on the risk assessment and design improvement in robotic arms and is implementable for all robot types. In order to validate the method, experimental tests are carried out on two different robots and the performance indices are obtained. The tests are done according to the requirements of ISO 9283 certified standard. The comparative studies are also done to investigate the results of experimental results for both robots before and after applying the corrective actions concluded from risk assessment.
II. DEFINITIONS
This section covers related definitions of reference performance indices and standards that we have used during the design and experimental stages.
A. Performance Indices A.1. Measurement Systems
There exist different possibilities for pose measurement with industrial robots, e.g. touching reference parts, using supersonic distance sensors, laser interferometry, theodolites, calipers or laser triangulation. Furthermore there are cameras systems which can be attached in the robot’s cell or at the industrial robotmounting plate and acquire the pose of a reference object. The manufactured robot should accomplish the given commands accurately and smoothly. This is possible in the case that the motion of the end-effector of the robot is accurate enough relative to the target-object.
A.2. Accuracy
The accuracy of a robotic manipulator is the degree of closeness of robot position to its actual value. Accuracy indicates proximity of measurement results to the true value.
The accuracy of actual robot is under the effect of the following factors such as the accuracy of manufacturing mechanical parts of the robot, the accuracy of assembling the constituting part of robot, the accuracy during the robot operation that is influenced by external forces, electronics system accuracy and motors operations, clearance existing in the system, wear behaviors (change in accuracy of the robot in long duration), change in accuracy of system after assembling the disassembled parts due to repair and change in the system accuracy during the PM (Preventive Maintenance) periodic programs.
A.3. Repeatability
Repeatability or test-retest reliability of robot position is the variation in measurements of end-effector position taken by a single user or instrument on the same item and under the same conditions. A measurement is said to be repeatable when this variation is smaller than some agreed limit. The repeatability conditions include:
• The same measurement procedure,
• The same observer,
• The same measuring instrument, used under the same conditions,
• The same location,
• Repetition over a short period of time. B. Standards
B.1. IEC 31010
IEC 31000 provides a standard on the implementation of risk management. The purpose of this standard is to be applicable and adaptable for "any public, private or community enterprise, association, group or individual".
The used method to implement the risk analysis in these robots is failure modes and effects analysis (FMEA). FMEA is a procedure for analysis of potential failure modes within a system for classification by severity or determination of the effect of failures on the system. It is widely used in manufacturing industries and is now increasingly finding use in the service industry. Failure modes are any errors or defects in a process, design, or item, especially those that affect the customer, and can be potential or actual. Effects analysis refers to studying the consequences of those failures.
Since, inappropriate accuracy and repeatability conclude some risks and hazards in the robotic stations; we used this method in order to increase the amount of performance indices.
In each FMEA analysis, some suggested evaluation criteria are used to evaluate three factors for each failure mode. These factors are:
• Severity (S) • Occurrence (O) • Detection (D)
Using FMEA method, the Risk Priority Number (RPN) is calculated as RPN=S×O×D. Within the scope of the individual FMEA, this value (between 0 and 1) is used to rank order the risk priority in the robots design [15].
B.2. ISO 9283
Robot performance testing is defined in ISO 9283. This standard is setting different performance criteria for industrial robot and suggesting test procedures in order to obtain appropriate parameter values. The aim of this standard is providing technical information to help users to select the most convenient robot for their purposes. This standard defines important principles based on the path, and then different appearances will be seen to evaluate them. These principles are approximate accuracy of the path, absolute accuracy of the path repetition ability of the path rapidness specifications and corner variable. The most important criteria, and also the most
37 commonly used, are accuracy of pose (AP) and repeatability of pose (RP) which defined as below [16]:
2 2 2 ( ) ( ) ) ( /RP xa xd ya yd za zd AP = − + − + − (1)
where
x
a,y
a andz
a are the actual coordinate of the end-effector at stop point and (x
d,y
d,z
d) is the desired coordinates.Since we are interested in experimental validation of accuracy and repeatability, the design of robot has been based on the agreed values for these parameters as shown in Table I.
Table I. Preferred performance indices values. Robot Accuracy [mm] Repeatability 5 times [mm] Repeatability 10 times [mm] 3R 8 15 24 3P 5 10 15
The values mentioned in Table I, are tested for given trajectories. All indices should be less than the desired values.
III. DESIGN OF ROBOTS
Mechanical and manufacturing design processes of the robot are done using Mechanical Desktop® software. In addition, the design of 3R and 3P robots are carried out considering IEC 31010 requirements.
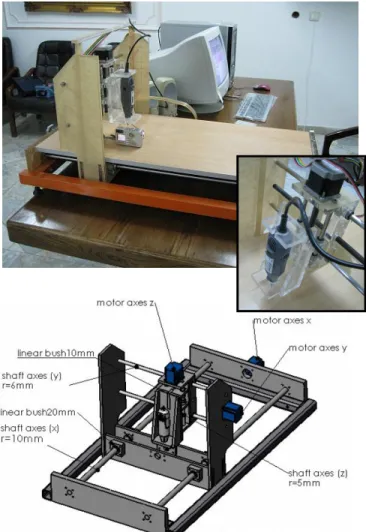
A. 3R Robot
The 3R robot was designed on basis of an assumption in which each joint has an independent actuator with gear reduction and measuring angular joint position sensor (Fig. 1). Implementing IEC 31010 standard, the risks and hazards are recognized and reduced during the design and manufacturing stages which are described in the following sections.
The shafts motors has 80 rpm/450 Nmm (Motor I), 220 rpm/200 Nmm (Motor II) and 200 rpm/150 Nmm (Motor III). Also, In order to track the position of end-effector, two cameras are attached to the test platform.
B. 3P Robot
In this Cartesian robot, a controller including three drivers with its own servo motors is used to drive the shafts. One motor with built-in reduction gears, incremental encoder and are considered for each axis. The resolution of the encoders is 48 pulses/rev. The mechanical mechanism in manufactured platform consists of three gearboxes and three shafts for transmitting the angular velocities of gearboxes to the axis shafts. The parts of Cartesian robot have been shown in Fig 2.
On bottom of the robot, covering platform is a wood plate that the work pieces are mounted top of this plate. The manufactured base works with a Pentium IV, 1600 MHz and uses it for position recognition processing. The file is sent to computer in “.dwg” format and the designed software (appendix I) converts it to CNC machine programming language (G/M codes). When microprocessor receives the converted file, the data are sent to motors and then the axes are driven.
Fig. 1. Prototype model of 3R robot.
38 Also, a vision system includes two cameras provides record of end-effector configuration in X, Y and Z directions.
The shafts are characterized by 1.8 deg/step accuracy, 2A/2.3Ω and 9 kg holding torque. Also, the spindle actuator is driven by 8000-28000 rpm/200w motor with screw mechanism.
IV. SYSTEM EQUATIONS
A. Kinematics
Kinematics analysis allows the study of the position and velocity variables. The kinematics of manipulators involves the study of the geometric and time-based properties of the motion, and in particular how the various links move with respect to each other over the time. The data obtained from this section can be used in order to determine the value of dynamical parameters such as load capacity of robots.
A.1. 3R Robot
Figure 3 depicts the kinematic diagram of 3R robot. As shown, li (i=1, 2, 3) is the length of the links.
Fig. 3. Generalized coordinates (
θ
1,
θ
2,
θ
3) of 3R robot. Considering Fig. 2 as well as using the Denavit-Hertenberg notations, the transformation matrix is obtained as follows [17]:
−
−
−
=
1
0
0
0
.
.
0
.
.
1 1 23 23 1 23 1 23 23 1 23 1 o o oz
y
x
c
s
c
s
s
s
c
s
c
s
c
c
T
(2)
where Si =Sin
( )
θi andCi=Cos( )
θi and1 2 2 23 3 1 2 2 23 1 3 1 2 2 23 1 3 . . . . . . . . . . l S l S l z S C l C S l y C C l C C l x o o o + + = + = + = (3)
Also, using the inverse kinematics techniques, joint variables are calcutared in terms of trajectory parameters:
0 180 180 0 2 ) , ( 2 tan ) , ( 2 tan 1 1 0 0 0 0 1 ≤ ≤ − ≤ ≤ − = θ θ π θ x y A x y A (4) 3 2 2 3 2 2 2 1 0 2 0 2 0 3 2 ) ( cos l l l l l z y x + + − − − ± = θ (5) − + = ψ β ψ β θ2 (6) where ) ( ) ( tan 2 0 2 0 1 0 1 y x l z + − = −
β
(7) 2 1 0 2 0 2 0 2 2 3 2 2 2 1 0 2 0 2 0 ) ( 2 ) ( cos l z y x l l l l z y x − + + − + − + + =ψ
(8)where (x0, y0,z0) is the end-effector coordinate.
A.2. 3P Robot
For 3P robot, the transformation matrix is obtained as follows: = 1 0 0 0 0 0 1 1 0 0 0 1 0 3 2 1 d d d T (9)
where d1, d2and d3 are the prismatic joints displacement in x, y and z directions, respectively (Fig. 4).
Fig. 4. Generalized coordinates (
d
1,
d
2,
d
3) of 3P RobotGiven a desired position and orientation for the end effector of robot, for finding values of the joint parameters which satisfy the direct kinematics equations, we need to solve inverse kinematics of robot which is easy to do using (4) to (8) for 3R robot and (9) for 3P robot.
B. Dynamics
The calculation of motion equations is necessary in order to obtain the amount of torques required for each actuator. The created model of robot must be accurate enough to give results, which satisfactorily describe the operation of the actual system, but is simple enough to be in practical use.
B.1. 3R Robot
Using Lagrangian approach, all torques of actuators are obtained in terms of inertia of ith links (Ii) and mass (mi), angular velocity and acceleration of ith actuator (
θ
&i andθ
&&i).39 (10) The derived equation for torque of motor 1 can be expressed as follows: − − + − + + + + + + + + + = 2 . 2 . 2 . 2 2 2 . 2 . 2 . 2 2 2 . 2 . 2 . 2 2 . 2 2 ( 1 ). 2 23 . 3 2 23 . 3 2 . 2 . 23 . 3 . 3 2 2 2 . 2 2 . 3 2 23 . 2 3 . 3 2 2 . 2 2 2 . 2 2 2 . 2 2 . 2 1 ( 1 θ θ θ θ τ & & & & & c s yy I c s xx I c s c l m c yy I s xx I c l c c l m c l m c c l m c yy I s xx I c c l m yy I 1 )) 3 2 .( 23 . 23 . 3 2 ) 3 2 .( 23 . 23 . 3 2 3 . 2 . 2 . 23 . 2 . 3 2 3 . 2 . 23 . 2 . 2 . 3 2 2 . 2 . 2 . 2 2 . 3 2 ) 3 2 .( 23 . 23 . 2 3 . 3 2 θ θ θ θ θ θ θ θ θ θ & & & & & & & & & & + − + + − − − + c s yy I c s xx I c l c s l m c l c s l m c s l m c s c l m
where
C
ij andS
ij represents cos(θ
i+θ
j) and sin(θ
i +θ
j),respectively.
B.2. 3P Robot
Using the same approach, the dynamic modeling of 3P robot is derived as follows: 3 3 1 (m m )d F = + p && (11) 2 3 2 2 (m m m )d F = + + p && (12) ) ( ) ( 1 2 3 1 1 2 3 3 m m m mp d g m m m mp F = + + + && − + + + (13)
where m1,m2,m3 and mp are masses of motor 1, 2 and 3 and associated equipments and mass of main body,
F
1,
F
2 and3
F are the input torque to motors 1, 2, and 3 move in X, Y and Z directions, respectively.
V. RISK ASSESSMENT AND ANALYSIS
To investigate the performance of the robots, based on the defined indices, some experimental tests are performed on the robots. The results of these experiments, which are shown in next section, confirm that there are some errors in the system. These errors can not satisfy the agreed values defined during the design stage.
In order to reduce these errors, some known techniques are used. The risk assessment of robots and creating new changes in the system is one of these approaches.
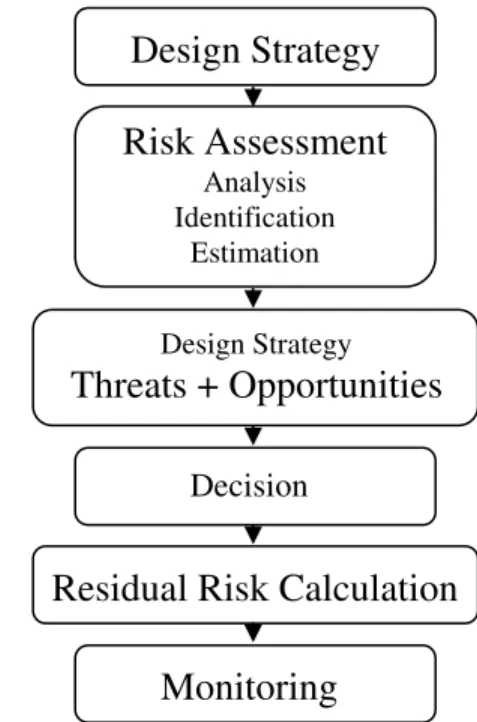
Figure 5 flowcharts the risk assessment process used in this paper. As mentioned before, FMEA method is used in order to assess the risks and hazards. As depicted in this figure, the risk assessment starts based on the strategy defined during the conceptual design process. It’s followed by risk analysis, identification and estimation stages, respectively. After risk estimation, the risks are evaluated and finally the decision is made based of the recognized threats and opportunities. The main part of this flowchart is the evaluation of residual risk in the system after applying the risk assessment procedure.
As will be explained in experimental tests, some components of both robots have high RPN which these critical components need to be improved in order to reduce critical situations for the system. Thus, some corrective
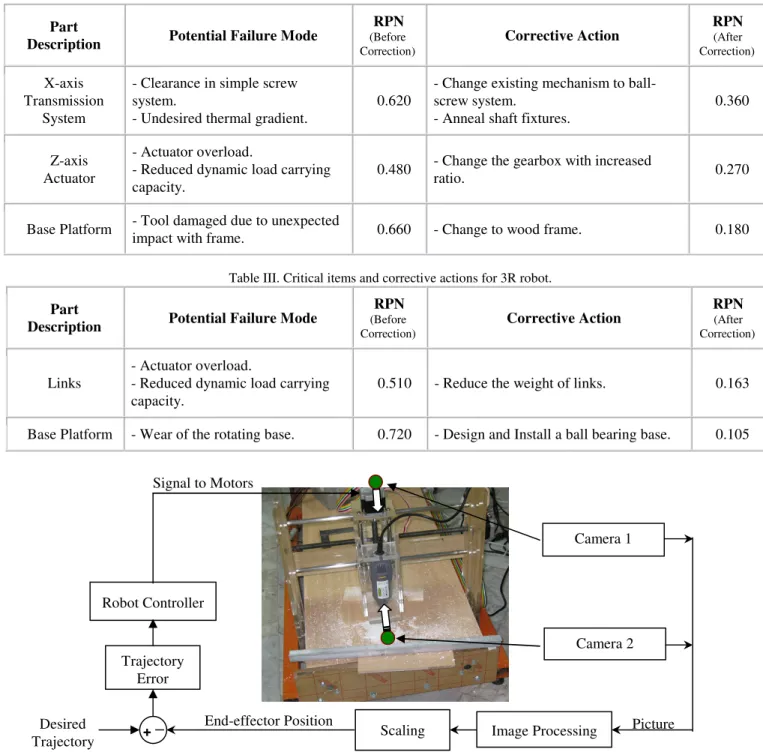
actions are needed for these critical items to improve the performance indices. Some of critical components, failure modes, their RPN number, and corrective actions for 3R and 3P robots are listed in table II and III, respectively.
As shown in these tables, considering the corrective actions applied on the robots, the value of RPN is obtained in before and after correction conditions.
Fig. 5. Risk assessment process. VI.PERFORMANCE TESTS
In experimental tests, first the prototype models of manufactured robot are tested and the performance indices are obtained and compared with the reference values mentioned in Table I.
As the calculated indices could not satisfy the design criteria, thus, the risk assessment methods are applied on the robots in order to improve the existing model. Also, the tests are repeated for both robots while the some correction actions are done during the design and manufacturing process and the performance indices are calculated based on the new data. Finally, the improvement percentages are calculated and compared.
The performance tests are based on requirements set by ISO 9283 and two-camera measurement technique. The test parameters include accuracy and repeatability of end-effector position as well as path planning of tool located in end-effector.
A. Camera Positioning
To transform these coordinates to global reference coordinate, the scaling technique is used which maps the position of tool in the photo to the global position of end-effector. With images from these two fixed cameras, the position of objects is calculated and its coordinates are obtained. As shown in Fig. 6, for 3P robot, two cameras with a certain distance form each other are looking at the end-effector.
Design Strategy
Risk Assessment
Analysis Identification Estimation Design StrategyThreats + Opportunities
Decision
Residual Risk Calculation
Monitoring
40
Table II. Critical items and corrective actions for 3P robot.
Part
Description Potential Failure Mode
RPN (Before Correction) Corrective Action RPN (After Correction) X-axis Transmission System
- Clearance in simple screw system.
- Undesired thermal gradient.
0.620
- Change existing mechanism to ball-screw system.
- Anneal shaft fixtures.
0.360
Z-axis Actuator
- Actuator overload.
- Reduced dynamic load carrying capacity.
0.480 - Change the gearbox with increased
ratio. 0.270
Base Platform - Tool damaged due to unexpected
impact with frame. 0.660 - Change to wood frame. 0.180
Table III. Critical items and corrective actions for 3R robot.
Part
Description Potential Failure Mode
RPN (Before Correction) Corrective Action RPN (After Correction) Links - Actuator overload.
- Reduced dynamic load carrying capacity.
0.510 - Reduce the weight of links. 0.163
Base Platform - Wear of the rotating base. 0.720 - Design and Install a ball bearing base. 0.105
Fig. 6. Position-based control structure of 3P robot and the stationary cameras for performance tests.
Fig. 7. Typical images of the end-effector of 3P robot in two subsequent frames. Previous Position Displacement Frame 1 Frame 2 Camera 1 Camera 2 Image Processing Scaling Trajectory Error Picture End-effector Position Robot Controller Desired Trajectory + Signal to Motors _
41 One of these two stationary cameras is fixed and zooms along Z axis (camera 1) and another one is located in Y axis direction (camera 2). Position of end-effector is determined in image plane and then is transferred to global coordinate by using derived transformation matrixes.
The camera takes the sequences of photo from object located at end-effector and the encoders read the amount of pulses of motors and finally, the pictures are scaled and the end-effector and target are recognized among other objects. Then based on the input desired path, the amount of errors (X, Y, Z) in three directions is calculated.
Also, Fig. 7 shows two pictures taken during the experiment. This figure shows the position of 3P Robot end-effector in two subsequent frames.
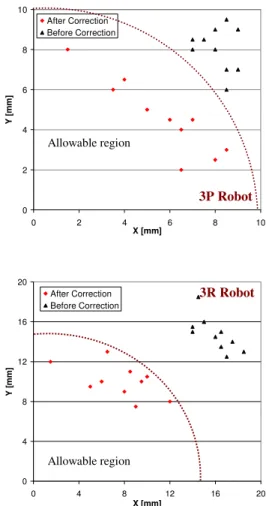
B. Experimental Results of Accuracy of Pose (AP) and Repeatability of Pose (RP)
Based on the described technique and according to the requirements of ISO 9283, the amount of accuracy of pose (AP) and repeatability of pose (RP) are obtained before and after design modification.
0 2 4 6 8 10 0 2 4 6 8 10 X [mm] Y [ m m ] After Correction Before Correction 0 3 6 9 12 15 0 3 6 9 12 15 X [mm] Y [ m m ] After Correction Before Correction
Fig. 8. Accuracy of pose test for 3R and 3P robots in planar motion. In all tests described in this section, the robots are programmed to move in a direct trajectory with l=250 mm in X-Y plane. Thus, due to the constant height of end-effector, the results are depicted in X-Y plane.
Figure 8 shows the results of AP test for both robots for given coordinate. The points show the stop points after and before applying the corrective actions concluded in FMEA analysis. As shown for each case, this test is performed for 10 times which the data shown here are the differences between the desired and actual positions as follows:
) , , ( ) , , (X Y Z = Xa −Xd Ya −Yd Za−Zd (14) where (Xa,Ya,Za) and ( d d d Y Z
X , , ) are the actual and desired coordinates, respectively. The actual coordinates are calculated using the mapping algorithm described before. As, the end-effector position in Z direction doesn’t vary, the amount of error in Z direction is considered to be zero.
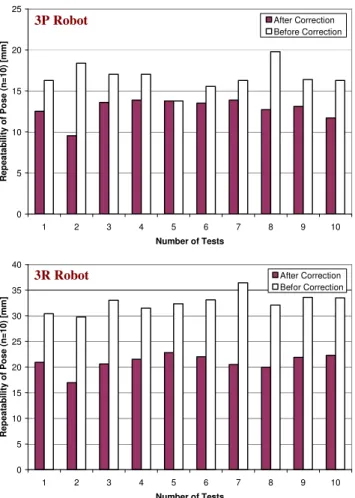
The repeatability coefficient is a precision measure which represents the value shown in Fig. 9 and 10. The standard deviation under repeatability conditions is part of accuracy. Figure 9 shows the results of repeatability test for both cases when n=5 and the similar results are depicted in Fig. 10 when n=10. 0 2 4 6 8 10 0 2 4 6 8 10 X [mm] Y [ m m ] After Correction Before Correction 0 4 8 12 16 20 0 4 8 12 16 20 X [mm] Y [ m m ] After Correction Before Correction
Fig. 9. Five times repeatability tests for 3R and 3P robots. C. Trajectory Test
In this stage, desired pose of end-effector is given to robots to go there. By computing joint angles from inverse kinematics equations and rotation of joints, end effector will move there. By taking pictures with two fixed cameras and derived equations, we will have position coordinates of end-effector in global reference frame. Also, by comparing the ideal amounts of pose and real one, the positioning error are determined.
3P Robot Allowable region 3P Robot Allowable region 3R Robot Allowable region 3R Robot Allowable region
42 C.1. Circular path
The accuracy, repeatability and error of both robots on the circular continuous path traversing are determined. The circle is in horizontal plane i.e. height of the end effector is constant from earth level. The orientation of the end-effector is constant, thus, the end-effector is always in horizontal plane and normal to circular path and end-effector slides along perimeter of circle. During motion of end-effector on the path, 32 images have been taken from end effector using two cameras (Fig. 6).
In this way, end effector coordinates in image plan will be collected. Using mapping system, the image coordinates of points are transformed to the reference frame. The desired path and actual path traversed in Fig. 11 for both robots.
0 5 10 15 20 25 1 2 3 4 5 6 7 8 9 10 Number of Tests R e p e a ta b il it y o f P o s e ( n = 1 0 ) [m m ] After Correction Before Correction 0 5 10 15 20 25 30 35 40 1 2 3 4 5 6 7 8 9 10 Number of Tests R e p e a ta b il it y o f P o s e ( n = 1 0 ) [m m ] After Correction Befor Correction
Fig. 10. Ten times repeatability tests for 3R and 3P robots. C.2. Rectangular path
In next experiment, the error of the end-effectors motion along rectangular path is also considered. In order to do this, the vertex coordinate, length and width of rectangle for the robot is defined. Orientation of end-effector is tangent to path. In this test, the transformation matrix of end-effector is determined, and then the inverse kinematics equations are solved and finally, while the end effector moves in this path, some images are taken from the-end effector by the two cameras attached on the platform (Fig. 12).
C.3. Straight line
To move end-effector along a direct line its start and end points must be determined. Approach vector direction is normal
to direction of line path i.e. end-effector is always normal to its path.
With pose of end-effector and inverse kinematics equations of robot joint angles are computed. Joints rotate and end-effector is positioned along its path. Coordinates of end-effector in global reference frame are determined by taking pictures with two fixed cameras. The positioning error is determined by comparing the desired pose and actual one. Error of robots in traversing direct line path, when they move along X axis are shown in Fig. 13.
VII.STATISTICAL ANALYSIS
In order to compare the obtained results with the agreed values in design stage, the calculated indices based on the data derived in experimental tests are considered according to the Table IV.
Table IV. Experimented indices values for both cases.
Robot Performance Indices Mean Accuracy [mm] Mean Repeatability 5 times [mm] Mean Repeatability 10 times [mm] Desired Values 3R 8 15 24 3P 5 10 15 Before Correction 3R 15.21 23.51 36.42 3P 10.70 12.75 19.80 After Correction 3R 7.50 14.53 22.80 3P 3.91 9.01 13.90
As shown in this table, all derived data are acceptable and confirm the final design based on the agreed values. Then the design is acceptable in the sense of defined and agreed indices.
VIII.CONCLUSIONS
This paper presented the procedure of experimental evaluation and enhanced of the design of two types of 3 DOF robots: a revolute and a prismatic robots, using certified technical standards. The performance indices were obtained using experimental tests in order to compare with respect to the reference values. These indices were specified at the beginning of the design process as design inputs, based on the expected workability of robots. They included accuracy, repeatability and path tracking in free motion. The experiments were performed based on the procedures recommended in ISO 9283 titled “Manipulating industrial robots - Performance criteria and related test methods”. A two-camera technique was used to obtain the position of end-effector. The initial design of robots was improved by implementing the requirements of international standard IEC 31010 (Risk Assessment Techniques) and the new indices were obtained, which showed great improvement over the previous prototypes. The applied risk assessment method was shown to improve the accuracy and repeatability for both cases. For example, the accuracy and ten times repeatability were improved by 50.69%, and 37.40% for 3R robot as well as 47.87 and 39.03% for 3P robot, respectively.
3P Robot
43 -6 -4 -2 0 2 4 6 -6 -4 -2 0 2 4 6 X Axis [mm] Y A x is [ m m ] Desired Path Actual Path -4 -2 0 2 4 -4 -2 0 2 4 X Axis [mm] Y A x is [ m m ] Desired Path Actual Path
Fig. 11. Trajectory error in circular path for both robots using camera.
0 2 4 6 8 10 12 14 0 2 4 6 8 X Axis [mm] Y A x is [ m m ] Desired Path Actual Path -10 -5 0 5 10 -10 -5 0 5 10 X [mm] Y [ m m ] Desired Path Actual Path
Fig. 12. Trajectory error in rectangular path using camera
0 0.05 0.1 0.15 0.2 0.25 0.3 0.35 0 1 2 3 4 5 6 X [mm] Y [ m m ] Desired path Actual Path 0 0.05 0.1 0.15 0.2 0.25 0.3 0.35 0.4 0.00 1.00 2.00 3.00 4.00 5.00 6.00 X [mm] Y [ m m ] Desired Path Actual Path
Fig. 13. Trajectory error in straight line along X axis.
APPENDIX I
The typical interface window and some features of designed software for 3P robot are shown in Fig. 14. This paper is comprehensive software about the robotic training and also, is applicable during the experimental analysis of robotic manipulators.
The main duties of this software are:
- Mapping the taken pictures and changing the existing generalized coordinate to reference coordinate in order to determine the position of tool,
- Conversion of “.dwg” files to M/G codes (CNC machine language),
- Training the fundamental areas of robotics,
- Design of test and statistical analysis based on the data derived in experiments. 3P Robot 3R Robot 3R Robot Start/end Point Start/end Point 3P Robot 3R Robot 3P Robot
44 Fig. 14. Screen shot of computer interface with 3P robot.
ACKNOWLEDGMENT
This work was partially supported by the robotic research laboratory in Islamic Azad University (Saveh Branch).
REFERENCES
[1] D. H. Shin, B.S.Hamner, S. Singh, and M. Hwangbo, “Motion planning for a mobile manipulator with imprecise locomotion”, IEEE/RSJ International Conference on Intelligent Robots and Systems, vol. 1, October 2003, pp. 847–853.
[2] F. Pin, K. Morgansen, F. Tulloch, C. Hacker, and K. Gower, ”Motion planning for mobile manipulator with a non-holonomic constraints using the FSP”, J. of Robotic Systems, vol. 13, no. 11, 1996, , pp. 723-736.
[3] M.H. Korayem, N. Shiehbeiki and T. Khanali, “Design, manufacturing, and experimental tests of a prismatic robot for assembly line”, The International Journal of Advanced Manufacturing Technology, vol. 29, 2006, pp. 379-388. [4] M. Ghayoumi, P. Porkar Rezayeyeh and M. H. Korayem,
“Correlation Error Reduction of Images in Stereo Vision with Fuzzy Method and Its Application on Cartesian Robot”, 19th Australian Joint Conference on Artificial Intelligence, vol. 4304, 2006, pp. 1271-1275.
[5] A. Azhdari, N. G. Chalhoub and F. Gordaninejad, “Nonlinear Dynamic Modelling of a Revolute-Prismatic Flexible Composite-Material Robot Arm”, Journal of Vibration and Acoustics, vol. 113, 1991, pp. 461-468. [6] Massimo Callegari, Ferdinando Cannella, Sergio Monti,
Claudio Santolini and Paolo Pagnanelli, “Dynamic Model for a Re-Engineering of a High-Speed Cartesian Robot”, IEEE/ASME Int. Conf. on Advanced Engineering Mechatronic Proceedings, Italy, 2001.
[7] Ion Ion, Luige Vladareanu, Ion Simionescu and Aurelian Vasile, “The Movement of Modular Walking Robot MERO in the Obstacles’ Area”, WSEAS Transactions on System, Issue 7, vol. 7, 2008, pp. 843-865.
[8] Y. Maddahi, "Calculation of Load Carrying Capacity on a Redundant Manipulator", 2nd WSEAS Int. Conf. on Circuits, Systems, Signal and Telecommunications (CISST'08), Acapulco, Mexico, 2008, January 25-27.
[9] H, Ghorabi, Y. Maddahi, S. M. Hosseini Monsef and A. Maddahi, “Design and Experimental Tests of a Pick and Place Robot: Theoretical and Experimental Approaches”, Applications of Electrical Engineering (AEE '10), Malaysia, 2010, March 23-25.
[10] A. R. Ismail, A. Hassan, S. Syamsuddin, M. Zakinuawi, S. Abdullah and H. M. Ibrahim, “8th WSEAS Int. Conf. on Robotics, Control and Manufacturing Technology (ROCOM '08), Hangzhou, China, April 6-8, 2008. [11] J. D. Jackson, D. W. Callahan, D. S. Appleby and L. B.
CALLAHAN, “Design Requirements and Framework for a Robotic Infrastructure System”, Proceedings of the 5th WSEAS Int. Conf. on Circuits, Systems, Electronics, Control and Signal Processing, USA, November 1-3, 2006.
[12] Guiochet J, Tondu B, Baron C. Integration of UML in human factors analysis for safety of a medical robot for tele-echography. In: Proceedings of the international conference on intelligent robots and systems, IROS03, October 2003.
[13] 1. Wang LT, Ravani B, “Dynamic load carrying capacity of mechanical manipulators: I: Problem formulation”, J Dyn Sys Measure Control, vol. 110, 1988, pp. 46–52. [14] Wang LT, Ravani B, “Dynamic load carrying capacity of
mechanical manipulators: II: Computational procedure and applications”, J Dyn Sys Measure Control, vol. 110, 1988, pp. 53–61.
[15] Lange KA, Leggett SC, Baker B. Potential failure mode and effect analysis (FMEA) reference manual. 2001. [16] ISO 9283:1998, “Manipulating industrial robots
performance criteria and related test methods”, 1998. [17] J. Denavit and R.S. Hartenberg, ”A kinematic notation
for lower-pair mechanisms based on matrices”, ASME Journal of Applied Mechanics, 1955, pp.215-221.
Yaser Maddahi received his M.Sc. degree in Mechanical Engineering from the Iran University of Science and Technology, Tehran, Iran, in 2003. Currently he is pursuing his Ph.D. degree in the Mechanical and Manufacturing Engineering at the University of Manitoba, Winnipeg, Manitoba, Canada. He became member of IEEE, ASME and CSME in 2009.
He was faculty member in Mechanical Engineering department at Islamic Azad University, Saveh Branch. His research interests are in the area of test and calibration of mobile robots and manipulators, redundancy resolution techniques, industrial automation and performance analysis of mobile manipulators.
Nariman Sepehri is a professor with the Department of Mechanical and Manufacturing Engineering, at the University of Manitoba, Canada. He received M.Sc. and Ph.D. degrees from the University of British Columbia, Canada. His research and development activities are primarily centered in all fluid power related aspects of systems, manipulation, diagnosis and control. He has developed undergraduate courses on “Mechatronics Systems Design” and “Industrial Process Control” as well as graduate-level courses on ”System Design for Robots and Teleoperators Systems” and “Modeling and Simulations”.
45 H. Ghorabi received the B.Sc. degree form Isfahan University of Technology, the M.Sc. from Iran University of Science and Technology, Iran in Mechanical Engineering.
He is currently with the Mechanical Engineering department at Islamic Azad University, Saveh Branch. He is also the PhD student at Islamic Azad University, Science and Research Branch. His current research interests include dynamic structural analysis and stress analysis methods.
A. Maddahi received his B.Sc. degree in Mechanical Engineering from Amir Kabir University of Technology (Tehran Polytechnic) and now is the graduate student in Mechanical Engineering at K. N. Toosi University of Technology, Tehran, Iran. His current research is in the area of control of robotic systems, test and calibration of mobile robots and improvement of industrial robotic manipulators.