UNIVERSITI TEKNOLOGI MALAYSIA BORANG PENGESAHAN
LAPORAN AKHIR PENYELIDIKAN
TAJUK PROJEK : THE EFFECT OF CATALYST ON SOIL STABILIZATION BY
APPLICATION OF LIME
PROF. DR KHAIRUL ANUAR B. KASSIM
Saya _______________________________________________________________________ (HURUF BESAR)
Mengaku membenarkan Laporan Akhir Penyelidikan ini disimpan di Perpustakaan Universiti Teknologi Malaysia dengan syarat-syarat kegunaan seperti berikut :
1. Laporan Akhir Penyelidikan ini adalah hakmilik Universiti Teknologi Malaysia.
2. Perpustakaan Universiti Teknologi Malaysia dibenarkan membuat salinan untuk tujuan rujukan sahaja.
3. Perpustakaan dibenarkan membuat penjualan salinan Laporan Akhir Penyelidikan ini bagi kategori TIDAK TERHAD.
4. * Sila tandakan ( / )
SULIT (Mengandungi maklumat yang berdarjah keselamatan atau Kepentingan Malaysia seperti yang termaktub di dalam
AKTA RAHSIA RASMI 1972).
TERHAD (Mengandungi maklumat TERHAD yang telah ditentukan oleh Organisasi/badan di mana penyelidikan dijalankan).
TIDAK
TERHAD
TANDATANGAN KETUA PENYELIDIK
Nama & Cop Ketua Penyelidik
Tarikh : _________________
CATATAN : * Jika Laporan Akhir Penyelidikan ini SULIT atau TERHAD, sila lampirkan surat daripada pihak
VOT 78104
THE EFFECT OF CATALYST ON SOIL STABILIZATION
BY APPLICATION OF LIME
(KESAN MANGKIN TERHADAP PENSTABILAN TANAH
DENGAN APLIKASI KAPUR)
KHAIRUL ANUAR BIN KASSIM
RESEARCH VOTE NO: 78104
Department of Geotechnics and Transportation Faculty of Civil Engineering
Universiti Teknologi Malaysia
ACKNOWLEDGEMENT
I would like to thank my friends and my research assistance for their hard working and sharing of knowledge in making this project a successful research. This
fundamental research is believed able to provide knowledge on lime stabilization to the civil engineering communities.
ABSTRACT
THE EFFECT OF CATALYST ON SOIL STABILIZATION BY APPLICATION OF LIME
(Keyword: lime stabilization, kaolinite, zeolite)
Soft cohesive clays are normally associated with large settlements and low strength. Various techniques are available to reduce the problem. One of the low cost techniques is to modify the soil with lime in-situ to make it workable for construction and allow it to increase in strength by pozzolanic reactions between lime and clay minerals. The addition of lime to a soil has a pronounced effect on its physical and chemical properties. It is known to be an effective stabilization method for clayey soil. However, due to the variation of soil minerals and clay fraction, the degree of pozzolanic reactions varies. Addition of catalyst i.e. zeolite may improve the performance of lime stabilization. There are two types of zeolites which are natural zeolite and synthetic zeolite. A series of laboratory tests has been carried out to investigate the effect of zeolite on the performance of lime stabilization. Unconfined Compressive Test on 36 sets of samples has been carried out for 0,7,14, 28 and 56 days of curing. The addition of synthetic zeolite in lime-kaolin stabilized soil has increased the soil strength by 255% at 56 days curing period at the design mix of kaolin + 6% lime +15% zeolite. The higher value of UCS indicates that zeolite is an effective catalyst to enhance lime stabilization.
Key researcher:
Prof. Dr. Khairul Anuar bin Kassim
E-mail : [email protected] Tel. No. : 07-5531504
ABSTRAK
KESAN MANGKIN TERHADAP PENSTABILAN TANAH DENGAN APLIKASI KAPUR
(Kata Kunci: penstabilan kapur, kaolinite, zeolite)
TABLE OF CONTENT
CHAPTER TITLE PAGE
ACKNOWLEDGEMENT iii
ABSTRACT iv
ABSTRAK v
TABLE OF CONTENT vi
LIST OF TABLES ix
LIST OF FIGURES x
LIST OF APPENDICES xii
1 INTRODUCTION
1.1 Research Background 1
1.2 Problem Statement 2
1.3 Objectives 3
1.4 Scope of Study 3
2 LITERATURE REVIEW
2.1 Fundamental of Soil Behaviour 4
2.2 Clay 4
2.3 Kaolinite 5
2.4 Lime Stabilization 7
2.4.1 Introduction 7
2.4.2 Effect of Lime on Soil 8
2.4.4 Factors that control the Hardening 10 Characteristic of Lime Treated Clay
2.4.5 Effect of Sulphate in Soil-Lime Reaction 12
2.5 Zeolite 13
2.5.1 Types of Zeolite 15
2.5.2 Influence of Zeolite Additives 16
3 METHODOLOGY
3.1 Introduction 18
3.2 Soil Classification Test 20
3.2.1 Specific Gravity 20
3.2.2 Particle Size Distribution 21
3.2.2.1Sieve Analysis 21
3.2.2.2Hydrometer Analysis 22
3.2.3 Atterberg Limit 23
3.2.3.1Plastic Limit 23
3.2.3.2Liquid Limit 24
3.2.3.3Plasticity Index 24
3.2.4 Standard Proctor Compaction Test 25
3.3 Lime Test 26
3.3.1 Initial Consumption of Lime 26
3.3.2 Available Lime Content 27
3.4 Unconfined Compression Test 27
4 RESULTS AND DISCUSSION
4.1 Introduction 29
4.2 Soil Classification 29
4.2.1 Specific Gravity 29
4.2.2 Atterberg Limit 30
4.2.3 Particle Size Distribution 32
4.3.1 Initial Consumption of Lime 35
4.3.2 Available Lime Content 36
4.4 Standard Proctor Compaction Test 35
4.5 Unconfined Compression Test 38
5 CONCLUSION 42
REFERENCES 44
LIST OF TABLES
TABLE NO. TITLE PAGE
2.1 Identification of Kaolinite (Klain and 7
Cornelis, 1985)
4.1 Summary of data for Specific Gravity 30
4.2 Initial Consumption of Lime Test Data 35
4.3 Compaction Test Result 37
LIST OF FIGURES
FIGURE NO. TITLE PAGE
2.1 Schematic Diagram of Kaolinite Structure 6
2.2 Kaolinite 6
2.3 Reaction mechanism involved in the hardening 13 effect of improved soil (after Rajasekaran, 2005)
2.4 Zeolite 15
2.5 Zeolite Framework Model (view along cleavage 15 plane of crystals plates)
3.1 Methodology Flow Chart 19
3.2 Specific Gravity Vacuum 20
3.3 A set of sieves 21
3.4 Mechanical Shaker 22
3.5 Hydrometer reading 22
3.6 Plastic Limit Test 23
3.7 Liquid Limit Test 24
4.1 Summary of data for Specific Gravity 31
4.2 Plasticity chart: British System (BS5930: 1999) 32
4.3 Compaction Test Result 34
4.4 Unconfined Compressive Test Result 39
4.5 Strength percentage increase in soil 40 + 6% Lime + 5% Zeolite compared with
4.6 Strength percentage increase in soil 41 + 6% Lime + 10% Zeolite compared with
soil + 6% Lime stabilization
4.7 Strength percentage increase in soil 41 + 6% Lime + 15% Zeolite compared with
LIST OF APPENDICES
APPENDIX TITLE PAGE
A1 Atterberg Limit 48
A2 Particle Size Distribution 50
B1 Compaction Test Results (Part I – Data Tables) 55
B2 Compaction Test Results (Part II – Graph Plot) 63
C1 Unconfined Compression Strength (0 day) 68
C2 Unconfined Compression Strength (7 days) 76
C3 Unconfined Compression Strength (14 days) 84
C4 Unconfined Compression Strength (28 days) 92
CHAPTER 1
INTRODUCTION
1.1 Research Background
Soil stabilization using lime or cement has long been used to improve the handling and mechanical characteristics of soils for civil engineering purposes (Sherwood, 1993). Stabilization must then be considered as having both a physical and aspect involving changes to the mechanical properties of the material, and a chemical aspect involving changes to the form and mobility of the contaminants present. The creation of full lime stabilization requires a significant percentage of lime to be added to and mixed with the clay, an adequate understanding of the reaction processes and a good knowledge of the compaction process. It thus requires careful design and close attention to detail during the construction process in order to ensure that the long-term benefits are achieved.
between lime and soil minerals. The main effect of this reaction is an increasing of shear strength and bearing capacity of the soils.
Soil can be stabilized by the addition of small percentages, by weight, of lime, thereby enhancing many of the engineering properties of the soil and producing an improved construction material. Nowdays, there is a lot of discussion concerning the pozzolanic activity of natural zeolite. Zeolite tuffs have been widely used, as mixtures with lime, in construction since Roman times. Zeolitized tuffs displays excellent pozzolanic activity. This behavior has been exploited, unconsciously, since at least at the beginning of this century.
1.2 Problem Statement
1.3 Objectives
Generally, the objectives of this study are:
i. To investigate the effectiveness of lime-zeolite in stabilizing soil.
ii. To establish the optimum mix of lime and zeolite additives for effective soil stabilization.
iii. To compare two types of zeolite for effective stabilization.
1.4 Scope of The Study
CHAPTER 2
LITERATURE REVIEW
2.1 Fundamental of Soil Behavior
In geotechnical field, an engineer will works with soil which consist of the entire thickness of the earth crust. All soil are natural aggregate of mineral grains which can be separated by gentle agitation in water. Soil grains are separately by size into four general classifications: gravel, sand, silt, and clay. Gravel and sand are referred to as coarse grained soil, while silt and clay are referred to as fine grained soils. In their natural state soil masses are rarely homogeneous and contain both coarse and fine grained fractions. Such soils are referred to as mixed grained. Mineralogy is the primary factor controlling the size, shape, physical and chemical properties of soil particles.
2.2 Clay
This gives rise to a considerable range of characteristics within the overall family of clays. Clays are subdivided, therefore, into several groups that differentiate one clay type from another. From the geotechnical engineering viewpoint, clay is a kind of cohesive soil which is very weak and its strength will decrease by influence of climate or water content in the soil.
The solid phase of soil may contain various amounts of crystalline clay and nonclay minerals, noncrystalline clay mineral, organic matter, and precipitated salts. The crystalline minerals comprise the greatest proportion in most soil encountered in engineering practice, and the amount of nonclay material usually exceeds the amount of clay. Nonetheless, clay and organic matter in a soil usually influence properties in a manner far greater than their abundance.
Silicates (feldspars), oxides (silica and iron), carbonates (calcium and magnesium), and sulphates (calcium) are the common minerals of clay. The mineralogical composition of clays range from kaolins (made up of individual particles which cannot be readily divided, through illites to montmorillonites and other non-sheet-clay minerals (T.S Nagaraj & Norihiko Miuro, 2001). Kaolins made up of individual particles which cannot be readily divided. Illite is another important constituents of clay soils which have a crystal structure similar to the mica minerals but with less potassium; thus they are chemically much more active than other mica (Robert D. Holtz, 1981).
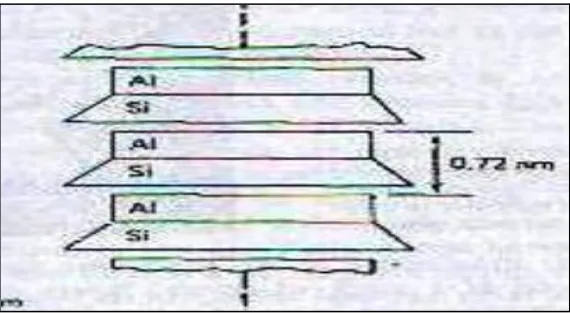
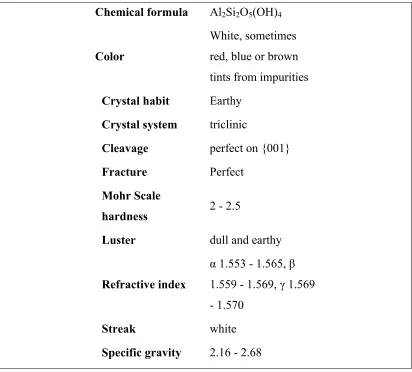
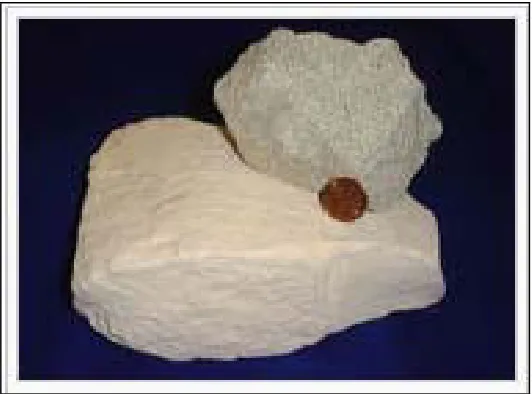
2.3 Kaolinite
known as china clay or kaolin. Kaolinite has a low shrink-swell capacity and a low cation exchange capacity (1-15 meq/100g.) It is a soft, earthy, usually white mineral (dioctahedral phyllosilicate clay), produced by the chemical weathering of aluminium silicate minerals like feldspar. In many parts of the world, it is colored pink-orange-red by iron oxide, giving it a distinct rust hue. Lighter concentrations yield white, yellow or light orange colours.
Figure 2.1: Schematic diagram of kaolinite structure
Chemical formula Al2Si2O5(OH)4
Color
White, sometimes red, blue or brown tints from impurities
Crystal habit Earthy
Crystal system triclinic
Cleavage perfect on {001}
Fracture Perfect
Mohr Scale
hardness 2 - 2.5
Luster dull and earthy
Refractive index
α 1.553 - 1.565, β
1.559 - 1.569, γ1.569 - 1.570
Streak white
Specific gravity 2.16 - 2.68
Table 2.1 : Identification of kaolinite (Klain and Cornelis, 1985)
2.4 Lime Stabilization
2.4.1 Introduction
(slake or hydrated lime). Lime was first used as a stabilizing agent of soil in modern construction practice in 1924 on short stretches of highway strengthened by the addition of hydrated lime (Bell, 1996). The use of lime, as chemical additives is to improve soil properties as to dry, modify and stabilize soil. It is a well established construction technique. The stabilizing effects depends on the reaction between lime and the clay minerals. By using lime for soil stabilization, a number of benefits are obvious such as an increase in the shear strength and bearing capacity of the soil, a reduction in the susceptibility to swelling and shrinkage, an improvement in the resistant to bad weather and reduce the moisture content in order to improve the workability and compaction characteristics.
2.4.2 Effect of lime on soil
Lime has a number of effects when added into soil, which can be generally categorized as soil drying, soil modification and soil stabilization.
i. Soil drying is a rapid decrease in soil moisture content due to the chemical reaction between water and quicklime and the addition of dry material into a moist soil.
ii. Modification effects include reduction in soil plasticity, increase in optimum moisture content, decrease in maximum dry density, improved compactibility, reduction of the soil’s capacity to swell and shrink, and improved strength and stability after compaction.
and thawing and prolonged soaking. Lime stabilization occurs over a longer time period of “curing”.
2.4.3 Mechanism of Lime Stabilization
Three mainly reactions which give a major strength gain of lime treated clay are dehydration of soil, ion exchange and flocculation, and pozzolanic reaction. Mechanisms such as carbonation only cause minor strength increase of soil and can be neglected. The use of lime as a natural stabilizing agent for clay will produce a binder by slow chemical reactions mainly with silicates in the clay mineral (Broms, 1984). Ca(OH)2 formed due to hydration process when lime (CaO) is added to soil (Koslanant, Onitsuka & Negami, 2006). During the hydration process, larger amount of pore water evaporates because of the heavy heat release induced by an increase of temperature (Miura & Balasubramaniam, 2002).
Moreover in order to make the ion exchange possible between calcium ions of hydrated lime and the alkali ions of the clay minerals, water left after evaporation must be sufficiently enough. Therefore, it is vital to know that water content of the base clay enough. An exchange of ions between clay minerals and lime depends on cation exchange capacities (i.e. concentration of calcium ions) which highly depend on the pH of the soil water and the type of clay mineral. Based on Bergado (2002) montmorillonites have the highest capacity compared to illite and kaolinite. Hence, lime will caused clay to flocculate thus make the clay plasticity reduced and making it more workable as well as increased its strength (Koslanant, Onitsuka & Negami, 2006). The results in the flocculation of the clay particles is caused by dissociated
bivalent calcium ions in the pore water replacing univalent alkali ions that normally attracted to the negatively charged clay particles.
New compounds such as calcium silicate hydrate and calcium alluminate hydrates gels are formed as a result of pozzolanic reactions in which subsequently crystallize to bind the structure together (Rogers & Glendinning, 1997). These reactions take places as hydroxyl ions released from the lime which in turn dissolved silica and alumina from the clay minerals.
2.4.4 Factors Controlled the Hardening Characteristics of Lime Treated Clay
i. Type of Lime:
As mentioned previously, quicklime is generally more effective than hydrated lime. However it needs care in handling for soils with high moisture contents. Therefore the used of hydrated lime become necessary because it poses much less of storage problem as it is no longer so susceptible to humidity (O.G.Ingles, 1972). Furthermore, hydrated lime is recommended for organic soils in order to gain the strength of that particular soil (Moseley & Kirsch, 2005). This is because; the reaction of the organic material will reduce the pH and the pozzolanic reactions.
Ca++ + Clay Ca++ exchanged with monovalent ions (K+, Na+ )
ii. Optimum Lime Content:
Note, the strength of soil will increase as the lime content is increased. However, until a certain level, the rate of increase then diminishes until no further strength gain occurs. For a particular condition of curing time and soil type, there is a corresponding optimum lime content which causes the maximum strength increase (Balasubramaniam, 2002).
iii. Lime Fixation Point:
The lime fixation point or can also referred as the “lime retention point”. This is explained by the point at which the percentage of lime is such that additional increments of lime remain constant in the plastic limit. Even though at this point, soil will generally contribute to the improvement in soil workability, but strength of soil results no increases (Bergado, Anderson, Miura, Balasubramaniam, 2002).
iv. Curing Time:
In almost all the other cases the length of time involved in curing generally rise in strength with increasing length of curing time. Based on research done by Bell (1996), the most notable increases in strength occur within the first 7 days when pozzolanic reactions are more active.
v. Type of Soil:
For lime treatment to be successful, the shear strength of the clay soil is highly dependent on pozzolanic reactions due to reactions of lime with the silicates and aluminates in the soil.
vi. Soil pH:
minimum pH of approximately 10.5 is necessary for pozzolanic reaction to take place. The high alkaline environment promotes the dissolution of silica and alumina from the clay particles.
vii. Curing Temperature:
The influence of curing temperature on the development of strength is favored by a high temperature (George, Ponniah & little, 1992). The favorable effect of high curing temperature is due to the increased solubility of the silicates and aluminates in the clay (Bergado, Anderson, Miura, Balasubramaniam, 2002).
2.4.5 Effect Of Sulphate in Soil-Lime Reactions
It is important to know that the presence of sulphates either in ground or mixing water may affect the cation exchange and pozzolanic reactions of lime treated soil systems (Rajasekaran, 2005). The atterberg limits and compaction characteristics of lime treated clay will be influenced by the reaction of cation exchange. This is due to the broken bonds f soil particle edges and unbalanced ionic substitution within the clay mineral lattice result in increasing negative cahtges of soil system.
Figure 2.3: Reaction mechanisms involved in the hardening effect of improved soil (after Rajasekaran, 2005)
2.5 Zeolite
only those of appropriate molecular size to fit into the pores are admitted creating the "sieving" property.
One important property of zeolite is the ability to exchange cations. This is the trading of one charged ion for another on the crystal. One measure of this property is the cation exchange capacity (CEC). Zeolites have high CEC's, arising during the formation of the zeolite from the substitution of an aluminum ion for a silicon ion in a portion of the silicate framework (tetrahedral units that make up the zeolite crystal).
When developing applications for zeolites, it is important to remember that not all of these minerals are the same. It is critical to understand how zeolites differ so that only the appropriate types and source materials are selected for each application. There are nearly 50 different types of zeolites (clinoptilolite, chabazite, phillipsite, mordenite, etc.) with varying physical and chemical properties.
Figure 2.4: Zeolite
Figure 2.5: Zeolite framework model (view along cleavage plane of crystals plates)
2.5.1 Types of zeolite
Naturally occurring zeolites are rarely pure and are contaminated to varying degrees by other minerals, metals, quartz, or other zeolites. For this reason, naturally occurring zeolites are excluded from many important commercial applications where uniformity and purity are essential.
There are several types of synthetic zeolites that form by a process of slow crystallization of a silica-alumina gel in the presence of alkalis and organic templates. One of the important processes used to carry out zeolite synthesis is sol-gel processing. The product properties depend on reaction mixture composition, pH of the system, operating temperature, pre-reaction 'seeding' time, reaction time as well as the templates used. In sol-gel process, other elements (metals, metal oxides) can be easily incorporated. The silicalite sol formed by the hydrothermal method is very stable. Also the ease of scaling up this process makes it a favorite route for zeolite synthesis.
Synthetic zeolites hold some key advantages over their natural analogs. The synthetics can, of course, be manufactured in a uniform, phase-pure state. It is also possible to manufacture desirable zeolite structures which do not appear in nature. Zeolite A is a well-known example. Since the principal raw materials used to manufacture zeolites are silica and alumina, which are among the most abundant mineral components on earth, the potential to supply zeolites is virtually unlimited. Finally, zeolite manufacturing processes engineered by man require significantly less time than the 50 to 50,000 years prescribed by nature. Disadvantages include the inability to create crystals with dimensions of a comparable size to their natural counterparts.
2.5.2 Influence of Zeolite Additives
to increase the strength of soil. A pozzolan is a material which, when combined with calcium hydroxide, exhibits cementitious properties. Pozzolans are primarily vitreous siliceous materials which react with calcium hydroxide to form calcium silicates; other cementitious materials may also be formed depending on the constituents of the pozzolan.
A pozzolan is a siliceous or aluminosiliceous material(such as zeolite), which is highly vitreous. This material independently has few/fewer cementitious properties, but in the presence of a lime-rich medium like calcium hydroxide, shows better cementitious properties towards the later day strength (> 28 days). The mechanism for this display of strength is the reaction of silicates with lime to form secondary cementitious phases (calcium silicate hydrates with a lower C/S ratio) which display gradual strengthening properties usually after 7 days.The extent of the strength development depends upon the chemical composition of the pozzolan: the greater the composition of alumina and silica along with the vitreous phase in the material, the better the pozzolanic reaction and strength display.
Many pozzolans available for use in construction today were previously seen as waste products, often ending up in landfills. Use of pozzolans can permit a decrease in the use of Portland cement when producing concrete, this is more environmentally friendly than limiting cementitiuos materials to Portland cement. As experience with using pozzolans has increased over the past 15 years, current practice may permit up to a 40 percent reduction of Portland cement used in the concrete mix when replaced with a carefully designed combination of approved pozzolans. When the mix is designed properly, concrete can utilize pozzolans without significantly reducing the final compressive strength or other performance characteristics.
CHAPTER 3
METHODOLOGY
3.1 Introduction
3.2 Soil classification tests:
soil classification tests is carried out to evaluate key soil characteristics as an initial step to determine either it is suitable for lime stabilization. The detailed explanation on each testing are as follows:
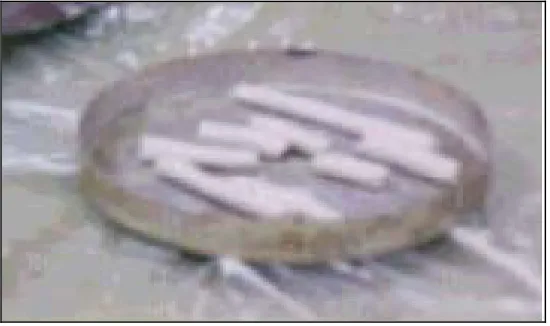
3.2.1 Specific Gravity
Based on BS1377:1990, the aim of this test is to define the average specific gravity (Gs) that useful for determining the weight-volume relationship. It is the ratio between the unit masses of soil particles and water. Determination of the volume of a mass of dry soil particles is obtained by placing the soil particles in a glass bottle filled completely with desired distilled water. The bottles and it contents are shaken (for coarse-grained soils) or placed under vacuum (for finer-grained soils) in order to remove all of the air trapped between the soil particles. Figure 3.2 shows the specific gravity vacuum.
3.2.2 Particle Size Distribution
The method to determined particle sizes distribution is defined in BS 1377: Part 2: 1990 to check that there is an adequate content of material passing 63 microns. The mixture of different particle sizes and the distribution of these sizes give very useful information about the engineering behaviors of the soil. The particle size distribution is determined by separate the particles using two processes which is sieving analysis or hydrometer analysis. Sieve analysis for particle sizes larger than 0.075mm in diameter; and hydrometer analysis for particle sizes smaller than 0.075mm in diameter are the method usually used to find size distribution of soil.
3.2.2.1Sieve Analysis:
The grain size distribution curve of soil samples is determined by passing them through a stack of sieves of decreasing mesh-opening sizes and by measuring the weight retained on each sieve. The analysis also can be performed either in wet or dry conditions. Soil with negligible amount of plastic fines, such as gravel and clean sand will analysed by dry sieving while wet sieving is applied to soils with plastic fines.
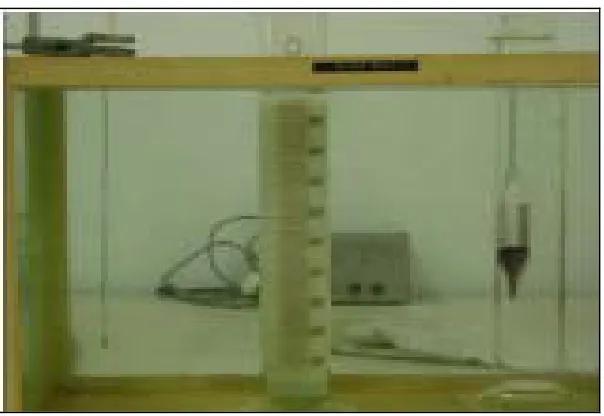
3.2.2.2Hydrometer Analysis:
Hydrometer analysis is based on the principles expressed by Stokes’ law which it is assumed that dispersed soil particles of various shapes and sizes fall in water under their own weight as non-interacting spheres.
Figure 3.4: Mechanical Shaker
3.2.3 Atterberg Limit
It is important to carry out several simple tests to describe the plasticity of clay toavoid shrinkage and cracking when fired. Atterberg limit described an amount of water contents at certain limiting or critical stages in soil behavior. If we know where the water content of our sample is relative to the Atterberg limit, that we already know a great deal about the engineering response of our sample. This test was carried out in order to determine the stiffness of clay and parameters measured are plastic limit (PL) and liquid limit (LL). The behavior of soil in term of plasticity index (PI) is determined by using this formula:
PI = LL - PL
3.2.3.1Plastic Limit
Plastic Limit represent the moisture content at which soil changes from plastic to brittle state. It is upper strength limit of consistency. Casagrande (1932) suggested that the simple method to do this test is by rolling a thread of soil on a glass plate until it crumbles at a diameter of 3 mm. Sample will reflects as wet side of the plastic limit if the thread can be rolled in diameter of below 3 mm, and the dry side if the thread breaks up and crumbles before it reaches 3 mm diameter.
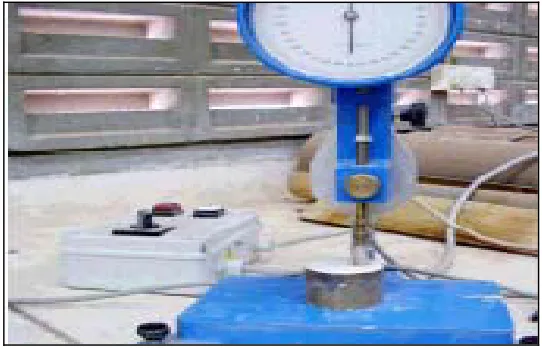
3.2.3.2Liquid Limit
Liquid limit is expressed in terms of water content as a percentage. It is essentially a measure of a constant value of a lower strength limit of viscous shearing resistance as the soil approaches the liquid state. As described in most books in soil mechanics, cone penetrometer method (BS1377: 1990) is the most reliable method for determining a liquid limit.
The equipment consists of a 30o cylindrical cone with a sharp point and a smooth polished surface. The total mass of 80 g is allowed to fall freely will penetrate a distance of 20 mm in 5 seconds from a position of points contact with further additions of distilled water and a plot of cone penetration versus moisture content is obtained. The liquid limit of the soil is taken as the moisture content at a penetration of 20 mm.
Figure 3.7: Liquid Limit test
3.2.3.3 Plasticity Index
the plastic limit (PL). Many engineering properties have been found to empirically correlate with the PI, and it is also useful engineeringclassification of fine-grained soils.
3.2.4 Standard Proctor Compaction Test
The procedure for conducting this test is described in BS 1377: Part 4: 1990. The test is carried out to measure the degree of compaction in terms of its dry unit weight. The optimum moisture content then will be determined. The principle of compaction as explained in theory is completely removed the air fraction. However in practice, compaction cannot completely eliminate the air fraction, but only reduces it as minimum as it can be.
Water will act as a softening agent when it is added to the soil particles. This situation will makes the soil particles slip over each other and move into densely packed position. After compaction, the dry unit weight is increase as the moisture content increase. However, at certain level of moisture content, any increase in the moisture tends to reduces the dry unit weight of soil. This is the results of water that takes up spaces that would have been occupied by the solid particles. Optimum moisture content (OMC) then is referred to the moisture content at which the maximum dry density (MDD) is attained.
At least five density values are needed before the optimum moisture content is obtained. The dry density of the soil is calculated and plotted versus moisture. Instead to know the OMC and MDD of soil, the determination of OMC and MDD also necessary to get after lime has been added to the soil. This is because adding lime will change the soil’s OMC and MDD.
3.3 Lime Test
Similarly with soil, lime also need to be tested in order to check their suitability when react with soil. The appropriate and adequate amount of lime should be determined before stabilization process commerce. There are two test commonly performed on lime which is initial consumption of lime (ICL) and available lime content (ALC).
3.3.1 Initial Consumption of Lime (ICL)
This test give an indication of the initial amount of lime needed to achieve sufficient lime should be added to a soil to ensure that a pH of 12.4. The purpose of this test is to evaluate an initial step to determine if it is suitable for lime stabilization. This value plays an important role in order to sustain the strength producing lime-soil pozzolanic reactions. Details procedure explained in BS1924: Part2: Clause 5.4.
3.3.2 Available Lime Content (ALC)
The available lime content either quicklime or hydrated lime is determined based on BS6463: Part 2: Test 20. The present of calcium oxide or calcium hydroxide is made by shaking them with a solution of sucrose. The solution is titrated against standard hydrochloride acid after the residue has been filtered off. Phenolphthalein is used as indicator in the titration. The formulae for indicator to be used are as follow:
Percentage available lime (as CaO) = 2.8045 V / m Percentage available lime (as Ca(OH)2) = 3.705 V / m
Where,
V = the titration (mL) M = mass of sample (mg)
3.4 Unconfined Compression Test
The clay in all cases was oven-dried to obtain its initial dry weight after mixing with the required amount of water at optimum moisture content and its respective percentage of hydrated lime. Zero percentage of lime tests refer to investigation not longer than 1 hour after addition of water.
to zero. Clay specimen will be tested until failure when an axial load is applied rapidly to the specimen. At failure, the total minor principal stress is zero while the total major principal stress is σ1.
CHAPTER 4
RESULTS AND DISCUSSION
4.1 Introduction
The earth is geologically and geotechnically complex, not only in its interior but also in its surface. Wide variability in the kinds and properties of the soils of engineering concern must be anticipated. The studies aim to develop basic design concept of mix design for the effectiveness of catalyst addition in lime stabilization. Principle of geotechnical engineering, chemistry and physical enable knowledge to be integrated for needs and practices of civil engineering. This chapter presented the results and discussion for the studies aims.
4.2 Soil Classification
4.2.1 Specific Gravity
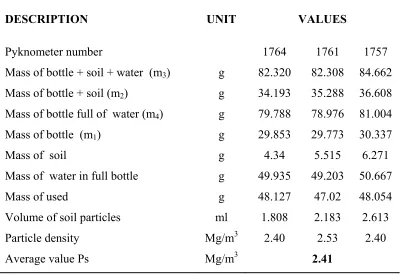
soil particles and water. Based on the table below, the average value of specific gravity is 2.41.
Table 4.1: Summary of data for specific gravity
DESCRIPTION UNIT VALUES
Pyknometer number 1764 1761 1757
Mass of bottle + soil + water (m3) g 82.320 82.308 84.662
Mass of bottle + soil (m2) g 34.193 35.288 36.608
Mass of bottle full of water (m4) g 79.788 78.976 81.004
Mass of bottle (m1) g 29.853 29.773 30.337
Mass of soil g 4.34 5.515 6.271
Mass of water in full bottle g 49.935 49.203 50.667
Mass of used g 48.127 47.02 48.054
Volume of soil particles ml 1.808 2.183 2.613
Particle density Mg/m3 2.40 2.53 2.40
Average value Ps Mg/m3 2.41
4.2.2 Atterberg Limit
Figure 4.1: Cone Penetration vs Moisture Content
The result of plastic limit (PL) which represent the moisture content at which soil changes from plastic to brittle state is 23.7% determine from oven-dried sample. Plasticity Index (PI) is defined as a range of water content where the soil is plastic. Therefore it is a numerically equal to the difference between the liquid limit (LL) and the plastic limit (PL). The plasticity index of the soil is evaluated as the calculation below.
PI = LL - PL = 44.2 - 23.7 = 20.5%
Figure 4.2: Plasticity chart: British System (BS5930: 1999)
4.2.3 Particle Size Distribution
Soils are primarily classified on the basis of particle size. Each of the particles considered will therefore fall into a prescribed size range and will form a soil that is represented by dominant particle size. Particle size is an easy parameter to measure and controls many aspect of the engineering behavior of a soil. Sand and gravel are cohesionless particles that posses no inter-particle bond. Clay and silts are usually cohesive (Pitts, 1984).
4.3 Lime Test
4.3.1 Initial Consumption of Lime (ICL)
Lime used in this study is hydrated lime, Ca(OH)2. Inspection of the lime quality used in this investigation is essential as it determines the effectiveness of lime modification and stabilization. Standard means of specifying the content of lime should be used. Initial consumption of Lime (ICL) test indicating that the initial amount of lime needed to achieve sufficient lime should be added to a soil to ensure that a pH of 12.4. Table 4.2 shows the initial consumption of lime data.
Calcium
hydroxide
Lime used in test
pH of saturated solution 13.24
13.21
Temperature (oC) 26.4
26.5
pH corrected to 25 oC 13.28
13.26
Table 4.2: Initial Consumption of Lime test data
DESCRIPTION VALUES
Lime content % 0 1 2 3 4 5
pH value of suspension
6.77 12.79 13.09 13.09 13.14 13.16
Temperature oC 25.2 25.2 25.1 25.1 25 25.3
pH corrected to 25 oC
From the data attained, 2.0% of hydrated lime is the minimum percentage of lime needed for soil stabilization. This value plays an important role in order to sustain the strength producing lime-soil pozzolanic reaction.
4.3.2 Available Lime Content (ALC)
From the laboratory test: The titration, V = 33.4 mL
The weight of sample used, m = 1.445 g
Percentage of available lime (as CaO) = 2.804 V / m = [2.804(33.4)] / 1.445
= 64.8 %
Percentage of available lime (as Ca(OH2)) = 3.705 V / m = [3.705(33.4) / 1.445]
= 85.6 %
The available lime content in terms of equivalent CaO is 64.8%, which is greater than the minimum requirement of 60%. The available Ca(OH)2 content is 85.6% which is greater than minimum requirement of 80%. Therefore, the hydrated lime that used in this research is suitable for lime stabilization.
4.4 Standard Proctor Compaction Test
concentration. The calculation and compaction curves for all of the samples tested are enclosed in Appendix B.
Table 4.3: Compaction Test Result
SAMPLE COMPACTION
MDD (Mg/m3)
OMC (%)
Kaolin 1.600 20.0
Kaolin + 6% Lime 1.545 22.7
Kaolin + 6% Lime + 5% Zeolite A 1.583 22.0
Kaolin + 6% Lime +10% Zeolite A 1.490 21.6
Kaolin + 6% Lime +15% Zeolite A 1.482 24.3
Kaolin + 6% Lime + 5% Zeolite B 1.502 21.9
Kaolin + 6% Lime +10% Zeolite B 1.480 23.3
Kaolin + 6% Lime +15% Zeolite B 1.480 22.7
4.5 Unconfined Compressive Strength (UCS)
The calculation of the data from unconfined compressive test (UCT) and charts of axial stress versus strain for each concentration at different curing period are shown in appendix D. Table 4.4 shows the summary of the strength result obtained from all of the samples at different curing period.
Table 4.4: Unconfined Compressive Test Result
DESCRIPTION UCS (kPa)
Curing period (days) 0 7 14 28 56
Kaolin 215 192 190 208 228
Kaolin + 6% Lime 364 408 485 717 926
Kaolin + 6% Lime + 5% Zeolite A 306 478 440 557 924
Kaolin + 6% Lime + 10% Zeolite A 194 371 670 906 1481
Kaolin + 6% Lime + 15% Zeolite A 199 373 875 1028 3288
Kaolin + 6% Lime + 5% Zeolite B 271 251 452 567 982
Kaolin + 6% Lime +10% Zeolite B 193 253 480 628 797
The unconfined compressive strength (UCS) of kaolin-lime with various percentages of zeolite addition at different days of curing period (0, 7, 14, 28 and 56 days) was summarized in Figure 4.4. The sufficient amount of hydrated lime and longer curing period especially after 56 days give a significant effect on UCS. The gain of UCS pattern shows different value with different type of zeolite and it is much dependent on the properties of the zeolite and the mixture reaction. Figure 4.4 shows the strength increases with time but before day 14, the mixture is going through modification process where the flocculation and rearrangement of soil particle provide instability of the mixture. After day 28, the mixture is almost reach the stable condition.
Figure 4.4: Unconfined Compressive Strength Result
The percentage of strength increases are shown in Figure 4.5, Figure 4.6 and Figure 4.7 for percentage increase in comparison between lime stabilization and lime stabilization with zeolite additive. Form the graphs, it can be conclude that a small addition of zeolite does not effective in improving lime stabilization. This is due to the unsufficient minerals to react and to bond the lime and zeolite minerals. However, when the percentage of zeolite is increase, the strength tends to be higher and it is really effective in enhancing lime stabilization. It required cementations to bridging between the particle and this resulted to higher strength to the mixture.
Figure 4.6: Strength percentage increase in soil + 6% lime + 10% zeolite compared with soil + 6% lime stabilization
CHAPTER 5
CONCLUSION
The physical and geochemistry results of the lime treated and untreated soils were presented. Based on the laboratory results, the following summary has been drawn:
i. Basic physical and geochemistry properties of kaolin such as specific gravity, Atterberg limit, particle size distribution, soil classification, initial consumption of lime (ICL), available lime content (ALC), optimum moisture content (OMC), and maximum dry density (MDD) in this studies were summarized in Appendix A and Appendix B. Based on the results of soil classification test, the soil is classified into fine-grained soil that consists of 81.17% of fine materials. As the amount of clay content more than 10% thus this soil is suitable to be stabilized with lime.
iii. Maximum dry density (MDD) and optimum dry density (OMC) were different between untreated sample and treated sample with lime and various content of zeolite. The reduction in dry density could be due to the flocculation and agglomeration effect of soil particles which reduce compactibility and hence the density of the treated soil. The OMC generally increases with addition of lime and zeolite compared to the unstabilised soil. This is due to the higher consumption of water for the reaction to take place.
REFERENCES
Aminaton Marto and Novrial, (1999). The Effect of Lime-Soil Cylinders on Laterite Slope Model. Fifth Geotechnical Engineering Conference (Geotropika 99), pp 223-233.
British Standard Institution, (1990). Soils for Civil Engineering Purposes. London: (BS 1377: Part 1)
British Standard Institution, (1990). Soils for Civil Engineering Purposes. London: (BS 1377: Part 2)
British Standard Institution, (1990). Soils for Civil Engineering Purposes. London: (BS 1377: Part 3)
British Standard Institution, (1990). Soils for Civil Engineering Purposes. London: (BS 1377: Part 4)
British Standard Institution, (1990). Stabilized Materials for Civil Engineering Purposes. London: (BS 1924: Part 1)
British Standard Institution, (1990). Stabilized Materials for Civil Engineering Purposes. London: (BS1924: Part 2)
C. D. F Rogers and S. Glendinning, (1997). Improvement of clay soils in situ using lime piles in the UK. Journal of Engineering Geology, Vol. 42, pp 243-257.
Cheng Liu and Jack B. Evett, (2003). Soil Properties: Testing, Measurement and Evaluation, fifth Edition, New Jersey: Pearson Education Inc, 423p.
Chester I Duncan, Jr. (1998). Soils and Foundations For Architects And Engineers. South America: Kluwer Academic Publisher, 403p.
F.G Bell (1996). Lime Stabilization of Clay Minerals and Soils. Journal of Engineering Geology, Vol. 42, pp. 223-227.
G. Rajasekaran and S. Narasimha Rao, (2000). Compressibility behaviour of lime treated marine clay. Journal of Ocean engineering, Vol. 29, pp 545-559.
H.R Thomas, J.D McKinley, J.M Reid and K.P William, (2001). Chemical Analysis of Contaminated Soil Strengthened by the addition of Lime. Journal of Engineering Geology, Vol. 60, pp. 181-192.
James K.Mitchell, (1993). Fundamentals Of Soil Behaviour. New York: John Wiley & Sons, Inc, 437p.
J. M Reid and A. H Brookes, (1999). Investigation of Lime Stabilized Contaminated Material. Journal of Engineering Geology, Vol. 53, pp 217-231.
Khairul Anuar Kassim and Kok Chai Kern, (2004). Lime Stabilized Malaysian Cohesive Soils. Journal of Civil Engineering, Vol. 16, pp 13-23.
Khairul Anuar Kassim and Kok Chai Kern, (1999). Mix For Lime Modification of
Malaysian Cohesive Soils. Fifth Geotechnical Engineering Conference (Geotropika 99), pp 235-244.
N.O. Attoh-Okine (1995). Lime Treatment of Laterite Soils and Gravels-revisited. Journal of Construction and Building Material, Vol. 9, No. 5, pp 283-287.
Raymond N. Yong and Vahid R. Ouhadi, (2006). Experimental Study on Instability of Bases on natural and lime/cement-stabilized clayey soils. Journal of Applied Clay Science, Vol. 35, pp 238-249.
Samuel Yariv and Harold Cross, (2006). Organo-Clay Complexes and Interactions. United States of America: Marcel Dekker, Inc, 688p.
S. Koslanant, K. Onitsuka and T. Negami, (2006). Influence of Salt Additive in Lime Stabilization of Organic Clay. Jouranal Of The Southeast Asian Geotechnical Society, pp 95-101.
S. Wild, J. M Kinuthia, G.I Jones and D.D Higgins, (1998). Effect of partial
Substitution of lime with ground granulated blast furnace slag (GGBS) on the strength properties of lime stabilized sulphate-bearing clay soils. Journal Of Engineering Geology, Vol. 53, pp 37-53.
Th. Perraki, G. Kakali, F. Kontaleon, (2003). The effect of natural zeolite on the
early hydration of Portland Cement. Microporous and Mesoporous Material 61, pp 205-212.
APPENDIX A
APPENDIX A1: ATTERBERG LIMIT TEST
i. Liquid Limit Test (Cone Penetration Test)
Test no. Unit
1 2 3 4 Initial dial gauge
reading
mm 0 0 0 0 0 0 0 0 0 0 0 0
Average penetration
mm 16.60 17.30 20.50 22.20
Container no. A B C D
Mass of wet soil + container
g 32.217 16.45 16.739 17.52
Mass of dry soil + container
g 30.825 14.39 14.533 15.221
Mass of container g 27.641 9.629 9.472 10.107
Mass of moisture g 1.39 2.06 2.21 2.30
Mass of dry soil g 3.18 4.76 5.06 5.11
Moisture Content % 43.72 43.27 43.59 44.96
ii. Plastic Limit Test
DESCRIPTION UNIT
Test no. 1 2 3
Container no. A B C
Mass of wet soil + container g 12.190 29.550 8.471
Mass of dry soil + container g 11.780 29.219 8.176
Mass of container g 9.968 27.916 6.904
Mass of moisture g 0.410 0.331 0.295
Mass of dry soil g 1.812 1.303 1.272
Moisture Content % 22.63 25.40 23.19
APPENDIX A2: PARTICLE SIZE DISTRIBUTION
i. Hydrometer Sidementation
Calibration and Sample Data
DESCRIPTION SYMBOL VALUE UNIT
Hydrometer no. 3328
Meniscus correction Cm 0.5
Reading in dispersant Ro' 0.5
Calibration equation Hr = 203.93-3.8345Rh
Dry mass of soil m 50 g
Particle density measured/assumed ρs 2.41 Mg/m3
Viscosity of water at 27.0 oC h 2.41 mPa.s
Pretreatment
Pretreated with Sodium Hexametaphospate & Sodium Carbonat
Initial dry mass of sample mo 50.00 g
Pretreatment loss mo - m 0.36 g
0.72 %
Calibration for Hydrometer ( No.3288 )
Mass = 66.786 g
N = 9.5 mm
h = 180 mm
Vh = 60 ml
L = 272 mm
H = N+d1, N+d2, ...N+d7
H HR Rh
d0 9.5 90.43 30
d1 27.5 108.43 25
d2 46.0 126.93 20
d3 64.5 145.43 15
d4 83.5 164.43 10
d5 102.5 183.43 5
d6 121.5 202.43 0
Test Data
Date Time 8:45:00 AM Elapsed Time t Temp T 8C Hydrometer Reading Rh' True Reading Rh'+Cm = Rh Effective Depth Hr mm Modified Reading Rh' - Ro' = Rd
h Particle Diameter
D mm
Percentage finer than D
K (%)
23.7.2009 8:45:30 AM 0:00:30 26.0 12.50 13.000 154.1 12.0 0.8748 0.076 41.32
23.7.2009 8:46:00 AM 0:01:00 26.0 12.50 13.000 154.1 12.0 0.8748 0.054 41.32
23.7.2009 8:47:00 AM 0:02:00 26.0 12.00 12.500 156.0 11.5 0.8748 0.038 39.60
23.7.2009 8:49:00 AM 0:04:00 26.0 12.00 12.500 156.0 11.5 0.8748 0.027 39.60
23.7.2009 8:53:00 AM 0:08:00 26.0 12.00 12.500 156.0 11.5 0.8748 0.019 39.60
23.7.2009 9:00:00 AM 0:15:00 26.0 10.50 11.000 161.8 10.0 0.8748 0.014 34.43
23.7.2009 9:15:00 AM 0:30:00 26.0 9.50 10.000 165.6 9.0 0.8748 0.010 30.99
23.7.2009 9:45:00 AM 1:00:00 25.5 8.50 9.000 169.4 8.0 0.884325 0.007 27.55
23.7.2009 10:45:00 AM 2:00:00 25.0 7.50 8.000 173.3 7.0 0.8941 0.005 24.10
23.7.2009 12:45:00 PM 4:00:00 24.0 6.00 6.500 179.0 5.5 0.9144 0.004 18.94
23.7.2009 4:45:00 PM 8:00:00 22.5 5.00 5.500 182.8 4.5 0.946725 0.003 15.49
i. Dry Sieving
Sieve Size (mm) Mass retained (g) Percentage retain
(%) Cumulative percentage passing (%)
5.00
0 0.00 100.00
3.35
0 0.00 100.00
2.00
0 0.00 100.00
1.18
0.044 0.98 99.02
0.60
0.121 2.69 96.33
0.425
0.051 1.14 95.20
0.300
0.076 1.69 93.51
0.212
0.109 2.43 91.09
0.150
0.189 4.20 86.89
0.063
Passing 0.063
3.645 81.16 0.01
Sieve Size (mm)
Mass passing (%) Classification
2.00
100.00
0.425
95.20 Gravel = 4.80
0.063
81.17 Sand = 14.03
0.002
11 Silt / Clay = 81.17
Silt = 70.17
APPENDIX B
RESULT OF COMPACTION TEST
APPENDIX B1: COMPACTION TESTS RESULT (PART I – DATA TABLES)
i. Kaolin
DESCRIPTION UNIT VALUES
Percentage of water addition % 14% 17% 20% 23%
Mass of the empty mould kg 3.75 3.681 3.698 3.679
soil
Mass of wet soil kg 1.784 1.924 1.967 1.864
Volume of the mould, V m3 0.001 0.001 0.001 0.001
Bulk Density Mg/m3 1.784 1.924 1.967 1.864
Dry Density Mg/m3 1.550 1.580 1.579 1.451
Mass of the empty container g 9.767 9.802 9.595 9.386
Mass of the empty cont. + wet soil
g 28.828 27.153 37.151 37.494
Mass of the empty cont. + dry soil
g 26.325 24.049 31.71 31.269
Mass of wet soil g 2.503 3.104 5.441 6.225
Mass of dry soil g 16.558 14.247 22.115 21.883
Moisture content % 15.1 21.8 24.6 28.4
Specific Gravity 2.56
Air Void Content: Mg/m3
0% Mg/m3 1.846 1.643 1.571 1.481
5% Mg/m3 1.753 1.561 1.492 1.407
10% Mg/m3 1.661 1.479 1.414 1.333
ii. Kaolin + 6% Lime
DESCRIPTION UNIT VALUES
Percentage of water addition % 17% 23% 27% 32% 35%
Mass of the empty mould kg 3.436 3.303 3.33 3.33 3.66
Mass of the empty mould + wet soil
Mass of wet soil kg 1.73 1.903 1.908 1.836 1.722
Volume of the mould, V m3 0.001 0.001 0.001 0.001 0.001
Bulk Density Mg/m3 1.73 1.903 1.908 1.836 1.722
Dry Density Mg/m3 1.478 1.555 1.511 1.393 1.282
Mass of the empty container g 9.822 9.538 10.258 9.73 6.94 Mass of the empty cont. +
wet soil
g 46.784 40.777 50.998 53.679 78.715
Mass of the empty cont. + dry soil
g 41.4 35.072 42.524 43.067 60.356
Mass of wet soil g 5.384 5.705 8.474 10.612 18.359
Mass of dry soil g 31.578 25.534 32.266 33.337 53.416
Moisture content % 17.0 22.3 26.3 31.8 34.4
Specific Gravity 2.56
Air Void Content Mg/m3
0% Mg/m3 1.782 1.629 1.531 1.411 1.362
5% Mg/m3 1.693 1.547 1.454 1.340 1.294
10% Mg/m3 1.604 1.466 1.378 1.269 1.226
iii. Kaolin + 6% Lime + 5% Zeolite A
DESCRIPTION UNIT VALUES
Percentage of water addition % 14% 17% 23% 27% 32%
iv. Kaolin +6% Lime + 10% Zeolite A
DESCRIPTION UNIT VALUES
Mass of the empty mould + wet soil
kg 4.931 5.441 5.623 5.65 5.578
Mass of wet soil kg 1.622 1.713 1.895 1.905 1.833
Volume of the mould, V m3 0.001 0.001 0.001 0.001 0.001
Bulk Density Mg/m3 1.622 1.713 1.895 1.905 1.833
Dry Density Mg/m3 1.424 1.471 1.540 1.517 1.402
Mass of the empty container g 6.927 6.947 27.812 6.797 7.014 Mass of the empty cont. +
wet soil
g 47.864 37.547 57.147 30.813 39.298
Mass of the empty cont. + dry soil
g 42.862 33.23 51.657 25.92 31.709
Mass of wet soil g 5.002 4.317 5.49 4.893 7.589
Mass of dry soil g 35.935 26.283 23.845 19.123 24.695
Moisture content % 13.9 16.4 23.0 25.6 30.7
Specific Gravity 2.56
Air Void Content Mg/m3
0% Mg/m3 1.887 1.802 1.611 1.547 1.433
5% Mg/m3 1.793 1.712 1.530 1.469 1.361
Percentage of water addition
% 14% 17% 23% 27% 32% 35%
Mass of the empty mould
kg 3.251 3.707 3.309 3.746 3.33 3.659
Mass of the empty mould + wet soil
kg 4.867 5.41 5.116 5.618 5.155 5.386
Mass of wet soil kg 1.616 1.703 1.807 1.872 1.825 1.727
Volume of the mould, V m3 0.001 0.001 0.001 0.001 0.001 0.001
Bulk Density Mg/m3 1.616 1.703 1.807 1.872 1.825 1.727
Dry Density Mg/m3 1.415 1.452 1.474 1.491 1.404 1.290
Mass of the empty container
g 10.201 6.537 9.07 18.435 18.417 9.5586
Mass of the empty cont. + wet soil
g 34.381 35.637 57.049 55.64 51.508 55.358
Mass of the empty cont. + dry soil
g 31.371 31.351 48.2 48.06 43.876 43.762
Mass of wet soil g 3.01 4.286 8.849 7.58 7.632 11.596
Mass of dry soil g 21.17 24.814 39.13 29.625 25.459 34.2034
Moisture content % 14.2 17.3 22.6 25.6 30.0 33.9
Specific Gravity 2.56
Air Void Content Mg/m3
0% Mg/m3 1.877 1.775 1.621 1.547 1.448 1.371
v. Kaolin + 6% Lime + 15% Zeolite A
DESCRIPTION UNIT VALUES
Percentage of water addition % 17% 23% 27% 32%
Mass of the empty mould kg 3.658 3.33 3.33 3.66
Mass of the empty mould + wet soil
kg 5.265 5.094 5.206 5.416
Mass of wet soil kg 1.607 1.764 1.876 1.756
Volume of the mould, V m3 0.001 0.001 0.001 0.001
Bulk Density Mg/m3 1.607 1.764 1.876 1.756
Dry Density Mg/m3 1.367 1.449 1.489 1.336
Mass of the empty container g 6.704 10.239 6.786 9.451
Mass of the empty cont. + wet soil g 37.978 40.059 36.361 47.189 Mass of the empty cont. + dry soil g 33.309 34.739 30.267 38.158
Mass of wet soil g 4.669 5.32 6.094 9.031
Mass of dry soil g 26.605 24.5 23.481 28.707
Moisture content % 17.5 21.7 26.0 31.5
Specific Gravity 2.56
Air Void Content Mg/m3
0% Mg/m3 1.766 1.645 1.538 1.418
5% Mg/m3 1.678 1.563 1.461 1.347
vi. Kaolin + 6% Lime + 5% Zeolite B
DESCRIPTION UNIT VALUES
Percentage of water addition % 17% 23% 27% 32% 35%
Mass of the empty mould kg 3.252 3.762 3.659 3.436 3.659
Mass of the empty mould + wet soil
kg 4.99 5.63 5.493 5.283 5.389
Mass of wet soil kg 1.738 1.868 1.834 1.847 1.73
Volume of the mould, V m3 0.001 0.001 0.001 0.001 0.001
Bulk Density Mg/m3 1.738 1.868 1.834 1.847 1.73
Dry Density Mg/m3 1.477 1.516 1.444 1.413 1.282
Mass of the empty container g 6.804 10.294 9.671 9.393 6.758 Mass of the empty cont. + wet
soil
g 40.301 38.752 55.816 51.726 48.501
Mass of the empty cont. + dry soil
g 35.263 33.391 46.015 41.787 37.701
Mass of wet soil g 5.038 5.361 9.801 9.939 10.8
Mass of dry soil g 28.459 23.097 36.344 32.394 30.943
Moisture content % 17.7 23.2 27.0 30.7 34.9
Specific Gravity 2.56
Air Void Content Mg/m3
0% Mg/m3 1.762 1.606 1.514 1.434 1.352
10% Mg/m3 1.585 1.445 1.363 1.290 1.217
vii. Kaolin + 6% Lime + 10% Zeolite B
DESCRIPTION UNIT VALUES
Percentage of water addition % 17% 23% 27% 32% 35%
Mass of the empty mould kg 3.707 3.667 3.762 3.436 3.211
Mass of the empty mould + wet soil
kg 5.352 5.442 5.628 5.278 5.007
Mass of wet soil kg 1.645 1.775 1.866 1.842 1.796
Volume of the mould, V m3 0.001 0.001 0.001 0.001 0.001
Bulk Density Mg/m3 1.645 1.775 1.866 1.842 1.796
Dry Density Mg/m3 1.411 1.448 1.501 1.487 1.350
Mass of the empty container g 9.503 10.289 9.122 5.622 9.625 Mass of the empty cont. + wet
soil
g 29.143 38.431 34.107 33.007 32.549
Mass of the empty cont. + dry soil
g 26.355 33.243 29.223 27.726 26.856
Mass of dry soil g 16.852 22.954 20.101 22.104 17.231
Moisture content % 16.5 22.6 24.3 23.9 33.0
Specific Gravity 2.56
Air Void Content Mg/m3
0% Mg/m3 1.798 1.622 1.578 1.588 1.387
5% Mg/m3 1.708 1.541 1.499 1.509 1.318
10% Mg/m3 1.619 1.460 1.420 1.430 1.248
viii. Kaolin + 6% Lime + 15% Zeolite B
DESCRIPTION UNIT VALUES
Percentage of water addition % 17% 23% 27% 32% 35%
Mass of the empty mould kg 3.251 3.762 3.436 3.668 3.707
Mass of the empty mould + wet soil
kg 4.9 5.561 5.333 5.448 5.505
Mass of wet soil kg 1.649 1.799 1.897 1.78 1.798
Volume of the mould, V m3 0.001 0.001 0.001 0.001 0.001
Bulk Density Mg/m3 1.649 1.799 1.897 1.78 1.798
Mass of the empty container g 9.935 7.002 9.803 9.352 9.505 Mass of the empty cont. +
wet soil
g 28.442 32.325 41.682 40.125 47.466
Mass of the empty cont. + dry soil
g 25.879 27.713 35.312 32.926 37.685
Mass of wet soil g 2.563 4.612 6.37 7.199 9.781
Mass of dry soil g 15.944 20.711 25.509 23.574 28.18
Moisture content % 16.1 22.3 25.0 30.5 34.7
Specific Gravity 2.56
Air Void Content Mg/m3
0% Mg/m3 1.814 1.631 1.562 1.437 1.356
5% Mg/m3 1.723 1.549 1.484 1.365 1.288
10% Mg/m3 1.632 1.467 1.406 1.293 1.220
APPENDIX B2: COMPACTION TESTS RESULT (PART II – GRAPH PLOT)
From the graph:
MDD = 1.600
OMC = 20.0
ii. Compaction Curve for Kaolin + 6% Lime
From the graph:
MDD = 1.545
OMC = 22.7
From the graph:
MDD = 1.583
OMC = 22.0
iv. Compaction Curve for Kaolin + 6% Lime + 10% Zeolite A
From the graph:
MDD = 1.490
OMC = 21.6
From the graph:
MDD = 1.482
OMC = 24.3
vi. Compaction Curve for Kaolin + 6% Lime + 5% Zeolite B
From the graph:
MDD = 1.502
vii. Compaction Curve for Kaolin + 6% Lime + 10% Zeolite B
From the graph:
MDD = 1.480
OMC = 23.3
viii. Compaction Curve for Kaolin + 6% Lime + 15% Zeolite B
From the graph:
MDD = 1.480
APPENDIX C
APPENDIX C1: UNCONFINED COMPRESSION STRENGTH ( 0 DAY)
i. Untreated Soil (Kaolin)
Axial Displacement, ∆ L
(mm)
Compressive Load, P (kN x 10e-3)
Strain Stress
0.0039 1.47059 0.0039 0.74897
0.2098 47.9412 0.2098 24.4163
0.4221 100.0001 0.4221 50.9296
0.6345 145.5884 0.6345 74.1476
0.8430 186.1767 0.8430 94.8190
1.3578 273.5297 1.3578 139.3076
1.8726 344.1181 1.8726 175.2579
2.3810 391.1769 2.3810 199.2248
2.8893 408.8240 2.8893 208.2124
3.4016 329.4122 3.4016 167.7682
ii. Kaolin + 6% Lime
Axial Displacement, ∆ L
(mm)
Compressive Load, P (kN x
10e-3)
Strain Stress
0.00387 0 0.0039 0
0.2256 83.8236 0.2256 42.6910
0.4512 169.1179 0.4512 86.1310
0.6703 253.8238 0.6703 129.2714
0.8765 330.2945 0.8765 168.2176
1.3831 486.7653 1.3831 247.9075
1.8948 616.1772 1.8948 313.8165
2.4104 696.4714 2.4104 354.7100
2.9131 694.1185 2.9131 353.5116
3.4159 552.3536 3.4159 281.3114
iii. Kaolin + 6% Lime + 5% Zeolite A
Axial Displacement, ∆ L
(mm)
Compressive Load, P (kN x
10e-3)
Strain Stress
0.0064 0 0.0064 0
0.2291 56.7648 0.2291 28.9101
0.4440 126.4707 0.4440 64.4110
0.6538 185.2943 0.6538 94.3696
0.8726 243.5297 0.8726 124.0287
1.3745 366.1769 1.3745 186.4924
1.8829 473.5300 1.8829 241.1668
2.3912 556.7654 2.3912 283.5583
2.8937 600.8831 2.8937 306.0272
UCS = 306 kPa
iv. Kaolin + 6% Lime + 10% Zeolite A
Axial Displacement, ∆ L
(mm)
Compressive Load, P (kN x
10e-3)
Strain Stress
0.0064 0 0.0064 0
0.2162 8.8235 0.2162 4.4938
0.4247 76.4707 0.4247 38.9462
0.6435 133.2355 0.6435 67.8563
0.8623 180.8826 0.8623 92.1227
1.3707 275.8827 1.3707 140.5059
1.8764 344.1181 1.8764 175.2579
2.3786 377.9416 2.3786 192.4841
2.8813 372.0593 2.8813 189.4882
UCS = 194 kPa
v. Kaolin + 6% Lime + 15% Zeolite A
Axial Displacement, ∆ L
(mm)
Compressive Load, P (kN x
10e-3)
Strain Stress
0.0039 0 0.0039 0
0.2162 43.5295 0.2162 22.1694
0.4286 94.1178 0.4286 47.9338
0.6371 141.1766 0.6371 71.9007
0.8533 182.3532 0.8533 92.8717
1.3578 270.0003 1.3578 137.5100
1.8636 336.1769 1.8636 171.2135
2.3784 376.4710 2.3784 191.7351
2.8837 390.5887 2.88373 198.9252
UCS = 199 kPa
vi. Kaolin + 6% Lime + 5% Zeolite B
Axial Displacement, ∆ L
(mm)
Compressive Load, P (kN x
10e-3)
Strain Stress
0.0039 0.8824 0.0039 0.4494
0.2098 14.7059 0.2098 7.4897
0.4221 58.8236 0.4221 29.9586
0.6345 144.1178 0.6345 73.3986
0.8494 214.7061 0.8494 109.3489
1.3681 352.9416 1.3681 179.7517
1.8700 455.8829 1.8700 232.1793
2.3719 517.6477 2.3719 263.6358
UCS = 271 kPa
vii. Kaolin + 6% Lime + 10% Zeolite B
Axial Displacement, ∆ L
(mm)
Compressive Load, P (kN x
10e-3)
Strain Stress
0.0039 0 0.0039 0
0.2098 14.7059 0.2098 7.4897
0.4221 91.1766 0.4221 46.4359
0.6409 141.1766 0.6409 71.9007
0.8468 185.2943 0.8468 94.3696
1.3488 276.4709 1.3488 140.8055
1.8636 346.4710 1.8636 176.4562
2.3681 379.4122 2.3681 193.2331
2.8746 367.6475 2.8746 187.2413
UCS = 193 kPa
viii. Kaolin + 6% Lime + 15% Zeolite B
Axial Displacement, ∆ L
(mm)
Compressive Load, P (kN x
10e-3)
Strain Stress
0.0064 0 0.0064 0
0.2291 70.5883 0.2291 35.9503
0.4414 117.6472 0.4414 59.9172
0.6474 161.7649 0.6474 82.3862
0.8559 205.2944 0.8559 104.5556
1.3616 290.5886 1.3616 147.9956
1.8764 342.6475 1.8764 174.5089
2.3810 355.8828 2.3810 181.2496
UCS = 181 kPa
APPENDIX C2: UNCONFINED COMPRESSION STRENGTH (7 DAYS)
i. Untreated Soil (Kaolin)
Axial Displacement, ∆ L
(mm)
Compressive Load, P (kN x
10e-3)
Strain Stress
0.1263 2.3529 0.1263 1.1983
0.3351 39.7059 0.3351 20.2221
0.5517 75.8824 0.5517 38.6466
0.7708 117.0590 0.7708 59.6176
0.9796 150.0002 0.9796 76.3945
1.4862 222.9414 1.4862 113.5431
2.5045 334.7063 2.5045 170.4645
3.0072 367.0593 3.0072 186.9417
3.5190 377.9416 3.5190 192.4841
4.0255 345.0004 4.0255 175.7073
UCS = 192 kPa
ii. Kaolin + 6% Lime
Axial Displacement, ∆ L
(mm)
Compressive Load, P (kN x
10e-3)
Strain Stress
0.0039 -0.8824 0.0039 -0.4494
0.2191 128.8237 0.2191 65.6094
0.4292 225.8826 0.4292 115.0411
0.6484 322.9416 0.6484 164.4728
0.8572 402.3534 0.8572 204.9169
1.3728 555.8830 1.3728 283.1089