THE PROPERTIES OF CONCRETE MATERIALS SUBJECTED TO IMPACT
AND SHOCK LOADING
K. Tsembelis and D.D. Radford
Analytical Methods in Fracture, Materials and Mechanics Branch, Chalk River Laboratories, AECL, Chalk River, ON, K0J 1J0, CANADA
ABSTRACT
Concrete is extensively used in the nuclear industry in order to contain the potential release of radioactive materials into the environment under certain accident scenarios. Such scenarios involve projectile impact on concrete structures, thereby exposing them to extreme loading conditions and jeopardizing their structural integrity. During such postulated events, in-material strain rates would exceed 105 per second, imposing pressures in excess of 10 GPa. Under these dynamic loading conditions, the deformation and fracture behaviour of concrete will be significantly different compared to that observed under quasi-static conditions.
This paper focuses on the experimental technique known as plate impact used to quantify extreme dynamic properties of concrete [1]. A description of the data obtained [2-5] and its use in characterizing equation-of-state and dynamic strength models will be provided together with comparison against concrete-related data from the USA, France and Germany.
INTRODUCTION
The reinforced concrete containment of nuclear power plants should perform a dual function [6]. Firstly, it should house and safely protect all the related equipment, and secondly, serve as an engineered safeguard to contain any postulated radiological consequences of a loss of coolant accident in the nuclear steam power supply. Such containments should be able to withstand a variety of loads due to different incidents such as aircraft crash, missiles of various types, explosions, etc. The September 11, 2001 attacks prompted additional investigations of aircraft impacting critical facilities, nuclear power plants representing one important category [7].
Extensive research has been performed throughout the years on the effects of various loads on the containment structures. An extensive summary of papers presented in SMiRT conferences up to 1992 is provided in [6]. In general, the response of the structure is grouped into two main areas [6]: The global response, which is usually intended for the calculation of global structural behaviour and induced equipment vibration, and local response which deals with the evaluation of penetration, cracking and non-linear deformations in the impacted region, as well as safety against punch-through.
An impact event such as an aircraft crash on a structure constitutes a coupled phenomenon and it is computationally very expensive, since the impact is a highly transient event operating on a relatively short time scale, while the structural response operates on a larger time scale. For this reason, global response is usually analysed by uncoupling the impactor from the target by assuming that a deformable (soft) projectile impacts against a, usually, un-deformable (rigid) structure [6]. During that analysis, the impact load is converted to an impulse load [8]. A reaction-time function (load vs. time) at the interface between the projectile and the rigid surface constitutes the first requirement for a global response analysis. The reaction-time function is then employed, in an independent analysis (usually by finite element methods), to evaluate the response of the target structure [6]. The first effort to uncouple the impact event and deduce a reaction-time function was performed by Riera [9]. He derived an idealized ‘smooth’ force curve versus loading by assuming a linear elastic structure model. Later, Chadmail et al. [10] and Crutzik [11] derived new reaction time functions by taking into account the non-linear behaviour of the cracked and damaged concrete. That was achieved by performing non-non-linear local calculations, which included the main physical phenomena occurring in an impacted reinforced concrete structure. Those functions were then applied to a linear elastic model of the structure resulting in a lower dynamic response inside the building.
In addition, Brandes [12] realised the importance of non-linear material behaviour in understanding the response of structures to extreme loading. Eibl and Kobler [13] and Eibl and Ockert [14] further realised the importance of strain rate effects and shock wave propagation in concrete. They performed a series of high strain rate tests by using a Hopkinson Bar device (a summary of this technique can be found in [1]). They also performed explosive loading tests to obtain the so-called Hugoniot Curve (information on this curve is given in the theoretical background of this paper).
Furthermore, Arros and Doumbaski [7] performed comparison studies using LS-DYNA, in 2006, between analysis using idealized reaction-time function of Riera and analysis with the aircraft model impacted to the building structure. They
concluded that modelling the crash with the plane impacting the target structure resulted in more high frequency content in the building response than shown by Riera force-time history method.
Historically, the local effects on concrete targets were analysed by empirical formulae, which permitted calculations of the expected depth of penetration or the thickness required to avoid perforation [9]. However, those formulae were a result of curve fitting to experimental data and as a result, they were limited by the range of the data validity. One of the first efforts, in the nuclear industry, to derive physically based equations for the penetration of solid projectiles into concrete targets, was performed by Riera [15]. Those equations were derived by assuming that a rigid-perfectly plastic projectile impacted a deformable target and that the resistance of the target to penetration was a monotonically increasing function of depth. The equations took into account the shape and the crushing strength of the projectile, the strength and quantity of steel reinforcement, as well as size effects.
Furthermore, with the rapid development of computational tools, numerical simulations of local missile impact effects have become more reliable and economic. The use of finite element or difference time explicit integration software (also known as hydrocodes) together with material models taking into account strain rate effects are readily available for determining the local response. Recently, Li et al. [16] published a detailed review on experimental (empirical), analytical and numerical (computational) studies of local effects on concrete targets arising from missile impacts. That research was part of the UK nuclear safety program against impact threats on concrete structures in nuclear power stations conducted under the auspices of Magnox Electric.
Their publication included defence-related research, which has always been on the forefront of concrete response, including the research by Riera [15]. They emphasized that concrete behaviour under compression is of most importance for impact and blast applications. They commented on the limitation of the rigid projectile assumption frequently used in obtaining analytical formulae similar to Riera [15]. Finally, they explained that the most frequently used concrete model in computational codes is the combination of an Equation of State (EoS) in hydrostatic stress space, an elastic-plastic deformation and failure model (i.e. a strength model) in deviatoric stress space, as an extension of metal plasticity models.
This paper summarizes experimental results obtained by the authors during a research program performed at the Cavendish Laboratory of University of Cambridge under the auspices of QinetiQ plc. The research was focused on acquiring data for various concrete-related materials for EoS and strength models.
PLANE STRAIN SHOCK WAVE LOADING: THEORY AND EXPERIMENTS
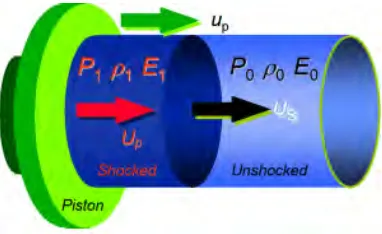
Figure 1 illustrates a rigid piston driving a shock wave into an ideal compressible fluid in an imaginary flow tube with unit cross-sectional area. The shock wave moves at velocity Us into fluid with initial state ‘0’, which changes discontinuously to state ‘1’ behind the shock wave. Particle velocity Up is identical to the piston velocity.
Figure 1: Shock wave in one-dimensional flow
The three conservation equations can be written as follows:
Mass conservation: ρ0 Us = ρ1 (Us-Up) (1)
Momentum conservation: P1 - P0 = ρ0 Us Up (2)
Energy conservation: E1 - E0 = ½ (P1 + P0) (V0 – V1) = Up2/2 (3)
Where
Us Shock Wave Velocity Up Particle Velocity
ρ Density
V Specific Volume (1/ρ) E Specific Internal Energy P Pressure
The indices ‘0’ and ‘1’ refer to the initial and final states after the passage of the shock wave, respectively, as illustrated in Figure 1. Eq. (3) also indicates equi-partition of energies, i.e. the internal energy is equal to the kinetic energy.
By measuring two variables such as pressure and particle velocity or shock wave velocity and particle velocity, different states of V may be obtained. The Resulting P-Up or P-V curve is called the Hugoniot Curve. It has to be noted that the Hugoniot Curve is not a loading path, but a locus of thermodynamic equilibrium states of a material. Furthermore, it is possible to extend the Hugoniot Curve to a complete EoS for a material by using various condensed matter theories. In general an EoS should take into account polymorphic phase changes, melting, vaporization and porous compaction.
A shock wave is a traveling wave front, which has a discontinuous adiabatic jump in state variables. The loading time is short compared to the inertial material response. The inertial responses are pressure pulses propagating through the body to communicate the presence of loads to interior points, thus, the material inertia is important. A detailed review on shock wave physics was published by Davison and Graham [17].
However, real solids have initial strength, which further depends on the passage of the shock wave. For instance, many metals exhibit strain and strain rate hardening as a result of dislocation effects. In addition, as the passage of the wave is adiabatic but non-isentropic, the temperature can increase dramatically. As a result, many materials also exhibit thermal softening effects. In the case of solids, strength and failure models are also required to fully describe the material behavior during such transient events. In addition, the strength of brittle materials, such as concrete, further depends on the hydrostatic pressure and therefore the strength model also depends on the EoS [16]. It can be seen from Figure 2, that understanding such a complex event requires several different material properties to be taken into account.
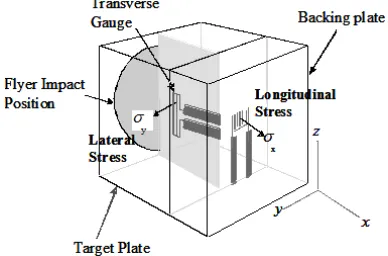
The simplest experiment that can be performed to assess the material behavior during shock wave loading is called plate impact. A plate of material is launched at known speed against another material plate, as illustrated in Figure 3. Until the shock wave reaches the lateral ends of the target, the material only moves in the direction of propagation. Therefore, uniaxial strain conditions apply. During the uniaxial strain conditions there is only one component of strain along the direction of propagation and two components of stress, since cylindrical symmetry applies. Hence, the following equations can be obtained:
The mean pressure P is given by: P = 1/3 (σx + 2 σy) (4)
Both Von Mises and Tresca conditions reduce to: Y = (σx - σy) (5)
The maximum resolvable shear stress τ is given by: 2 τ = (σx - σy) (6)
From Eq. (4) and (6) one deduces that: σx = (P + 4/3 τ) (7)
Where
P Mean Pressure
σx Component of stress along the direction of wave propagation (also known as Hugoniot or longitudinal stress) σy Component of stress normal to σx (σy = σz)
Y Yield Stress τ Shear Stress
Therefore, by measuring both components of stress and either the particle velocity or shock wave velocity, the state of the material is known. In addition, the shocked material will be released from the elevated stress by means of rarefaction waves emanating from free surfaces. When these waves originate from either the projectile-target interface or the back of the target, it is possible to acquire further information for the material state such as permanent compaction or local sound speeds. It has to be noted that for solids, the Hugoniot curve is often represented as a plot of Hugoniot Stress against particle velocity.
Figure 2: Summary of important material properties Figure 3: Schematic of a plate impact experiment
Plate impact experiments are usually performed by using a gun facility. Figure 4, illustrates the Cavendish Laboratory Facility used for the concrete materials experiments summarized in this paper. The Cavendish facility consists of a single stage 50-mm bore and 5 m length light gas gun. The gun is capable of achieving velocities up to 1200 m s-1. The projectile is accelerated down the barrel by rapid expansion of either air or Helium. Impact velocities are measured, accurately, using a sequential pin-shorting method and tilt was fixed to be less than 1 mrad by means of an adjustable specimen mount. Both components of stress can be measured by commercially available piezoresistive manganin gauges, which have been calibrated [18-19] for 1-D shock loading. Figure 5 illustrates a schematic of the gauges inserted inside the target by means of 24 h low viscosity epoxy, while Figures 6 and 7 illustrate two different manganin gauge types used in measuring σx and σy, respectively. Figure 8 illustrates typical gauge traces from two different experiments. In both experiments, a 6 mm copper projectile impacted a cement paste target at 720 m s-1. The red trace corresponds to the Hugoniot stress, which gives the Hugoniot curve, while the black trace corresponds to the lateral stress. The difference between the two traces in stress, provide the shear stress, as given by Eq. (6). If multiple gauges are included inside the target, the time of arrival between the gauges will provide the Langrangian shock wave velocity.
Finally, the particle velocity can either be measured using wire gauges, which operate by applying a constant magnetic field normal to the gauge, or by a velocity interferometric system, known as VISAR [20]. By placing a VISAR probe on a free surface, such as the back of a target, the velocity of the surface can be measured accurately. In addition, if the unknown material (such as concrete) is launched against a material of higher shock impedance (the product of initial density and shock wave velocity) such as copper, the release states of concrete can be established. Upon impact, a shock wave propagates into both concrete and copper. When this shock wave reaches the free surface of the copper plate, a release wave travels back into the plate and gradually, releases the concrete sample by traveling back and forth into the copper plate. Figure 9 illustrates an idealized particle velocity VISAR profile for the given experimental configuration, while Figure 10 illustrates a distance-time (x-t) diagram of the event. State 1 corresponds to twice the Hugoniot particle velocity of the copper, assuming that both Hugoniot and release curves of copper are the same. This is a good approximation for many metals in the stress range considered. As stress and particle velocity are continuous across an impact interface (as Eq. (1) and (2) are always obeyed), the stress in the copper plate equals that in the concrete. Furthermore, the particle velocity in the concrete is given by Uc = Vimpact – U1/2, where U1 is the particle velocity at state 1. States 2 and 3 can provide the release behavior of concrete, following a similar analysis [21].
Figure 4: Cavendish Laboratory Light Gas Gun Figure 5: Schematic illustration of target configuration
Figure 6: Longitudinal gauge for measuring σx Figure 7: Lateral gauge for measuring σy (240 μm active width)
Figure 8: Typical gauge traces during impact on cement paste
Figure 9: Idealized particle velocity VISAR profile Figure 10: Simplified x-t diagram for a VISAR experiment
EXPERIMENTAL RESULTS & DISCUSSION
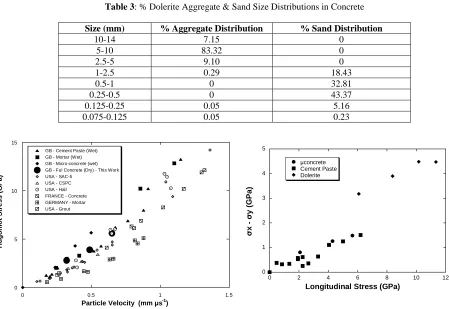
Concrete is a heterogeneous material containing aggregates and sand in a cement matrix. As a result, characterization under dynamic conditions is complicated compared to homogeneous materials. The variety of impedances of the constituents leads to variations in the particle velocities and longitudinal and lateral stresses. For this reason, the material understanding has been gradually built up starting from studies of the matrix (cement paste) [2-3, 23] individual dolerite (igneous rock) aggregates [22], mortar [23], sand [5], and finally concrete [24]. Tables 1-3 provide detailed information about the materials and their constituents used throughout this study. Figure 11 illustrate the Hugoniot curves of dry concrete, fully saturated microconcrete, mortar and cement paste from experiments performed in the Cavendish Laboratory (denoted by the prefix ‘GB’). For comparison purposes, various concretes, grouts and mortars from the USA, France and Germany are also illustrated [21, 25-28]. It can be seen that all Hugoniot curves lie relatively close to one another with the highest being the microconcrete which was fully saturated and had the highest average density.
0 1 2 3 4 5 6
0 1 2 3 4 5
Longitudinal stress (GPa)
Lateral Stress (GPa)
St
re
s
s
(
G
Pa
)
Table 1: Materials densities and composition
Material Average Density
(kg m-3) Constituents (by weight)
Concrete 2390 ± 40 50% coarse aggregate made of dolerite, 25% sand and 25% cement paste. Water to cement ratio: 0.5
Microconcrete 2530 ± 30 70% fine crushed dolerite and 30% cement paste. Water to cement ratio: 0.35
Mortar 2300 ± 50 50% fine crushed dolerite and 50% cement paste. Water to cement ratio: 0.35
Cement Paste 2100 ± 100 Water to cement ratio: 0.35
Dolerite 2890 ± 30 -
Sand 1450 ± 20 -
Table 2: % Dolerite Aggregate Size Distribution in Microconcrete and Mortar
Size (mm) % Mortar Distribution % Microconcrete Distribution
2.36-6.30 0 40
1.18-2.36 17 20
0.60-1.18 22 15
0.30-0.60 28 10
0.15-0.30 21 10
0.09-0.15 12 5
Table 3: % Dolerite Aggregate & Sand Size Distributions in Concrete
Size (mm) % Aggregate Distribution % Sand Distribution
10-14 7.15 0
5-10 83.32 0
2.5-5 9.10 0
1-2.5 0.29 18.43
0.5-1 0 32.81
0.25-0.5 0 43.37
0.125-0.25 0.05 5.16
0.075-0.125 0.05 0.23
0 1 2 3 4 5
0 2 4 6 8 10 12
μconcrete Cement Paste Dolerite σ x - σ y ( G P a )
Longitudinal Stress (GPa)
Figure 11: Hugoniot curves of concrete-related materials Figure 12: Shear Stress of μconcrete, cement paste and dolerite
0 5 10 15
0 0.5 1 1.5
GB - Cement Paste (Wet) GB - Mortar (Wet) GB - Micro-concrete (wet) GB - Ful Concrete (Dry) - This Work USA - SAC-5
USA - CSPC USA - Hall FRANCE - Concrete GERMANY - Mortar USA - Grout
H u goni o t S tre ss (G Pa )
Particle Velocity (mm μs-1
Furthermore, the matrix material (cement paste) had different water to cement ratios and saturation for the various materials from different countries. Therefore, it can be concluded that differences in the Hugoniot curve of such materials are driven by differences in the initial density, water to cement ratio and saturation levels upon testing. The aggregate and sand inclusions contribute to the initial density but the dynamic properties of these materials are dominated by the cement paste matrix.
Figure 12 illustrates twice the shear stress (which is the difference between the longitudinal/Hugoniot and lateral stress, according to Eq. (6)) dependence on the Hugoniot stress for the microconcrete and cement paste. For comparison purposes, the dolerite results are also plotted. It can be seen that the dynamic shear stress of microconcrete is only slightly higher than that of cement paste. In addition, it can be seen that although crushed dolerite constitutes 70% of microconcrete by weight, it plays a minor roll, if any, in the dynamic shear stress. The significant factor is the matrix material.
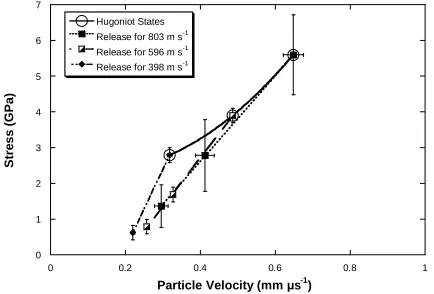
Finally, Figure 13 illustrates the concrete Hugoniot states together with its subsequent release states, as obtained in this experimental program using the VISAR method, described in the previous section. It can be seen that there is a difference between the Hugoniot curve and release states, indicating the existence of residual strain or permanent compaction upon release, in accordance with [21].
Figure 13: Hugoniot curve and corresponding release states of concrete for different impact speeds with a Cu flyer
CONCLUSIONS
This paper provides a short overview of shock wave propagation in materials under plane strain conditions and summarizes research performed on concrete-related materials under extreme loading in Great Britain under the auspices of QinetiQ plc. Results indicate that the matrix material (cement matrix) dominates the behavior of these materials. Furthermore, the release behavior of concrete deviates from the Hugoniot curve, indicating the existence of residual strains upon release.
ACKNOWLEDGEMENTS
The experimental program presented here has been funded by QinetiQ plc and the UK Ministry of Defense (MoD). This research forms part of a larger study including DSTL, QinetiQ plc, the MoD, Imperial College London and Sheffield University.
REFERENCES
1. Field, J.E., Walley, S.M., Proud, W.G., Goldrein, ,HT, and Siviour C.R., "Review of experimental techniques for high rate deformation and shock studies", International Journal of Impact Engineering, Vol.30, 2004, pp. 725-775. 2. Tsembelis, K., Millett, J.C.F., Proud, W.G. and Field, J.E., “The Shock Hugoniot Properties of Cement Paste up to 5
GPa”, Proc. of SHOCK99-APS 11th Topical Conference on Shock Compression of Condensed Matter, (Eds. MD Furnish, LC Chhabildas and RS Hixson)Salt Lake City, UT, pp. 1267-1270, June 27- July 2, 1999.
0 1 2 3 4 5 6 7
0 0.2 0.4 0.6 0.8 1
Hugoniot States Release for 803 m s-1
Release for 596 m s-1
Release for 398 m s-1
St
re
ss (
G
Pa)
Particle Velocity (mm μs-1)
3. Tsembelis, K., Proud, W.G. and Field, J.E., "The Dynamic Strength of Cement Paste under Shock Compression",
Proc. of SHOCK01-APS 12th Topical Conference on Shock Compression of Condensed Matter, (Eds. MD Furnish,
NN Thadhani and Y Horie), pp. 1414-1417, Atlanta, 24-29 June 2001.
4. Tsembelis, K., Proud, W.G., “The Dynamic Behaviour of Microconcrete”, Proc. of SHOCK05-APS 14th Topical
Conference on Shock Compression of Condensed Matter, pp. 1496-1499, 31 July-5 August 2005
5. Chapman, C.J., Tsembelis, K., Proud, W.G., “The Behaviour of Sand Under Shock-Loading Conditions”, Proc. of
SHOCK05-APS 14th Topical Conference on Shock Compression of Condensed Matter, pp. 1445-1448, 31 July-5
August 2005
6. Stevenson, J.D., Eibl, J., Curbach, M., Johnson, T.E., Daye, M.A., Riera, J.D., Krutzik, N.J., Nemet, J. and Iyengar, K.T.S., “Advances in the Analysis and Design of Concrete Structures, Metal Containments and Liner Plate for Extreme Loads”, Nuclear Engineering and Design, Vol. 134, 1992, pp. 87-107.
7. Arros, J. and Doumbalski, N., “Analysis of Aircraft Impact to Concrete Structures”, Nuclear Engineering and
Design, (in press), 2006, doi: 10.1016/j.nucengdes.2006.09.044.
8. Abbas, H., Paul., D.K., Godbole, P.N. and Nayak, G.C. “Aircraft Crash Upon Outer Containment of Nuclear Power Plant”, Nuclear Engineering and Design, Vol. 160, 1996, pp. 13-50.
9. Riera, J.D., “A Critical Repraisal of Nuclear Power Plant Safety Against Accidental Aircraft Impact”, Nuclear
Engineering and Design, Vol. 57, 1980, pp. 193-206.
10. Chadmail, J.F., Krutzik, N.J. and Dubois, T., “Equivalent Loading due to Airplane Impact Taking into Account the Non-Linearities of Impacted Reinforced Concrete Buildings”, Nuclear Engineering and Design, Vol. 85, 1985, pp. 47-57.
11. Krutzik, N.J., “Reduction of the Dynamic Response by Aircraft Crash on Building Structures”, Nuclear Engineering
and Design, Vol. 110, 1988, pp. 191-200.
12. Brandes, K., “Assessment of the Response of Reinforced Concrete Structural Members to Aircraft Crash Impact Loading”, Nuclear Engineering and Design, Vol. 110, 1988, pp. 177-183.
13. Eibl, J. and Kobler, G., “Impact Research for Containment Design”, Nuclear Engineering and Design, Vol. 150, 1994, pp. 409-415.
14. Eibl, J. anf Ockert, J., “Analysis of Shock Wave Propagation in Concrete”, Proc. Of SMiRT-12 – JH12/1, 1993. 15. Riera, J.D., “Penetration, Scabbing and Perforation of Concrete Structures Hit by Solid Missiles”, Nuclear
Engineering and Design, Vol. 115, 1989, pp. 121-131.
16. Li, Q.M., Reid, S.R., Wen, H.M. and Telford, A.R., “Local Impact Effects on Hard Missiles on Concrete Targets”,
International Journal of Impact Engineering, Vol.32, 2005, pp. 224-284.
17. Davison, L. and Graham, R., “Shock Compression of Solids”, Physical Reports, Vol. 55, 1979, pp. 255-379. 18. Rosenberg, Z, Yaziv, D. and Partom, Y.J., “Calibration of Foil-Like Manganin Gauges in Planar Shock Wave
Experiments”, Journal of Applied Physics, Vol. 51, 1980, pp. 3702-3705.
19. Rosenberg, Z. and Partom., Y.J., “Lateral Stress Measurement in Shock-Loaded Targets with Transverse Piezoresistance Gauges”, Journal of Applied Physics, Vol. 58, 1985, pp. 3072-3076.
20. Barker, L.M. & Hollenbach, R.E, “Laser Interferometer for Measuring High Velocities of any Reflecting Surface”,
Journal of Applied Physics, Vol. 43, 1972, pp. 4669-4675.
21. Hall, C. A., Chhabildas, L. C., and Reinhart, W. D., “Shock Hugoniot and Release in Concrete with different Aggregate Sizes from 3 to 23 GPa”, International Journal of Impact Engineering, Vol. 23, 1999, pp. 341-351. 22. Tsembelis, K., Proud, W. G. and Field, J.E., “The Principal Hugoniot and Dynamic Strength of Dolerite under
Shock Compression”, Proc. of SHOCK01-APS 12th Topical Conference on Shock Compression of Condensed
Matter, (Eds. MD Furnish, NN Thadhani and Y Horie), pp. 1385-1388, Atlanta, 24-29 June 2001
23. Tsembelis, K., Proud, W.G.P., Willmott, G.R. and Cross, D.L.A, “The Shock Hugoniot Properties of Cement Paste & Mortar up to 18 GPa”, Proc. of SHOCK05-APS 13th Topical Conference on Shock Compression of Condensed
Matter, (Edited by M.D. Furnish et.al.), pp. 1488-1490, Portland, 2001.
24. Tsembelis, K., Chapman, D.C., Braithwaite, C.H. and Proud, W.G., “The Dynamic Behaviour of Concrete”, Proc. of
the Annual Conference of the Society for Experimental Mechanics, St. Louis, Mo., June 2006, tbp.
25. Grady, D. E., “Shock Equation of State Properties of Concrete,” Proc. of Structures under Shock and Impact IV, (edited by N. Jones et al.), Computational Mechanics Publications, pp. 405-414, Southampton, UK, 1996.
26. Grady, D. E., and Furnish, M.D., “Hugoniot and Release Properties of a Water-Saturated High- Silica-Content Grout”, Proc. of SHOCK01-APS 6th Topical Conference on Shock Compression of Condensed Matter,, (Edited by S.C. Schmidt et.al.), pp. 621-624, 1989.
27. Le Vu, O., “Etude et Modelisation du Comportement du Beton Sous Sollicitations de Grande Amplitude”, Ph.D.
Thesis 1998, Ecole Polytechnique, (in French).
28. Riedel, W., “Beton Unter Dynamischen Lasten Meso- und Maromechanische Modelle und Ihre Parameter”, Phd.
Thesis 2001, Fraunhofer Institute for High-Speed Dynamics, Ernst-Mach-Institut (EMI), (in German).