Division V
EQUIVALENT LINEARIZATION USING TRANSFER FUNCTION APPLIED TO PIPING SYSTEMS IN SEISMIC ENGINEERING
Thuong Anh Nguyen1, Pierre Labbé2, Jean-François Semblat3, and Guillaume Hervé2,4
1 Ph.D. Student, Paris-Est University, France 2 Professor, Paris-Est University, France
3 Professor, Paris-Est University & IFSTTAR, France
4 IMSIA, UMR 929 EDF-CNRS-CEA-ENSTA Paris Tech, France
ABSTRACT
After the accident of Fukushima-Daïci NNP in 2011, the question of the capacity of NNP to withstand design seismic hazard has become a prior concern that has increased the need of evaluations of NNP’s structures or their components within a higher level of seismic load by taking into account nonlinear behavior. This is not an easy task due to of the need of computational capacity due to many iterations required at each step in order to satisfy the equilibrium. Seismic engineers can call for equivalent linearization concepts from different criteria that allow them coping the non-linear responses without performing the non-linear transient calculation, which is a “well” established concept for reinforced concrete structures (within an important number of concepts such as the ones presented by Iwan (1980) or Chopra (1995)) but not for piping systems. In addition, despite the advantages, their assumptions are insufficient or even inconsistent. In this paper, considering a systematic and argumentative analysis based on numerical experimental plan, linear equivalent behavior has been established by considering the equivalence criterion through the transfer function from the time domain to the frequency domain. The equivalent linearization has been conceived for the elastoplastic system representing a non-linear behavior of piping systems, undergoing the filtered white noise signal Clough-Penzien. As results, the frequency degradation and increasing damping versus ductile demand have been established. Then, this result is compared with those obtained from the piping system’s test campaign EPRI in 1994 (EPRI (1994)) and BARC in 2015 (Ravikiran A. (2015). This comparison highlights the similarities between the experimental results and the ones using transfer function with elastoplastic behavior in terms of the linear equivalent behavior.
INTRODUCTION
While the structure exhibits nonlinear behavior which is characterized by hysteresis strain-stress loops during the cyclic load, the stiffness of the structure is reduced and its damping increased versus plastic deformation. These phenomena could be considered by performing the nonlinear transient calculation. However, the huge need in terms of timing and memory consummation can be prohibitive. In addition, this last calculation could raise convergence problems.
In this context, simplified methods or procedures are introduced by using the equivalent linearization analysis. These concepts are usually displacement-based criteria and well established the reinforced concrete structure based on an adequate constitutive law: Iwan (1980), Kowalsky (1994), Chopra (1995), Iwan and Guyader (2002). Unfortunately, this approach is still less studied for piping systems. The question of margin in design addressed by Labbé (2013) while examining the piping system confirms the need of effective frequency and damping for piping systems.
Based on the elastoplastic behavior, Chopra (1995) (and Chopra and Goel (1999)) has defined the equivalent linear behavior of an elastoplastic oscillator by using the secant stiffness for the Capacity Spectrum Method (CSM). This equivalent linearization consist in an equivalent linear oscillator whose frequency is linked to the slope of the straight line connecting the origin and the point of maximal deformation of the deformation-force curve during the earthquake, and the equivalent damping ratio based on the dissipated energy within the hysteretic loop corresponding to the maximal deformation. This concept has two disadvantages, at least, at the author’s point of view:
1. The unloading stiffness is equal to the secant one but the dissipated energy is performed with the unloading stiffness equal to the elastic one. Therefore, there is an inconsistency in term of model of equivalent linearization,
2. The model bases completely on the loop of the maximum of the deformation time history but there are many loops of smaller deformation appearing before and after this maximum.
In the modified version proposed in ATC-40 (1996), a damping modification factor κ has been introduced in order to take into account the imperfection hysteresis loop. This value of κ is established based on different types of behavior. The maximum of κ (equal to 1) is applied to the structure representing stable, reasonably full hysteresis loops. This case seems to be closed to the piping systems.
In this paper, the concept of equivalent linearization for the elastoplastic oscillator is examined. This concept is based on an argumentative and systematic analysis by using the transfer function as equivalent criterion. The filtered Clough-Penzien white noises are used as ground motions. As results, the frequency degradation and increase of damping ratio versus the ductile demand are established. This study highlighted the dependency of equivalent linearization on the relative position of initial frequency in respect to central frequency of ground motion. This important parameter has unfortunately not studied in any existing concept. These results are compared with experimental ones of EPRI (1994) and BARC (2015) for validation. In addition, the frequency degradation for elastoplastic oscillator is so much smaller than Chopra’s one.
EQUIVALENT LINEARIZATION USING TRANSFER FUNCTION Clough & Penzien filtered White Noise
In this article, the filtered white noise of the type Clough & Penzien is used. The procedure is detailed by Zentner (2013). The signal is random stationary process multiplied by an envelope curve in time domain and characterized by its Power Spectral Density (PSD) as the figure 1.
(a): Normalized amplitude of Power Spectral Density (PSD)
(b): Signal of type Clough & Penzien filtered white noise. N=2000; t = 0.01s
Figure 1.
Response of elastic oscillator through transfer function
It is to consider here an elastic oscillator of frequency f0 and damping ratio 0, which is excited at its base
by a strong ground motion that can be written under its complex form ( )
( ) j t
e e
x t X e . Its elastic
response is also a harmonic signal and written under its complex form ( ) (j t) j
s s
x t X e e. Then the complex transfer function
H
t is defined as following:2
( )
0 2
0
0 0
.
( )
1 2
j s
t e
f f X e
H f
X f f
j
f f
(1)
Response of elastoplastic oscillator using -Newmark Scheme
The elastoplastic oscillator studied in this article consists of a combination of elastic springs (F k ue ),
Newtonian damper (F Cu) and Saint-Venant sliding element (Fy).
The dynamic equation of the motion of the mass of this elastoplastic oscillator is written as following:
0 0
2 ( ) / ( )
u
u f u m g t (2)Where:
u
: Relative displacement of the massm
;m
: Mass of the elastoplastic oscillator, herem
is taken of 1 kg;0
: Angular velocity corresponding to the elastic frequency of the oscillator
0
2
f
0;0
: Damping ratio corresponding to the angular velocity and the Newtonian viscosity 00
2
C m
;
( )
g t : Ground motion displacement applied to the elastoplastic oscillator.
In this study, many oscillators are examined with damping ratio
0 fixed at 5%. The initial frequency f0depends on the central frequency of ground motion fc. The ratio is taken among 0.1; 0.5; 1.0; 1.5; 2.0 in order to examine the influence of relative position of f0 in respect to fc equal to 3.3 Hz. In addition, the
influence of the hardening on the equivalent linearization are also analyzed. Therefore, an kinematic hardening measure is defined by the ratio of hardening stiffness against the initial stiffness, so noted p.
For numerical application,
ptakes values of 0%, 10%, 20%.Figure 3. Plan of numerical experience
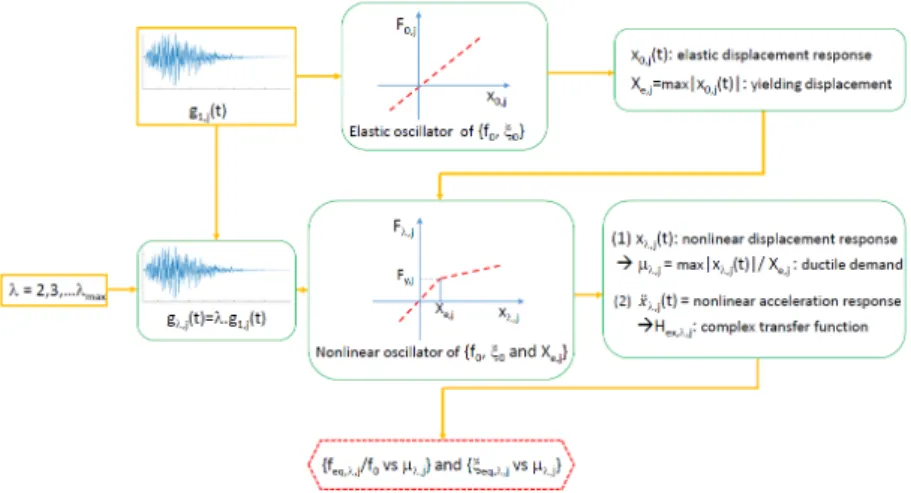
So, for each case of {
f
0 and
p}, a numerical experience as shown in the Fig. 3 are conducted.Where:
1,j
g t : Ground motion of type Clough-Penzien filtered white noise with
j
1...1000
at level 1;
0,j
x t : Displacement time history of elastic oscillator of
f0,0
undergoing theg1,j
t ;
, max 0,
e j j
X X t : Maximal displacement of elastic oscillator of
f0,
0
undergoing the
1,j
max 2, 3,..., 9,
: Amplification factor of the amplitude of ground motions. At this stage, it is
certain to say that the g1,j
t leads the elastoplastic oscillator of
f0,
0
and Xe j, max X0,j
t justto the yielding point, no plastic deformation is observed. Then, g,j
t
.g1,j
t make theseelastoplastic oscillators to exhibit plastic deformation. The value of max is determined such as the median
value of is equal to 20;
,j
u t : Displacement time history of elastoplastic oscillator of
f0,
0
and Xe j, undergoingtheg,j
t
.g1,j
t , performed by using the -Newmark scheme. Then, the ductile demand is definedas :
,j maxu,j( ) /t Xe j, ;, ,
ex j
H : Experimental complex transfer function defined as , , , ,
( ( )) ( )
( ( ))
j
ex j i
j
fft x t
H f
fft g t
, and
fft
(.)
assigns the Fast Fourier Transform;
feq, ,j,
eq, , j
: Equivalent linear frequency and damping ratio defined by the procedure of equivalent linearization which is defined in next section.Equivalent linearization by the complex transfer function
For every single of Hex, , j, the couple of
feq, , j,
eq, ,j
is determined by minimizing “the difference” between the experimental complex transfer function Hex, ,jand theoretical one, , , ,
t,feq j,eq j
H
of the elastic
equivalent oscillator. That is to say, the theoretical
, , , ,
t,feq j,eq j
H
is the best fit of the complex transfer
functionHex, ,j. As numerically saying, the
feq, , j,
eq, , j
are determined by minimizing this term:
eq , , eq , ,
eq , , eq , ,
2
max 2
, , , , , , ,{f , } , , ,{f , }
min
; Re ( ) Re ( ) Im ( ) Im ( )
j j j j
f
eq j eq j ex j i t i ex j i t i
f
J f H f H f H f H f
(3)
Where Re(.) and Im(.) assign the real and imaginary part of complex number.
For the best frequency resolution, the zeros-padding method is applied. The determination of
feq, ,j,
eq, , j
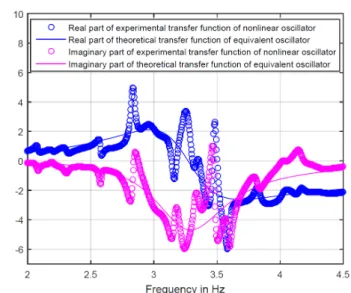
is reached by using the operator lsqcurvefit in matlab.For example (Ref. figure 4), the result of
feq, ,j,
eq, ,j
determined for 2 and j1is presented. TheXe,1is determined by the linear analysis of the elastic oscillator of
f0 3.35 Hz,05%
and10%
p
equal to 0.021 m. The equivalent oscillator is characterized by
feq,2,1,
eq,2,1
= {3.27 Hz,13.6 %}.
According to this procedure, for each value of
2, 3,..., 9,
max, 1000 couples of
feq, , j,
eq, , j
andFigure 4. Example of complex transfer function regression
The regression processes is applied to the frequency degradation and increasing of damping. The formula
for feq/f0 take the value
p as its asymptotic and the increase of damping is inverse-proportional tofeq/f0, as observed in the Nguyen et al. (2016):
0
0
0
1
1 1
1
p eq
p d
c eq eq
f f
b f a
f
(4)
The values of a, b, c and d have determined through the nonlinear least squared regression.
Result of equivalent linearization
Legend of colors
(a):
feq/ f0 vs
for p = 0% (b):
eqvs
for p = 0%(c):
feq/ f0 vs
for p = 10% (d):
eqvs
for p = 10%(e):
feq/ f0 vs
for p = 20% (f):
eqvs
for p = 20%Figure 5. Results of frequency degradation and increase of damping
PIPING SYSTEM TEST CAMPAIGN OF EPRI AND BARC
EPRI piping components tests
In the report of EPRI (1994), the outputs for pressurized piping components are found in term of effective frequencies, damping ratios and cyclic strain. Then, these outputs can be explored as:
+ Experimental frequency degradation versus effective damping
Considering that the plastic yielding is classically associated to 0.2% strain, recorded strain values are divided by 0.2 to be converted into ductile demand (μ values). Then, experimental points can be plotted as following:
(a): Increasing of damping versus frequency degradation
(b): Increasing of damping versus ductile demand
Figure 6.
The experimental results can now be compared with the results obtained from our analysis of the proposed concept using transfer function. It is important to note that the parameter p is not available in
the report, then, the kinematic hardening can be introduced with reasonable values of p = 0% (orange
curve) and 10% (gray curve) (Ref. figure 6) (The value p = 5% is found for the test of BARC).
According to the ratio of f0/fc, all components are adjusted so that the frequency at peak of signal is about
0.85% of the natural frequency of piping components, so the value of f0/fc equal to 1.00/0.85=1.17.
Unfortunately, the result for f0/fc is not available from our analysis, then the interpolated value between
f0/fc = 1.0 and 1.5 are used. According to the figure 7, the results of our proposed concept of equivalent
linearization fit quietly well the experimental result. The curve for xeq-x0 versus feq/f0 for 10% is better than the curve of 0% but less in term of eq-0 versus . For = 3, the value of 5% of increase of damping
for experimental result are observed and equal to our proposed equivalent linearization’s result. This value if so smaller than Chopra’s one of 32% for p = 10 and of 42% for p = 0% Chopra et al. (2001).
BARC piping systems tests
The carbon steel piping systems CSPS-1 and CSPS-2 were tested with strong ground motions up to 2.5 (g). According to the Labbé (2017), even the ductile demand reaches a value of 2 (equivalent to 0.4% of hoop strains), the frequency is slightly reduced, and tabulated in the following table (Ref. table 1):
Table 1: BARC experimentation
Frequency shift under beyond design seismic input
SSPS-1 SSPS-2
feq(2.5g)/f0 0.99 0.97
Ductile demand 2 2
sections such as elbows, anchors,… remain elastic. Then, the equivalent of BARC for vertical response is proposed, which consist in the parallel assemblage (Ref. figure 7) of an elastic spring (red one) which represents the mid-branch within section D-D and an elastoplastic part (yellow one) which represents the two branches within section F-F.
(a): Finite element (FE) model of piping system BARC
(b): Equivalent model for vertical response of BARC Figure 7.
Thank to FE model, the 0,F-F 0,F-F
0,D-D 0,D-D
f k
f k can be easily determined with k0,D-D and k0,F-F are successively
the generalized stiffness of the first mode for structure BARC without embedded support at anchor of F-F branch and one for BARC without embedded support at anchor of D-D branch. Numerical value of this ratio is equal to 1.02. Once the section F-F exhibits its elastoplastic behavior, this elastoplastic one can be replaced by an equivalent linear one of {feq and eq} associated to the value of ductile demand observed in
section F-F. If is sufficient to read these values from the curve of figure 5. The initial frequency of BARC is about 4.06 Hz and central frequency of seismic signal is about 8.56 Hz, then the ratio f0/fc = 0.47.
Contrary to EPRI, experimental results are available for stabilized cycle load strain-stress relation (Goyal et al 2013) to determine the value of kinematic hardening. Here, the kinematic hardening of material SA 333 Gr.6 is about 5%. For a value =2, feq/f0 is equal to 0.9664 (Ref. figure 5). Then, the total equivalent
structure can be replaced by an equivalent consisting in parallel assemblage of elastic spring D-D and equivalent linear spring F-F, which lead us to the total frequency shift of (1.02*feq,FF/f0,FF+1)/(1.02+1)
=0.98. This value corresponds to the value obtained during the test (Ref. table 1).
CONCLUSIONS
The study carried out the result of equivalent linearization using transfer function applied to elastoplastic behavior. The result of frequency degradation and increasing of damping is established through a numerical experimental plan for an important rang of ductile demand up to 20.
The results of the proposed concept of equivalent linearization correspond to experimental of piping components and systems tests. The increase of damping on piping systems is so smaller than the value of Chopra’s concept based on elastoplastic behavior, which is usually used in practice.
The frequency degradation reaches its asymptotic value of
p when ductile demand tends to infinity.The results of our systematic analysis highlight the influence of an important parameter : the relative positon of initial frequency versus the central frequency (f0/fc). This ratio stands for the stiffness of
REFERENCES
Baylac, G., & Grandemange, J. M. (1991). The French code RCC-M: Design and construction rules for the mechanical components of PWR nuclear islands. Nuclear engineering and design, 129(3), 239-254.
Chopra, A. K. (1995). Dynamics of structures (Vol. 3, p. 339). New Jersey: Prentice Hall.
Chopra, A. K. and Goel, R. K. (2001) “Modal Pushover Analysis Procedure to Estimate Seismic Demands for Buildings”. Theory and Preliminary Evaluation-Pacific Earthquake Engineering Research Center.
Chopra, A. K. and Goel, R. K. (1999) “Capacity‐Demand‐Diagram Methods Based on Inelastic Design Spectrum”. Earthquake Spectra: November, Vol. 15, No. 4, pp. 637-656.
Chopra, A.K. (2001) “Dynamics of Structures - Theory and applications to Earthquake Engineering” - Pearson Education Asia Limited and Tsinghua University Press, Beijing.
Council Applied Technologized. (1996) “Seismic Evaluation and Retrofit of concrete Buildings” ATC 40. Goyal, S., Gupta, S. K., Sivaprasad, S., Tarafder, S., Bhasin, V., Vaze, K. K., & Ghosh, A. K. (2013). Low cycle fatigue and cyclic plasticity behavior of Indian PHWR/AHWR primary piping material. Procedia Engineering, 55, 136-143.
EPRI. (1994) “Piping and fitting dynamic reliability program EPRI”- Palo Alto, CA.
Iwan, W. D. (1980) “Estimating inelastic response spectra from elastic spectra”. Earthquake engineering and structural dynamics. - pp. 375-388.
Iwan, W. D., & Guyader, A. C. (2002, August). An improved equivalent linearization procedure for the capacity spectrum method. In Proc., International Conference on Advanced and New Challenges in Earthquake Engineering Research, August (pp. 15-17).
Kowalsky, M. J. (1994). Displacement-based design: a methodology for seismic design applied to RC bridge columns. University of California, San Diego, Department of Applied Mechanics/Engineering Sciences.
Labbé, P. B. (2013). Categorization of seismically-induced stresses for civil and mechanical engineering.
Nuclear Engineering and Design, 255, 240-247.
Labbé P. (2017) “ON CATEGORIZATION OF SEISMIC LOAD AS PRIMARY OR SECONDARY”.
Proceedings of the ASME 2017 PVP Conference. Waikoloa, Hawai, USA
Nguyen. T. A, Labbé P., Semblat J. F., Hervé G. (2016). “Systematic analysis of the concept of equivalent linear behavior in seismic engineering by minimization in frequency domain”. 2016
Proceeding of the TINCE 2016 Conference Paris, France.
Ravikiran, A., Dubey, P. N., Agrawal, M. K., Reddy, G. R., Singh, R. K., & Vaze, K. K. (2015). Experimental and Numerical Studies of Ratcheting in a Pressurized Piping System Under Seismic Load. Journal of Pressure Vessel Technology, 137(3), 031011.