Clinical Pharmacology: Advances and Applications
Dove
press
R e v i e w
open access to scientific and medical research
Open Access Full Text Article
Carbon monoxide: a critical quantitative analysis
and review of the extent and limitations of its
second messenger function
David G Levitt1
Michael D Levitt2
1Department of integrative Biology
and Physiology, University of Minnesota, Minneapolis, MN, USA;
2Research Service, veterans Affairs
Medical Center, Minneapolis, MN, USA
Correspondence: David G Levitt, Department of integrative Biology and Physiology, University of Minnesota, 6-125 Jackson Hall, 321 Church St S e, Minneapolis, MN 55455, USA Tel +1 612 625 7649 Fax +1 612 625 5149 email [email protected]
Abstract: Endogenously produced carbon monoxide (CO) is commonly believed to be a ubiq-uitous second messenger involved in a wide range of physiological and pathological responses. The major evidence supporting this concept is that CO is produced endogenously via heme oxygenase-catalyzed breakdown of heme and that experimental exposure to CO alters tissue function. However, it remains to be conclusively demonstrated that there are specific receptors for CO and that endogenous CO production is sufficient to alter tissue function. Unlike other signaling molecules, CO is not significantly metabolized, and it is removed from cells solely via rapid diffusion into blood, which serves as a near infinite sink. This non-metabolizable nature of CO renders the physiology of this gas uniquely susceptible to quantitative modeling. This review analyzes each of the steps involved in CO signaling: 1) the background CO partial pressure (PCO) and the blood and tissue CO binding; 2) the affinity of the putative CO recep-tors; 3) the rate of endogenous tissue CO production; and 4) the tissue PCO that results from the balance between this endogenous CO production and diffusion to the blood sink. Because existing data demonstrate that virtually all endogenous CO production results from the routine “housekeeping” turnover of heme, only a small fraction can play a signaling role. The novel aspect of the present report is to demonstrate via physiological modeling that this small frac-tion of CO producfrac-tion is seemingly insufficient to raise intracellular PCO to the levels required for the conventional, specific messenger receptor activation. It is concluded that the many physiological alterations observed with exogenous CO administration are probably produced by the non-specific CO inhibition of cytochrome C oxidase activity, with release of reactive oxygen species (ROS) and that this ROS signaling pathway is a potential effector mechanism for endogenously produced CO.
Keywords: cytochrome, oxygenase, Krogh cylinder model, ROS, heme
Introduction
Scientific appreciation of the physiological implications of carbon monoxide (CO) has evolved from its recognition as an environmental toxin in 1857,1 to demonstration
of its derivation from heme catabolism in 1952,2 to its present important status as an
intracellular messenger that regulates hundreds of physiological and cytoprotective functions. CO is produced in animals exclusively by heme oxygenase (HO) catalysis of heme to biliverdin:3
Heme+3O +3 5NADPH+3 5H+→HOCO biliverdin Fe+ + ++3 5NADP++3H O2
2 . . 2 .
(1)
Clinical Pharmacology: Advances and Applications downloaded from https://www.dovepress.com/ by 118.70.13.36 on 21-Aug-2020
For personal use only.
Number of times this article has been viewed
This article was published in the following Dove Press journal: Clinical Pharmacology: Advances and Applications
Dovepress
Levitt and Levitt
In mammals, there are two forms of HO: an inducible form, HO-1 (also known as heat-shock protein 32), and a constitutive form, HO-2. A wide variety of stimuli induce HO-1, including oxidative stress, heat shock, ischemia, radiation, hypoxia, hyperoxia, and drugs.4–6 This amazing
responsiveness to nearly every known cell-modifying signal has focused attention on the potential importance of HO in a wide range of clinical conditions. It is important to recognize that alterations in HO do not necessarily implicate CO as the HO effector, since HO has three other functions: removal of heme, release of Fe2+, and production of the anti-oxidant
bilirubin from biliverdin, all of which are important cellular responses to stress and cell death.7 However, it is widely
assumed that the primary effect of HO induction is the modification of cell function via production of CO, which serves as a second messenger. The focus of this review will be on the unique physiology required for CO to serve as the second messenger mediator of HO activity – a function invoked as a factor in a wide variety of clinical conditions. For example, a recent review of just the central nervous system conditions in which CO is implicated include Alzheimer’s disease, Parkinson’s disease, multiple sclerosis, cerebral artery occlusion, and pain.8
The CO messenger literature is enormous, involving nearly every organ and regulatory system. There are a number of excellent recent reviews of this topic,5–13 with each review
having a particular focus and emphasis. Seemingly lacking in these discussions is a critical examination of the unusual features of CO that complicate the ability of this gas to serve as a typical intracellular messenger. Most signaling molecules are produced solely for a signaling purpose and are then rap-idly catabolized (eg, nitric oxide has a half-time of less than 2 seconds), and the background intracellular activity of the signaling molecule is maintained at a very low level. In con-trast, there is minimal catabolism of CO, and endogenously produced CO is removed from the cell entirely via diffusion to the blood, where it is avidly bound by hemoglobin (Hb). Homeostasis of blood CO is established by pulmonary excre-tion, a relatively slow process with a half-time of approxi-mately 4 hours (as discussed in the “Hb and Mb CO binding and pharmacokinetics” section). Thus, cells float in a sea of the messenger, which maintains a low, but not negligible-free CO concentration in the cell equal to that of blood, about 0.002 µM, or a CO partial pressure (PCO) of 0.0019 mmHg under normal conditions (Table 1). To provide a signal, CO has to be produced at a rate that appreciably raises the CO concentration over the basal level, ruling out the possibil-ity that trivial CO production could serve as a messenger.
The lack of catabolism of CO, its removal from the cell by diffusion to the blood, and its excretion solely via the lungs makes CO uniquely amenable to quantitative physiological modeling. For example, in contrast to other messengers, the total body production of CO is easily assessed (via breath measurements), and the intracellular PCO at baseline and following CO administration both can be determined, since intracellular PCO is in equilibrium with the blood PCO. Most important, the diffusion of CO between the cell and blood can be quantitatively modeled, making it possible to estimate the intracellular production rate required to maintain a given cellular PCO. In Table 1, we have summarized the fundamental physical chemical CO parameters (eg, solubility, diffusion coefficient) and the range of CO concentrations required for different biological effects.
The fundamental (but rarely stated) hypothesis of CO signaling is that local tissue CO production raises the local
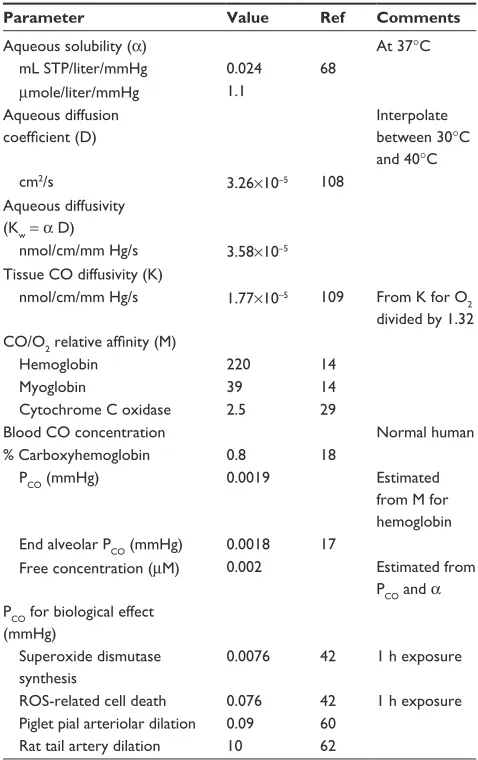
Table 1 Physiological CO parameters (at 37°C)
Parameter Value Ref Comments
Aqueous solubility (α) At 37°C
mL STP/liter/mmHg 0.024 68
µmole/liter/mmHg 1.1 Aqueous diffusion
coefficient (D)
interpolate between 30°C and 40°C
cm2/s 3.26×10⁻⁵ 108
Aqueous diffusivity (Kw = α D)
nmol/cm/mm Hg/s 3.58×10⁻⁵
Tissue CO diffusivity (K)
nmol/cm/mm Hg/s 1.77×10⁻⁵ 109 From K for O
2
divided by 1.32 CO/O2 relative affinity (M)
Hemoglobin 220 14
Myoglobin 39 14
Cytochrome C oxidase 2.5 29
Blood CO concentration Normal human
% Carboxyhemoglobin 0.8 18
PCO (mmHg) 0.0019 estimated
from M for hemoglobin end alveolar PCO (mmHg) 0.0018 17
Free concentration (µM) 0.002 estimated from
PCO and α PCO for biological effect
(mmHg)
Superoxide dismutase synthesis
0.0076 42 1 h exposure
ROS-related cell death 0.076 42 1 h exposure Piglet pial arteriolar dilation 0.09 60
Rat tail artery dilation 10 62
Abbreviations: STP, standard temperature and pressure; ref, reference; ROS,
reactive oxygen species; PCO, CO partial pressure; h, hour.
Clinical Pharmacology: Advances and Applications downloaded from https://www.dovepress.com/ by 118.70.13.36 on 21-Aug-2020
Dovepress Carbon monoxide signaling
cellular concentration to a level sufficiently above the background concentration to trigger the signaling, which is then terminated when the tissue production ceases and the CO diffuses to the blood sink. The crucial issue is whether the rate of tissue production is sufficient to reach signaling levels, given the rapid rate of diffusion between cells and the blood sink. In order to answer this question, the follow-ing items require careful consideration: 1) the background blood and tissue CO; 2) the CO affinity of the putative tissue CO signaling receptors; 3) the rate of endogenous tissue CO production; and 4) a quantitative analysis of the tissue CO concentration that is reached as a result of this CO produc-tion in the presence of the nearly infinite diffusion sink represented by the blood. This review will present what we believe to be the first detailed, quantitative discussions of each of these issues.
The “Hb and Mb CO binding and pharmacokinetics” section reviews the quantitative details of the binding of CO to Hb and myoglobin (Mb) and the pharmacokinetics of CO production, distribution, and excretion. This binding determines the steady state background CO concentration and the time dependence of its change when CO is exogenously administered.
Two fundamentally different receptor mechanisms have been proposed for CO second messenger signaling. The first, discussed in the “COX binding and ROS formation” section, is the CO binding to and inhibition of cellular cytochrome C oxidase (COX), a reaction which releases reactive oxygen species (ROS) that serve as a relatively non-specific effector. This type of “signaling” is unique to CO and raises the ques-tion of whether it is actually a physiological mechanism versus a non-specific toxic CO action. This issue is particu-larly important, because most recent research concerning the mode of action of inhaled CO invokes the mechanism of ROS formation secondary to COX inhibition. The second signaling mechanism is the classic second messenger type involving binding to a specific CO receptor which then trig-gers a unique cellular response. The “Specific CO sensors or receptors” section reviews the CO receptors that have been proposed, their affinity for CO, and the evidence supporting their second messenger function.
The “HO activity, heme substrate concentration, and the endogenous rate of CO tissue production” section reviews available information about the rate of endogenous tissue CO production that might serve a messenger function. There have been only a few, inexact measurements of this critical factor that determines the tissue CO concentration. In this review, it will be stressed that the vast majority of the total CO produced
in the body results from the routine turnover of Hb and other tissue (eg, hepatic) hemes; only a very small fraction of the total CO endogenous production possibly could be designed to serve a specific CO signaling function.
The “Quantitative modeling of the steady state and time-dependent tissue CO in the presence of the blood sink” sec-tion describes a quantitative model of the steady state and time-dependent tissue CO concentrations that result from the balance between the endogenous tissue CO production and the rate of diffusion to the blood sink. This calculation is designed to mimic the physiological effect of local tissue HO activity. Although the model is a crude approximation of the complicated tissue–blood interaction, it provides the first analysis of the basic requirements necessary for a CO signaling mechanism, in particular, the large rates of local endogenous CO production required for signaling.
Finally, the “Discussion: does HO function via its release of CO?” section summarizes the results of this analysis and their implications for interpreting the function and impor-tance of CO signaling. This analysis places limits on the possible second messenger role of CO and raises questions about the validity of some conventionally accepted views of CO signaling.
Hb and Mb CO binding
and pharmacokinetics
Table 1 lists the important quantitative CO parameters that will be used in this review. The aqueous solubility (α) allows one to convert from the partial pressure in the gas phase (P) to the molar free concentration (c) in the solution with which the gas is in equilibrium:
c=αP (2)
The biologically important concentration of CO that drives reactions, receptor binding, or diffusion is c, the free (unbound) concentration of CO that is dissolved in the tissue fluid or plasma. The free concentration of CO is not directly measured, but rather the PCO is determined and is then used to calculate the free concentration via use of the solubility coefficient. Using an α=1.1 µmol/L/mmHg (Table 1), a 1 µM free solution CO concentration corresponds to a 0.9 mmHg (or 1,188 parts per million [ppm]) partial gas pressure.
The concept that CO serves a signaling function is largely derived from the observation that tissue function is altered by in vitro or in vivo exposure to CO. Such alterations could reflect a specific messenger function or a non-specific toxicity of this gas. To differentiate between these two possibilities, it
Clinical Pharmacology: Advances and Applications downloaded from https://www.dovepress.com/ by 118.70.13.36 on 21-Aug-2020
Dovepress
Levitt and Levitt
is necessary to know the concentration of free CO that exists in tissue at baseline and following CO administration, values that are dependent on CO–O2 binding competition in Hb and tissue heme proteins. Classical CO toxicity is mediated via binding to Hb, with a resultant decreased O2 delivery to the tissues. This binding is quantitated by the fraction of CO-bound Hb (HbCO). Since standard whole-animal experimental CO administration is usually achieved via a short-period CO inhalation, it is important to understand the time dependence of the change in HbCO during and following this CO exposure, and its effect on tissue O2 delivery. In addi-tion, since CO and O2 compete for COX binding, a decreased tissue oxygen partial pressure (P
O2) results in an increased
CO–COX binding. The following analysis presents a detailed description of the complex non-linear relationship between HbCO versus PCO and P
O2. When analyzing this relationship,
it is crucial to recognize that CO and O2 are competing for the same heme binding sites.
For Mb, where there is just one binding site and no signifi-cant cooperative binding (Hill coefficient =1), the equation for the fraction CO (MbCO) and O2 (MbO2) bound has the following standard competitive binding form:14
MbCO P
P P P
MbO pO
P P P
CO
O Mb CO CO Mb O Mb CO =
+ +
=
+ +
2
2
50
2 2
50
/M ( )
( /M )
/M ( )CCO (3)
The binding is characterized by the two parameters, (P50)CO, the partial pressure for 50% binding of CO in the absence of O2, and MMb, which is the affinity of CO relative to O2:
M MbCO
P P
Mb
CO O
= /
/
MbO2
2
(4)
The corresponding (P50)
O2 is MMb× (P50)CO. In the
follow-ing calculations, values of (P50)CO=0.07 mmHg and MMb=39 will be used (Table 1).14
For Hb, where there is cooperative binding between the four heme sites, the fraction of CO (HbCO) and O2 (HbO2) bound can be approximately described by a variant of the Adair equation:14
HbCO M P A z A z A z A z
A z A z A z A z
Hb CO
= + + +
+ + + +
( /z)
[
1 2 2 3 3 4 4 1 2
2 3
3 4
4
2 3 4
4 1 ]]
( / )
[ ]
HbO P z A z A z A z A z
A z A z A z A z
O
2
1 2 2
3 3
4 4 1 2
2 3
3 4
4
2
2 3 4
4 1
= + + +
+ + + + (5)
where z = P
O2+ MHbPCO and MHb is the affinity of the heme
subunit for CO relative to O2 and is defined by the Haldane relationship:
M HbCO HbO
P P
Hb
CO O
= /
/
2
2
(6)
This equation assumes that CO and O2 compete for each of the four heme sites with the same relative affinity for MHb and that the cooperativity of binding is identical for O2 and CO. The following set of parameters will be used here:15,16
MHb=220; A1 =0.0218; A2=0.000912; A3=3.75×10⁻⁶; and
A4=2.47×10⁻⁶.
Although Equation 5 is not precise because the coop-erativity of CO differs slightly from that of O2 and the Adair equation is not exact, even for pure oxygen,15,16 it is
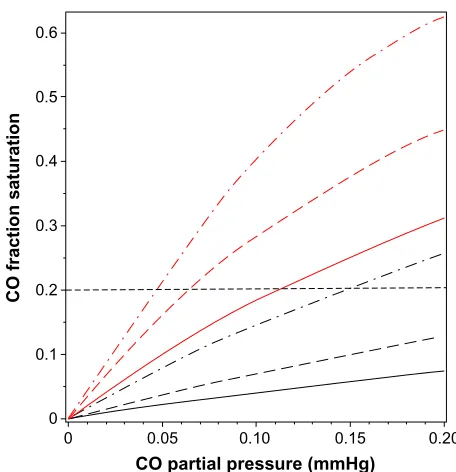
a quite good approximation and will be used in the follow-ing calculations to illustrate the physiologically important interactions between PO2, PCO, and the fraction of Hb that is occupied by CO (HbCO) in human blood. Figure 1 shows a plot of Equations 3 and 5 for HbCO (red lines) and MbCO (black lines) as a function of the PCO for PO2 value of 95 (solid line), 50 (long-dashed line), and 20 mmHg (dot-dashed line). The competition between CO and O2 implies
0.6
0.5
0.4
0.3
0.2
0.1
0
0 0.05 0.10
CO partial pressure (mmHg)
CO fraction saturation
0.15 0.20
Figure 1 Plot of fraction of hemoglobin (red lines) and myoglobin (black lines) that
is occupied by CO as a function of PCO, for a fixed PO2 of 95 mmHg (solid lines),
50 mmHg (long-dashed lines), and 20 mmHg (dot-dashed lines). The black, horizontal
dashed line indicates that for a fixed HbCO fraction of 0.2, the equilibrium PCO is
0.112 mmHg for a PO2 of 95 mmHg, and decreases to a PCO of 0.047 mmHg when
the PO2 decreases to 20 mmHg.
Abbreviations: PO2, O2 partial pressure; Hb, hemoglobin; HbCO, CO-bound Hb;
PCO, CO partial pressure.
Clinical Pharmacology: Advances and Applications downloaded from https://www.dovepress.com/ by 118.70.13.36 on 21-Aug-2020
Dovepress Carbon monoxide signaling
that, in the steady state, the PCO in the capillary (eg, tissue) is significantly less than the arterial PCO because the lower capillary P
O2 leads to a greater HbCO affinity. Since the
body is a closed system with most of the CO bound to Hb (see discussion of equation 10), the value of HbCO remains relatively constant as the blood moves from the artery to the capillaries. As illustrated in Figure 1, for a fixed HbCO of 0.2 (horizontal dashed line), as the P
O2 decreases from
95 (artery) to 20 (vein) mmHg, the PCO falls from 0.112 to 0.047 mmHg.
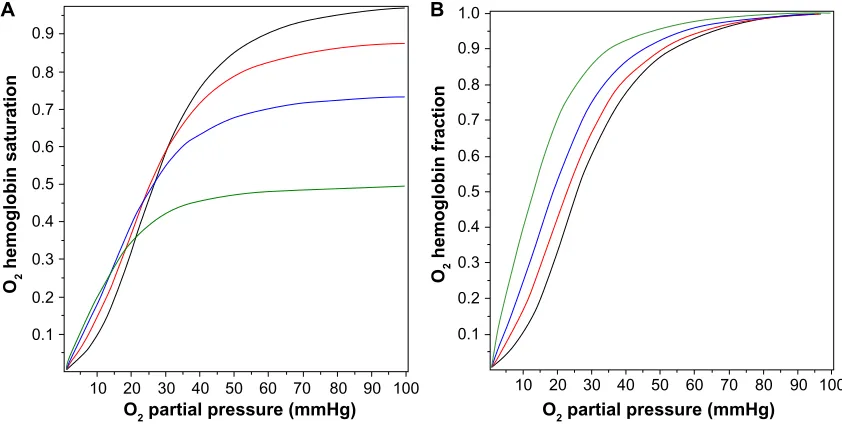
Figure 2A shows the O2 Hb saturation (HbO2) as a function of P
O2 in the presence of a PCO of 0, 0.1, 0.2, and 0.5 mmHg,
as determined by Equation 5. The presence of CO not only reduces the value of HbO2, CO also changes the shape of the O2 dissociation curve, shifting it to the left. This shift is seen more clearly in Figure 2B, where the O2 saturation relative to the maximal O2 saturation at P
O2=100 mmHg is
plotted, instead of the absolute saturation, which is plotted in Figure 2A. The P
O2 for 50% of maximum binding falls from a
normal value of 26 mmHg in the absence of CO to 12.6 mmHg for a PCO of 0.5 mmHg. Thus, CO produces tissue anoxia not simply by displacing O2 from Hb but also because the tissue O2 must fall to lower values in order to release the O2 that has not been displaced.
A critical concept central to this review is that the blood, which serves as a CO sink for all tissues, normally maintains a very low PCO. Venous blood PCO in humans can be estimated from the normal venous HbCO value of 0.8% and by applying
Equation 6 to venous blood (P
O2=40 mmHg; HbO2 =0.75
mmHg; MHb=220 mmHg):
P P HbCO
M HbO
x
x mmHg
CO O
Hb
= 2 ≈ =
2
40 0 008
220 0 74 0 0019 .
. . (7)
Probably the best direct experimental measurement of human blood PCO is the breath holding end alveolar PCO value of 2.44 ppm (0.0018 mmHg) obtained by Furne et al.17 This value
should be close to equilibrium with the average pulmonary capillary blood. These values are summarized in Table 1.
The classical approach to administering CO in experimen-tal studies is via inspired air. To extrapolate from alterations in cell function observed in such studies to potential signaling mechanisms induced by endogenous CO production, it is necessary to know the cellular PCO that results from CO inhalation. Although the time-dependent pharmacokinetics are complicated, with a CO pulmonary diffusion limitation and varying rates of distribution to the different organs and tissues, a surprisingly simple expression derived by Coburn et al18 provides a good approximation. The long-time steady
state (HbCO)ss can be obtained by application of the Haldane relation (Equation 6) to the pulmonary capillary blood:
(HbCO)ss =MHbHbO I2 CO/AO2 (8)
where ICO is the inspired alveolar PCO, AO2 is the average pulmonary capillary PO2, and HbO2 is the average pulmonary capillary HbO2 saturation. Using the approximate relations
0.9 A
0.8
0.7
0.6
0.5
0.4
0.3
0.2
0.1
0.9 1.0 B
0.8
0.7
0.6
0.5
0.4
0.3
0.2
0.1
10 20 30 40 50 60
O2 partial pressure (mmHg) O2 partial pressure (mmHg)
O2
hemoglobin saturation O hemoglobin fraction2
70 80 90 100 10 20 30 40 50 60 70 80 90 100
Figure 2 Fractional saturation of hemoglobin occupied by O2 as a function of the PO2 for PCO fixed at 0 mmHg (black line), 0.1 mmHg (red line), 0.2 mmHg (blue line), and
0.5 mmHg (green line). in (A), the absolute O2 saturation of the total hemoglobin is plotted, while in (B), the fraction saturated with O2 relative to the maximum O2 saturation
at PO2=100 mmHg is plotted.
Abbreviations: PO2, O2 partial pressure; PCO, CO partial pressure.
Clinical Pharmacology: Advances and Applications downloaded from https://www.dovepress.com/ by 118.70.13.36 on 21-Aug-2020
Dovepress
Levitt and Levitt
that HbCO + HbO ≈1 and A
O2≈100 mmHg for breathing
room air:
(HbCO)ss ≈M IHb CO/(100+M IHb CO) (9) That is, the steady state HbCO for an arbitrary value of inspired alveolar PCO (also known as ICO) can be estimated simply from the value of MHb (≈220). This represents the con-tribution from exogenous inspired CO. The total blood HbCO is the sum of this term plus the baseline endogenous HbCO. The time-dependent change in blood HbCO in response to inhaled CO (neglecting the endogenous CO production) is well approximated by a single exponential, based on the assumption that the total body CO volume of distribution can be represented by a well-mixed blood volume (Vb).18
HbCO HbCO e
T M V HbO
D P
V A
ss
t T
Hb b
L Atm
A O
= −
= +
−
( ) ( )
[ ]
/
1 1
2 2 (10) where DL is the CO lung diffusivity, PAtm is the atmospheric pressure corrected for vapor pressure of water (713 mmHg),
VA is alveolar ventilation, Vb is the effective blood volume, and [HbO2] is the average pulmonary capillary blood O2 concentration in mL STP/mL blood. Equations 9 and 10 provide good fits to the time-dependent experimental data in humans for inhaled CO ranging from 25 ppm (0.019 mmHg) to 500 ppm (0.38 mmHg), assuming that [HbO2] =0.2 and A
O2=100 mmHg.19 The major simplifying assumption of
this model is that the total body CO volume of distribution can be represented by an “equivalent” Vb. This explanation is a good approximation, because the vast majority of the total body CO binding is provided by Hb, eg, in humans there is roughly 800 g Hb, versus only 34.7 g Mb and much lower concentrations of other cellular hemes (eg, 0.78 g COX).20 Since Hb has the highest CO affinity (Table 1 and
Figure 1), at least 94% of the total body CO is in the blood. A second assumption is that [HbO2] is constant during the entire CO inhalation time course. This is clearly incorrect if the CO concentration is high enough to saturate a sig-nificant fraction of Hb. Bruce and Bruce21 have described
a much more detailed, multi-compartment, physiologically based pharmacokinetic model that, presumably, is more accurate. However, the experimental data are probably not good enough to distinguish them from the simple model described above.
From Equation 10, the time constant T for humans (DL≈30 mL/min/mmHg; Vb≈5.5 L; and VA≈6 L/min) is about
360 minutes, which is in good agreement with experimental data.19 It is of interest to see how this time constant scales
for different animals, in particular the rat and mouse, which are the commonly used experimental models. Neglecting the 1/DL term (assume lung diffusion is infinite), which is only 30% of the PAtm/VA term, the T for animal x relative to the human is given by:
T T V V
V V x human b A x
b A human
/ ( / )
( / )
= (11)
Using values for the rat (Vb=0.07 g/g,22 and V
A=0.39 mL/ min/g23) and the mouse (V
b =0.09 g/g,22 and VA=0.81 mL/min/g23), and (assuming dead space is 33% of tidal
volume), the CO time constant is 70 minutes and 43 minutes for the rat and mouse, respectively. This value for the rat is in rough agreement with direct experimental measurements.24
A common experimental model is to expose mice to 250 ppm CO for a period of 1 hour, and from the above estimate of T, at the end of the hour, mice should have reached 75% of their steady state value.
COX binding and ROS formation
Although there are hundreds of heme proteins25 that could
potentially be modified by CO, the only major proteins with well-characterized, relatively high affinity CO binding are Hb, Mb, cytochrome P450, and COX26 (refer to the “Specific
CO sensors or receptors” section for a further discussion of other possible minor CO binding proteins). Of the four com-plexes in the electron transport chain, three of which contain heme proteins, only complex IV (otherwise known as COX) is significantly inhibited by low levels of CO.27 Historically,
COX has been the major focus of studies of cellular CO tox-icity. The quantitative aspects of the binding of CO to COX are of particular importance because this binding produces a non-specific asphyxiation of all cells. When investigating the actions of CO, it is essential to distinguish this general COX inhibition from the more directed, specific CO signaling mechanisms that are discussed in the “Specific CO sensors or receptors” section. This “toxicity” has recently taken on special importance because of a number of reports of altera-tions of physiological function induced by surprisingly low doses of CO (eg, 250 ppm for 1 hour, see Discussion sec-tion). These effects have been attributed to the formation of ROS produced by CO inhibition of COX, the last step in the electron transport chain,28 as opposed to an effect attributable
to a conventional messenger function in which CO binds to a specific CO receptor.
Clinical Pharmacology: Advances and Applications downloaded from https://www.dovepress.com/ by 118.70.13.36 on 21-Aug-2020
Dovepress Carbon monoxide signaling
As was the case for Hb and Mb, O2 and CO are compet-ing for the same bindcompet-ing site in COX. Uscompet-ing purified COX, Petersen29 showed that CO behaves as a classical competitive
enzyme inhibitor of O2, with the activity (V) characterized by the O2 Km and the CO inhibition constant (Ki):
V V P
K P K P
V P
M P P P
m O m CO i O
m O
COX CO O O
=
+ + = + +
2 2
2
2 2
1 50
( / ) ( )
(12) The second equality is in the same form used to describe CO binding to Mb (Equation 3), with (P50)
O2= Km and MCOX=
Km/Ki. The fraction of COX inhibited by the addition of a given PCO to a medium with a fixed P
O2 is described by an equation
similar to Equation 3, with (P50)CO equal to the Ki of CO:
CoxCO P
P K P
M CO CO i
O COX
=
+ + 2 (13)
It can be seen from Equation 13 that the fractional COX inhibition by CO is critically dependent on the P
O2 at the
COX binding site. At high PCO and P
O2, the Ki term in the
denominator is negligible, and the fraction CO inhibition is characterized by MCOX.
The CO Ki of COX is about 0.3 µM (or 0.27 mmHg).29,30
Yoshikawa et al31 directly measured CO binding to purified
anaerobic COX using infrared spectroscopy and found a Kd of 0.3 µM, identical to the CO Ki, as is predicted for a simple competitive inhibitor. Wohlrab and Ogunmola32 found
a similar Kd of 0.46 µM (or 0.42 mmHg) for CO binding to COX in intact liver mitochondria. The corresponding Km (or Kd) of mitochondria for O2 is less certain and varies with the metabolic state, but is probably in the range of 0.1 to 0.8 µM.33,34 Petersen29 found a K
m for O2 of 0.75 µM using
the same purified COX enzyme assay used to determine the Ki of CO. Using this value of Km, the value of MCOX should be 0.75/0.3 or 2.5. These values of Km, Ki, and MCOX will be used throughout this report.
This apparently high CO–COX affinity of 0.3 µM (or 0.027 mmHg; or 35 ppm) does not, at first, seem consistent with the classic observation that CO has relatively minor effects on the rate of O2 consumption of whole organs.35,36
For example, Glabe et al,36 using isolated saline perfused rat
hearts, measured the maximum O2 consumption and cellular adenosine triphosphate (ATP) and phosphocreatine using proton nuclear magnetic resonance and found no signifi-cant change in any of these variables, even for a saline PCO
as high as a 100 mmHg (with a saline P
O2 of 540 mmHg).
Assuming that the P
O2 at the COX binding site is 100 mmHg
for this perfusion P
O2 of 540 mmHg, and using Equation 13,
one would predict that a PCO of 100 mmHg should produce about a 70% COX inhibition. However, this 70% COX inhibition would not be expected to have a major effect on organ oxidative metabolism because of the “branching” and “cushioning” phenomena originally described by Chance et al.37 Even though most of the COX is inhibited by CO, the
remaining uninhibited COX can branch out and oxidize the neighboring CO-inhibited COX chains, leading to relatively normal ATP synthesis.33,37,38
A major focus of recent CO signaling research is the formation of ROS secondary to COX inhibition by CO. Zuckerbraun et al28 have shown that relatively low
concentra-tions of CO (1 hour exposure to 250 ppm, or 0.19 mmHg) in a cell culture system produced a large increase in ROS formation, seemingly due to CO inhibition of COX. There is no evidence that other heme-containing enzymes that assist in the removal of ROS (eg, superoxide dismutase [SOD] or catalase) are inhibited by these CO concentrations. Normally, there is a small basal leak of ROS from the respiratory trans-port chain complexes I–III that feed into COX (complex IV), and this leak is markedly increased when COX is partially inhibited, presumably because of a blockade at the terminal step accompanying a buildup in the electron driving pressure.39
Nitric oxide (NO) also inhibits COX (in a somewhat different manner), but this inhibition is not thought to be a major NO signaling pathway, because NO–COX affinity is 50-fold less than the affinity of NO for guanylate cyclase.38
Although ROS production historically has been regarded as a pathologic process, it recently has been proposed that ROS can serve as an important signaling mechanism.40,41 If
so, CO-induced COX inhibition should be considered to be a physiological process, with the resultant ROS formation being the best validated CO second messenger system. As discussed, large increases in ROS generation can occur with minimal changes in overall respiration, thus providing the putative messenger in the absence of cell asphyxiation. The “specificity” of this ROS release presumably would be deter-mined by the cellular systems that are modified by increased ROS exposure. ROS release is remarkably sensitive to low CO exposures. Thom et al42 measured rates of cell death
and the cellular levels of antioxidant enzymes such as SOD as a function of time after short exposures to CO in a cell culture system. Just a 1-hour exposure to 100 ppm CO (or 0.08 mmHg) resulted in a significantly increased ROS and an increase in cell death at 18 days. A 1-hour exposure to
Clinical Pharmacology: Advances and Applications downloaded from https://www.dovepress.com/ by 118.70.13.36 on 21-Aug-2020
Dovepress
Levitt and Levitt
10 ppm CO did not increase death rates, but was associated with a 3-fold increase in SOD levels, which were, presum-ably, a surrogate signal of increased ROS formation. This 10 ppm CO (0.008 mmHg) is only 4× the normal blood level and is commonly observed in smokers.43
The quantitative relationship between COX binding and ROS release is poorly understood. Not commonly considered is that competition between O2 and CO for COX (Equation 13) makes this relationship strongly dependent on the P
O2 at the
COX binding site. In the typical cell culture experiments in petri plates42 or 96-well tissue culture plates28, the effective cell
P
O2 is poorly characterized. Peng and Palsson44 have shown
that these tissue cultures at high cell density may become oxygen limited, ie, the P
O2 at the COX site may be close to
0 mmHg. Using the CO Ki of 0.27 mmHg and Equation 13, the maximum possible COX–CO (ie, within the limit as P
O2
approaches 0 mmHg) is 2.7% for the 10 ppm CO (0.0076 mmHg) in the Thom et al42 experiment and 41% for the 250
ppm CO in the Zuckerbraun et al28 experiment. This last
pre-diction is in good agreement with the 50% COX inhibition directly measured by Zuckerbraun et al28 at 250 ppm CO.
Despite this 50% COX inhibition, Zuckerbraun et al28 found
that there was no significant change in cellular ATP, consistent with the classic “branching” effect Chance et al37described.
If this quantitative analysis is correct, it indicates that very small fractional CO–COX binding (eg, 2.7%) can have significant physiological effects, presumably by producing a relatively large change in the rate of ROS production. It also implies that, specifically, it is important to consider the competing O2 concentration when evaluating CO actions. For example, Zhang et al45 have shown that CO concentrations of
only 15 ppm have a major anti-apoptotic effect on cultured cells that have undergone an anoxia–reoxygenation protocol, consistent with the prediction that CO–COX inhibition will be maximized in anoxic conditions.
Specific CO sensors or receptors
Initially, a second messenger role for CO was based on the concept that this gas interacted with specific receptors and thus might have a variety of specific actions (in contrast to the non-specific activity that seemingly would result from COX inhibition). However, there are surprisingly little data with regard to the identity or structure of such CO receptors. Initial enthusiasm for a messenger role for CO was based on the demonstration that exposure to this gas activated soluble guanylate cyclase (sGC), a heme-containing protein, resulting in production of cyclic guanosine monophosphate (analogous to the action of NO).46,47 This concept was based
on the demonstration of the activation of whole cell K+
cur-rents in corneal epithelial cells and jejunal smooth muscle, when equilibrated with a very high PCO of 7.6 mmHg.47,48
Subsequent observations showing that CO produced only a maximum 4.4-fold activation of purified sGC compared to the 130-fold activation with NO48 and that the sGC–CO affinity
was low (with a Km of about 10 µM49) raised serious doubts
about sGC as a mediator of CO action.50 This sGC example
is illustrative of a major limitation of many proposed specific CO second messenger actions. The observed responses to CO could simply be a non-specific reaction to the tissue asphyxi-ation that results from the massively superphysiological CO concentrations employed (eg, 7.6 mmHg in the sGC example, which is 4,000× the normal plasma CO).
The classical second messenger reacts with a receptor that provides specificity to the signaling. Given the extensive lit-erature ascribing a messenger function for CO, there is a sur-prising paucity of data identifying the CO-specific receptors. The best understood CO-mediated regulatory protein is the bacterial transcription factor CO oxidation activator (CooA), whose structure and function have been characterized in great detail.9,51 This protein is a CO-sensitive transcription
activa-tor in the bacterium Rhodospirillum rubrum, which can live on CO in anaerobic conditions. The activation of CooA is specific for CO and does not occur with O2, indicating that heme binding sites can be specific for CO sensing. The only reported homologous mammalian protein is involved in the neuronal circadian rhythm control system,52 and there is
sug-gestive evidence that CO may have a role in the mammalian control of diurnal rhythm.53–55 The CooA affinity is relatively
low, with a P50 of 2.2 µM (or 2 mmHg),56 about 1,000× higher
than the normal blood CO (Table 1), and, as discussed in detail in the “Quantitative modeling of the steady state and time-dependent tissue CO in the presence of the blood sink” section, it is unlikely that normal tissue concentrations can reach this level.
The best characterized mammalian high-affinity CO receptors are the large conductance Ca++- and
voltage-activated K+ channels (BK
Ca, also referred to as Slo1 or
MaxiK), which are expressed in almost every cell type and are involved in vasodilation, oxygen sensing, neuronal excit-ability, transmitter release, and multiple other functions.57 The
strongest evidence that BKCa channels are CO receptors is that they can be activated by 1 µM CO in excised cell mem-brane patches that are free of COX, and presumably, other regulatory heme proteins.58,59 The main experimental focus
has been on the involvement of this regulatory system in the control of smooth muscle vascular resistance, reviewed
Clinical Pharmacology: Advances and Applications downloaded from https://www.dovepress.com/ by 118.70.13.36 on 21-Aug-2020
Dovepress Carbon monoxide signaling
in great detail by Leffler et al.11 The most sensitive tissue
described to date is the piglet pial vessels, with applied concentrations as low as 0.1 µM (0.09 mmHg) producing a transient dilatation.60 Arterioles in adult pigs and in other
mammals of all ages are appreciably less sensitive to CO.61
For example, the rat tail artery model requires CO concentra-tions of about 10 µM to produce a relaxation that is about 25% of the maximum CO-induced relaxation.62 The constitutive
form of HO (HO-2) is expressed in high concentrations in central nervous system arterial endothelial cells and in their closely associated astrocytes,62 and the inducible form (HO-1)
is highly expressed in peripheral vascular smooth muscle.63
The structural mechanism of the CO activation of BKCa is not well understood, but seems to involve an interaction between BKCa and cellular heme.58,64 A similar interaction of a
calcium-activated potassium channel, heme, and CO has been described in a plant (pollen tube) system,65 suggesting that
this CO regulatory mechanism may have an ancient lineage. Based on the above, it appears that tissue HO must raise the local tissue CO to at least 0.1 µM to activate arteriolar BKCa. The physiology required for the generation of such a tissue concentration in the face of diffusion to blood is addressed quantitatively in the “Quantitative modeling of the steady state and time-dependent tissue CO in the presence of the blood sink” section.
Oxygen is a substrate for the HO reaction (Equation 1), and it has been suggested that HO is the carotid body O2 receptor, with high O2 increasing HO activity that then increases the rate of CO production, activating a BKCa channel.66 One difficultly with this concept is that HO has
a very high O2 affinity, with a P50 of 0.013 to 0.03 µM,67
corresponding to a P
O2 of 0.0094 to 0.022 mmHg (using
an O2 solubility of 1.38 µmol/L/mmHg68), far below the O 2
sensitivity range of the carotid body. A further complication is that HO knockout mice apparently have normal carotid body oxygen sensing.69
There is also suggestive evidence that the epithelial Na+
channel (ENaC) is a high-affinity CO receptor. The ENaC activity of excised membrane patches from mouse kidney cortical collecting duct cells is stimulated by the addition of soluble heme at a concentration similar to that in the intact cell, with a Kd of 23 nM, and this heme activation is increased by the addition of CO at concentrations as low as 0.1 µM.70 In addition, O
2 is required to maintain the
stimula-tory effect of heme, suggesting that the CO production by membrane-associated HO is required for the heme–ENaC interaction and that this system might be another O2 sensor.70
A potentially important clinical application of CO is based
on the observation that inhalation of CO at concentrations of only 100 ppm (0.076 mmHg; 0.084 µM) provides pro-tection against hypoxic lung injury.71 It has been proposed
that ENaC is the receptor responsible for this protection,72
and Althaus et al72 demonstrated that ventilation of isolated
rabbit lungs with 250 ppm CO (0.19 µM) decreased alveolar sodium absorption and fluid clearance. Although they also showed that CO inhibited the apical amiloride-sensitive current (presumably ENaC), this might be an indirect result of inhibiting COX, since it required very high concentra-tions (100 µM) of a CO-releasing molecule, CORM-3.73
Extrapolation from such studies to a messenger role for endogenously produced CO requires demonstration that locally produced CO raises the tissue CO concentration to levels comparable to those achieved with exogenous administration of CO.
Although CO has been proposed to be a regulator of many other ion channel types, including voltage-activated K+, L-type Ca++ channels, ligand-gated P2X receptors, and
TREK1 P domain K+ channels, the evidence that these
channels are specific CO receptors is much weaker.73 One
limitation of many of these studies is that the exact CO concentration used has not been well-characterized, because the CO was administered as various forms of CO-releasing molecules (CORMs).73 These molecules release CO, either
spontaneously or when exposed to light,74 in cell culture
media or organ perfusion systems. The resulting CO concen-tration depends on the balance between the rate of CORM CO release and the rate of loss of CO to the environment, factors that are poorly characterized. Depending on the CORM molecule used and the environmental conditions (eg, pH), these agents release CO with half-times varying from a few minutes to hours.75 A conventional application is to use
a CORM bathing concentration of 30 µM, which could pro-duce a CO concentration ranging from 30 µM, if completely and rapidly released, down to much lower concentrations if released slowly. However, the final CO concentration is unlikely to be less than about 5 µM, a relatively high con-centration that markedly inhibits COX. Consistent with this evidence, there is suggestive evidence that the CO activation of the L-type Ca++ channel76 and the delayed rectifier Kv2.1
potassium channel77 are secondary to COX inhibition and
the corresponding ROS production.
The binding of CO to several clotting factors (fibrino-gen, plasmin, and α2-antiplasmin) results in increased rate of clot formation and stronger clots.78 It is thought that the
CO interacts with these proteins via an associated heme.79,80
Since the CO concentrations required in in vitro assays are
Clinical Pharmacology: Advances and Applications downloaded from https://www.dovepress.com/ by 118.70.13.36 on 21-Aug-2020
Dovepress
Levitt and Levitt
very large (eg, 50 µM CORM80), it is unlikely that this CO
binding is physiologically significant.
HO activity, heme substrate
concentration, and the endogenous
rate of CO tissue production
As discussed in the “Specific CO sensors or receptors” section, the lowest PCO concentration shown to produce an observable specific second messenger effect in the most sen-sitive tissues (pig pial vessels) is about 0.09 mmHg (0.1 µM). Thus, the tissue CO concentration must be raised at least 50× (and in most systems 500×) higher than the usual blood concentration of 0.0019 µM (Table 1) to produce a physi-ological response. In other words, CO production by tissue HO must be sufficiently rapid to at least temporarily maintain a concentration of 0.1 µM in the presence of diffusion to the local blood sink. This section and Table 2 summarize the very limited available experimental data on the rates of the endogenous tissue CO production rates.
Whole animal measurements of CO production provide insight into the maximal possible rate of second messenger CO production. The first entry in Table 2 is the total rate of human
CO production of about 0.27 nmol/g/h.81 Of this, about 75%
is accounted for by red cell turnover, and another 10%–15% is produced by the liver (eg, cytochrome P450 turnover).82
To this should be added the basal turnover of the rest of the body’s heme. For example, a 70 kg human has about 30 kg83
of muscle containing about 4.4 g Mb/kg muscle,84 or a total
of 7.8 mmole of Mb. If this muscle Mb turns over just once/ year it would release about 0.012 nmol/g/h, or another 5% of the total CO turnover. In addition, another 5%–10% of the total production could result from the turnover of muscle cytochrome. Thus, the routine “housekeeping” turnover of heme can readily account for the entire CO output of healthy subjects, and CO produced for signaling can only be a trivial fraction of the normal total production. For the purposes of discussion in this paper, we will assume that a maximum 7.5% of the total daily CO production, or about 0.02 nmol/g/h, could possibly be associated with specific CO second messenger signaling. This value, which is possibly an overestimate, will be referred to as the MaxCO rate (Table 2).
Endogenous tissue CO production is severely substrate limited. Tissue HO activity assayed in the presence of excess substrate (hematin) releases CO at a rate thousands of times greater than MaxCO (Table 2). Even a tissue with a relatively low HO activity, such as the heart, in the presence of unlim-ited substrate, produces CO at a rate that is 4,800× MaxCO. These tissue HO assays measure the total HO activity (HO-1 plus HO-2). Tissue HO activity is variable because HO-1 induction results in marked changes in the total activity, with 5-fold increases measured in whole liver85 and 10-fold
increases seen in cell culture.86
In theory, if the physiological endogenous tissue heme substrate concentration was known, HO enzyme activities could be used to predict endogenous CO production. However, since there is very little knowledge of what constitutes the heme source for signaling reactions, much less the effective concentration of this substrate, it is not possible to predict CO production from HO activity, and such information must be derived from direct measurements of tissue CO release.
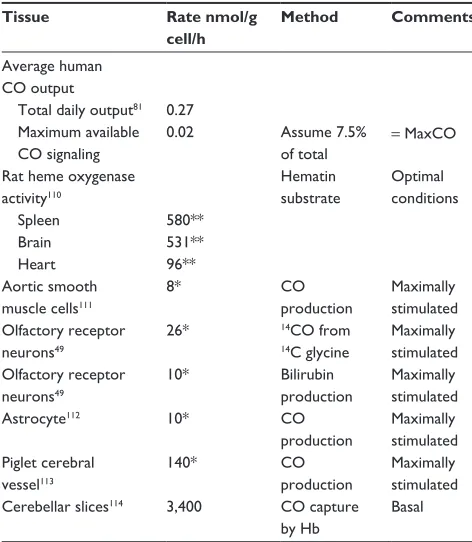
There have been only a few direct experimental measure-ments of endogenous CO tissue production in the absence of additional heme substrate (summarized in Table 2). Since CO production is low under physiological conditions, virtually all non-heme-enriched studies have employed non-physiological conditions (eg, enrichment with glutamate) to enhance CO release. It can be seen from Table 2 that the reported local tissue production rates are from 400 to 170,000× greater than MaxCO. The non-physiological nature of some of these val-ues is illustrated by the production rate reported for cerebellar Table 2 Hemoxygenase activity and endogenous CO production
rates
Tissue Rate nmol/g
cell/h
Method Comments
Average human CO output
Total daily output81 0.27
Maximum available CO signaling
0.02 Assume 7.5%
of total
= MaxCO
Rat heme oxygenase activity110
Hematin substrate
Optimal conditions
Spleen 580**
Brain 531**
Heart 96**
Aortic smooth muscle cells111
8* CO
production
Maximally stimulated Olfactory receptor
neurons49
26* 14CO from
14C glycine
Maximally stimulated Olfactory receptor
neurons49
10* Bilirubin
production
Maximally stimulated
Astrocyte112 10* CO
production
Maximally stimulated Piglet cerebral
vessel113
140* CO
production
Maximally stimulated Cerebellar slices114 3,400 CO capture
by Hb
Basal
Notes: *Assume 0.1 g protein per g cell;115 **assume 0.05 g microsomes per g cell.116 Abbreviations: Hb, hemoglobin; MaxCO, estimated maximum average human CO
output rate available for messenger signaling, total CO output produced for CO messenger signaling.
Clinical Pharmacology: Advances and Applications downloaded from https://www.dovepress.com/ by 118.70.13.36 on 21-Aug-2020
Dovepress Carbon monoxide signaling
slices (3,400 nmol/g cell/h). Just 6 g of this cerebellar tissue would generate CO at the same rate as does the total human body. Obviously, these measurements cannot represent the average CO production of these tissues and must correspond to some sort of stimulated condition, presumably initiated by the experimental tissue conditions.
The next section, the “Quantitative modeling of the steady state and time-dependent tissue CO in the presence of the blood sink” section, discusses the tissue PCO produced by the endogenous tissue CO production. As a benchmark, the reported rate (M) of CO produced by piglet cerebral vessels (140 nmol/g cell/h; Table 2) will be assumed to be the best estimate of the maximum tissue M value. Since extrapola-tion of this rate to all cells in the body yields a value 7,000× greater than MaxCO, this putative messenger CO production rate must occur either in very limited tissue regions (eg, pial vessels) and/or for very short time periods. For example, just 10 g of tissue producing CO at this rate equals the maximum total human CO production rate available for signaling.
A neglected but important question is the nature of the heme substrate that supports this messenger CO production, a question that remains unresolved.87 Although a “free heme
pool” has been proposed, there is no evidence to support this proposal.87 Liver and erythroid cells are known to have
rapid rates of heme enzyme and Hb synthesis, respectively, and many of the details of the control of heme biosynthesis in these tissues are well understood. Although other tissues are thought not to possess extensive biochemical pathways dedicated to heme synthesis,87 this contention is not supported
by measurements of messenger ribonucleic acid (mRNA) levels of 5-aminolevulinic acid synthase-1, which is thought to be the rate-limiting step in heme synthesis, with the brain, kidney, and heart having 5-aminolevulinic acid synthase-1 levels at about 40% of the liver.88 There seems to be no
ques-tion that about 75% of the total human CO producques-tion (and correspondingly, heme production and breakdown) is due to red blood cell turnover, with most of the remaining CO production due to turnover of heme in the liver.89 The rates of
endogenous CO production listed in Table 2 for maximally stimulated tissues, if correct, correspond to huge rates of heme turnover. For example, of the total human daily CO production of 19 µmole/70 kg/h,81 about 15% takes place in
the liver,90 corresponding to a rate of liver CO production (or
heme synthesis and breakdown) of about 1.9 nmol/g/h. This rate is only 1/10th to 1/100th of the rates listed in Table 2 for arteriolar or nerve cells. Although these rates might be present for only relatively short time periods, they would still require large amount of heme synthesis. For example,
the major heme protein in smooth muscle is COX, with a maximal concentration of 30 nmol/g91 (smooth muscle has
very low Mb concentrations92). The reported pial arterial CO
production of 140 nmol/g/h (Table 2) would require turnover of the entire heme COX content of the arteriole wall (two hemes per COX) every 25 minutes. Clearly, much more study of the details of the heme substrate utilized by HO is required for an understanding of the biochemistry of the CO signaling mechanism.
Quantitative modeling of the
steady state and time-dependent
tissue CO in the presence
of the blood sink
As discussed, the local CO concentration required for a biological effect, eg, in piglet pial arterioles, is at least 50× greater than the blood concentration. Although it is conven-tionally assumed that such high tissue concentrations can be achieved locally via HO-catalyzed release of CO,10 the
quantitative requirements of this assumption have not been previously evaluated. In this section, a physical model of a tissue region bathed by the blood Hb sink will be presented. Two different geometric arrangements will be considered. The first, representative of an arteriole or artery, consists of a cylindrical shell (the arteriolar wall) with a blood-perfused lumen. The second is representative of a solid tissue (eg, brain) penetrated by an array of capillaries. Although both of these models are idealized, they provide first-order estimates of the predicted local tissue CO concentration as a function of the rate of production of CO and the geometric diffusion distances between tissue and blood.
Figure 3 shows a diagram of the arteriolar model. It is assumed that CO is produced at a uniform rate M throughout the wall of the pial arteriole or the rat tail artery. The PCO in the vascular lumen is fixed at PB, the normal blood value. It is assumed that the outer wall of the vessel is impermeable to CO. This assumption actually leads to an overestimate of the true concentration in the wall, because there will be some diffusion through the outer wall toward more distant circulating blood. For pial vessels, there may be an additional CO production from the astrocytes that form a sheath around the arteriole.93 Since this sheath is only about 1 µm thick,94
it will be assumed that it can be simply added to the vessel wall thickness.
In the steady state, the PCO in the vessel wall (P(r)) as a function of the radial distance (r) from the center of the vessel is described by the Krogh–Erlang equation (with a rate M of
Clinical Pharmacology: Advances and Applications downloaded from https://www.dovepress.com/ by 118.70.13.36 on 21-Aug-2020
Dovepress
Levitt and Levitt
CO production in place of the classically employed rate of oxygen consumption):95
P r P M
K R
r
a a r
B
( )= + ln +( − )
2 2
2 2 2 (14)
where PB is the blood PCO, a is the radius of the blood lumen, and R is the outer radius of the arteriole (plus astrocyte for pial vessels), which is equal to (a + T), where T is the wall thickness, and K is the Krogh diffusivity =αD, where D is the tissue CO diffusion coefficient and α is the CO solubility (K =1.77×10⁻⁵ nmol/cm/mmHg/s; Table 1). The maximum
tis-sue CO concentration (Pmax) is at the outer vessel wall (r = R):
P P M
K R
R
a a R
B
max = + ln +( − )
2 2
2 2 2
(15)
The pial arteriole radius (R) is about 30 µm,60,67 and
because the ratio of (arterial wall thickness)/R is about 0.2,96
T (including the 1 µm thick astrocyte) is about 7 µm, and a =23 µm. It will be assumed that PB is equal to the normal human blood value of 0.0019 mmHg (Table 1). Note that although most of the tissue CO is bound by tissue heme and is not free, this binding does not enter the steady state solution
(Equation 14), because only the diffusion of the free CO, characterized by the PCO, needs to be considered.
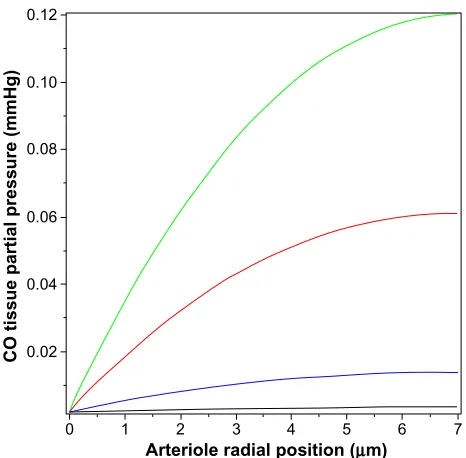
Figure 4 shows a plot of Equation 14 of the pial arteriole tissue PCO as a function of the radial distance from the inner wall of the vessel. (All calculations described here were per-formed using the Maple (Maplesoft®) plotting and equation
solvers). The solid lines correspond to different values of M, the rate of tissue CO production. It can be seen that for M =280 nmol/g tissue/h (the black line; twice the reported maximal experimental value for pial vessels), the maximum tissue PCO is only 0.0031 mmHg (63% greater than the blood), 30-fold less than the minimum PCO required for an observable biological effect (0.1 mmHg; Table 1). To raise tissue PCO to the biologically effective value of 0.1 mmHg requires an M of 28,000 nanomole/g tissue/h (green line, Figure 4), 200-fold greater than the maximal observed rate of pial arteriole tis-sue CO production. To put this requisite CO production rate (28,000 nmol/g/h) into physiological perspective, just 1.5 g of tissue producing CO at this rate for 1 hour would yield 7.5% of the total daily body CO production, which is the maximal estimate of the CO available for signaling in the entire human body. The above analysis indicates that the maximally observed rates of tissue CO production cannot raise the pial arteriolar PCO to the 0.1 mmHg value required for dilation, raising the question of what the function of this well-characterized CO response mechanism is. One possibility is that this CO response mechanism is only important during pathological PB
P (r)
Heme COM
R �
T r
a
Figure 3 Diagram of the model used to model the pial arteriole or the rat tail
artery. it is assumed that there is uniform rate of CO production (M) in the arterial wall (thickness = T). The outer wall of the artery is assumed to be impermeable to CO, and the diffusion of CO to the blood sink (PCO= PB) sets up a steady state PCO
gradient (= P(r)) in the vessel wall.
Abbreviation: PCO, CO partial pressure; P(r), CO partial pressure at radial position
r in arteriole wall; PB, CO partial pressure of blood; a, radius of arteriole lumen;
R, outer wall arteriole radius; T, arteriole wall thickness.
0.12
0.10
0.08
0.06
0.04
0.02
0 1 2 3 4
Arteriole radial position (µm)
CO tissue partial pressure (mmHg)
5 6 7
Figure 4 Steady state PCO in wall of pial arteriole as a function of the radial distance
from the blood surface for varying rates of tissue CO production (M) (black line =280, blue line =2,800, red line =14,000, and green line =28,000 nmol/g cell/h).
Abbreviation: PCO, CO partial pressure.
Clinical Pharmacology: Advances and Applications downloaded from https://www.dovepress.com/ by 118.70.13.36 on 21-Aug-2020
Dovepress Carbon monoxide signaling
conditions of low arterial perfusion, conditions when the blood would no longer function as an infinite sink. This is discussed in more detail in the concluding discussion (the “Discussion: does HO function via its release of CO?” section).
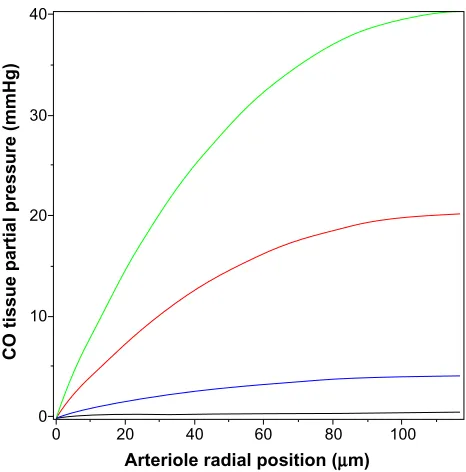
The value of the tissue Pmax (Equation 15) for a given rate of CO production increases as the thickness of the tissue-producing region and the distance the CO must dif-fuse to reach the blood sink increases. The relative thinness of the pial arteriole (plus astrocyte) wall (≈7 µm) is the major factor constraining the ability of endogenous produc-tion to raise the tissue PCO. The rat tail artery, another CO responsive experimental model,62 has a much thicker wall of
about 117 µm, with a luminal radius of about 93 µm,97 and
would be expected to have a much higher tissue PCO for a given endogenous production rate. (The walls of vessels of this size are apparently avascular98,99). However, the lowest
stimulatory CO concentration observed for these vessels is about 10 mmHg.62 Figure 5 shows the corresponding plot of
tissue PCO for a rat tail artery with these dimensions. It can be seen that the tissue PCO is much greater than that of the pial arteriole (Figure 4) for the same values of M. The low-est production rate plotted in Figure 5 is 280 nmol/g/h (35× the 8 nmol/g/h production rate observed for cultured aortic muscle tissue), which yields a Pmax of less than 0.4 mmHg. As shown in Figure 5, the CO production rate would have to be on the order of 14,000 nmol/g/h to develop a CO
concentration in excess of the 10 mmHg required for sig-nificant rat tail artery relaxation. Thus, even for this much thicker wall artery, the measured local rate of CO production is not sufficient to produce the 10 mmHg PCO values that are required for activation of the effector mechanism.
The above two cases of CO responsiveness in vessel walls are special cases that lend themselves to relatively straight-forward modeling. In contrast, most of the putative signaling actions of CO are for solid tissues, such as the brain,8 which
have much more complicated blood perfusion geometry. As a first approximation, the tissue CO in the brain tissue can again be modeled using the Krogh cylinder model,95 based
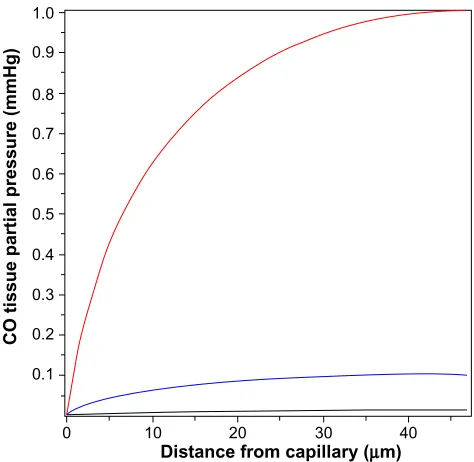
on the tissue cross-section shown in Figure 6. It is assumed that the capillaries have a symmetric hexagonal arrangement. Since the cylindrical surface represented by the dashed line in Figure 6 is equidistant between neighboring capillaries, there will be no diffusion of CO across this surface, and it can be assumed to be an impermeable barrier. Thus, the cross-hatched cylindrical region becomes mathematically identical to the arteriole wall (Figure 3), with a tissue radius R equal to one-half the intercapillary distance, and a radius (a) equal to the capillary radius. In the following calculation, it will be assumed that R =50 µm and a =3 µm, and that the capillary blood acts as a sink, with a PCO equal to that of the blood (PB). This value for R is about twice the anatomical value and assumes that only every other capillary is perfused at rest. Figure 7 shows the corresponding plot of the Krogh cylinder tissue PCO as a function of the radial distance from the capillary wall for tissue production rates (M) of 22, 220, and 2,200 nmol/g/h. It can be seen that in order to reach a CO Pmax of 1 mmHg (eg, the concentration required for BKCa channel activation) an M of about 2,200 nmol/g/h is required. This is 16× the maximal experimental pial artery M, and 220× the maximal M for astrocytes (Table 2), and 1 g of tissue producing CO at this rate would account for the total maximal rate of CO production potentially available for signaling purposes. Thus, it seems unlikely that endogenous tissue CO production could raise tissue PCO to 1 mmHg in the presence of a normal blood perfusion.
In contrast, to raise tissue CO Pmax (Equation 15) to the 10 ppm (0.0076 mmHg) required to produce a significant ROS signal (as described in the “COX binding and ROS formation” section) only requires an M of 13 nmol/g/h, roughly equal to the rate of CO tissue production of olfactory neurons or astrocytes (Table 2). This suggests that the control of ROS production is a realistic candidate for a CO signaling mechanism (as described in more detail in the “Discussion: does HO function via its release of CO?” section).
40
30
20
10
0
0 20 40
Arteriole radial position (µm)
CO tissue partial pressure (mmHg
)
60 80 100
Figure 5 Steady state PCO in wall of rat tail artery as a function of the radial distance
from the blood surface for varying rates of tissue CO production (M) (black line =280, blue line =2,800, red line =14,000, and green line =28,000 nmol/g cell/h).
Abbreviation: PCO, CO partial pressure.
Clinical Pharmacology: Advances and Applications downloaded from https://www.dovepress.com/ by 118.70.13.36 on 21-Aug-2020