DOI: 10.1534/genetics.105.040956
Evidence of a Major Gene From Bayesian Segregation Analyses of Liability to
Osteochondral Diseases in Pigs
Haja N. Kadarmideen*
,1and Luc L. G. Janss*
,†*Statistical Animal Genetics Group, Institute of Animal Sciences, Swiss Federal Institute of Technology, ETH-Zentrum, CH-8092 Zurich, Switzerland and†Animal Sciences Group, Wageningen University and Research Centre, 8200 AB Lelystad, The Netherlands
Manuscript received January 14, 2005 Accepted for publication July 9, 2005
ABSTRACT
Bayesian segregation analyses were used to investigate the mode of inheritance of osteochondral lesions (osteochondrosis, OC) in pigs. Data consisted of 1163 animals with OC and their pedigrees included 2891 animals. Mixed-inheritance threshold models (MITM) and several variants of MITM, in conjunction with Markov chain Monte Carlo methods, were developed for the analysis of these (categorical) data. Results showed major genes with significant and substantially higher variances (range 1.384–37.81), compared to the polygenic variance (s2
u). Consequently, heritabilities for a mixed inheritance (range 0.65–0.90) were much higher than the heritabilities from the polygenes. Disease allele frequencies range was 0.38–0.88. Additional analyses estimating the transmission probabilities of the major gene showed clear evidence for Mendelian segregation of a major gene affecting osteochondrosis. The variants, MITM with informative
priorons2
u, showed significant improvement in marginal distributions and accuracy of parameters. MITM with a ‘‘reduced polygenic model’’ for parameterization of polygenic effects avoided convergence prob-lems and poor mixing encountered in an ‘‘individual polygenic model.’’ In all cases, ‘‘shrinkage estimators’’ for fixed effects avoided unidentifiability for these parameters. The mixed-inheritance linear model (MILM) was also applied to all OC lesions and compared with the MITM. This is the first study to report evidence of major genes for osteochondral lesions in pigs; these results may also form a basis for under-pinning the genetic inheritance of this disease in other animals as well as in humans.
O
STEOCHONDROSIS (OC) is a term used to de-scribe a variety of joint diseases, all of which involve abnormal cartilage and/or bone development. These diseases can affect the shoulder, elbow, knee, or hock joints in animals. Degenerative osteoarthritis and necrosis will be a resulting outcome as abnormalities within the joint lead to further wear and tear and joint degeneration. Osteochondrosis is thought to have a multifactorial etiology but genetic factors that affect weight gain, growth rate, and body conformation/type are undoubtedly involved in the etiology of osteo-chondrosis (e.g., Kadarmideenet al. 2004). By virtue of its etiology, this disease affects all food animals such as cattle (e.g., Trostleet al.1997), pigs (Kadarmideen et al. 2004), and deer (Audige et al. 1995) and com-panion animals such as dogs (e.g., Nea` set al. 1999) and horses (e.g., BarneveldandvanWeeren1999), as well as humans (e.g., Seidleret al.2001).Modern food production programs from pigs need to consider osteochondrosis as recent findings suggest that selection for high growth and meat yield has an-tagonistic/unfavorable genetic effects on susceptibility
to this disease in pigs (Kadarmideenet al.2004). How-ever, breeding pigs for resistance to osteochondrosis would be difficult by conventional breeding programs due to low (polygenic) heritability and the high cost of data recording on the farm or station. Identification and use of quantitative trait loci (QTL) for OC disease may help in breeding for disease resistance but would need costly resource populations and QTL mapping experiments. Before such experiments, it is worthwhile to conduct a statistical analysis to test existing pheno-typic data on OC disease for evidence of a segregating major gene. Segregation analysis is the most powerful statistical method to identify a major gene, using only phenotypic data and without DNA marker informa-tion (e.g., Guoand Thompson1992; Jansset al. 1995, 1997; Thalleret al. 1996). Inbreeding and marriage loops in a typical segregation analysis using pedigreed populations make the exact computations of likeli-hoods or marginal densities impossible. This problem has been overcome by the development of a Bayesian method implemented via Gibbs sampling, a Monte Carlo Markov chain (MCMC) methodology (Guo and Thompson 1992), and the application of this meth-odology to livestock populations ( Janss et al. 1997; Haggeret al.2004; Ilahiand Kadarmideen2004) as well as to companion animals (Cargillet al.2004).
1Corresponding author:Statistical Animal Genetics Group, Institute of Animal Science, Swiss Federal Institute of Technology (ETH), Universi-taetstr. 65, ETH Zentrum (UNS D), ETH Zurich, 8092, Switzerland. E-mail: [email protected]
No investigations have been carried out so far to de-termine the mode of inheritance of osteochondrosis in animals (in particular, pigs) by a complex segregation analysis. In addition, the development and application of a ‘‘liability or threshold model,’’ in the context of segregation analysis of polygenic diseases in complex animal pedigrees with MCMC methods, have not been explored extensively.
The main objective of this study was to investigate whether inheritance of osteochondral diseases in pigs is determined as a mixed inheritance (of polygenes and a major gene) by the mixed inheritance threshold or liability models (MITM). The emphasis is on the de-velopment of the MITM method and investigation of its variants for segregation analysis of polygenic diseases observed as binary traits.
MATERIALS AND METHODS
Osteochondral disease: The company SUISAG provides herd book, field, and station tests and artificial insemination and conducts a national pig-breeding program in Switzerland. Detailed descriptions of breeding program and station-tested traits in SUISAG were given by Kadarmideenet al.(2004). Trained personnel in SUISAG conducted pathological-anatomical examination of front and hind leg bones of slaugh-tered pigs and recorded OC lesions with a score of 1 equaling ‘‘normal’’ and 4 or 5 or 6 equaling ‘‘severely affected,’’ depending on the lesion. Figure 1 (from Kadarmideenet al. 2004) shows positions on the bones on which different lesions are scored: head of humerus (HK), condylus medialis humeri (CMH), condylus lateralis humeri (CLH), radius and ulna proximal (RUP), distal epiphyseal cartilage of ulna (DEU), head of femur (FK), and condylus medialis femoris (CMF). More details and description of OC lesions were given in Kadarmideen et al. (2004). Disease data were available on 1163 station-tested pigs born to 194 boars and 697 dams. Data could be characterized by 23 year-months of testing, 59 stable periods, four breeds (Swiss Large White, Swiss Large White-sire line, Swiss Landrace, and Duroc), and two sexes (male and female). As seen in Figure 2, 70–98% of observations of all OC lesions (except DEU) had a score of 1 (normal). For this reason and to investigate the threshold model segregation analysis of binary data, all lesions (except DEU) were recoded such that ‘‘healthy’’ animals with a score of 1 received 0 and ‘‘diseased’’ animals with a score of 2 and above received a score of 1, creating a 0 or 1 binary trait. Pedigrees were traced as far
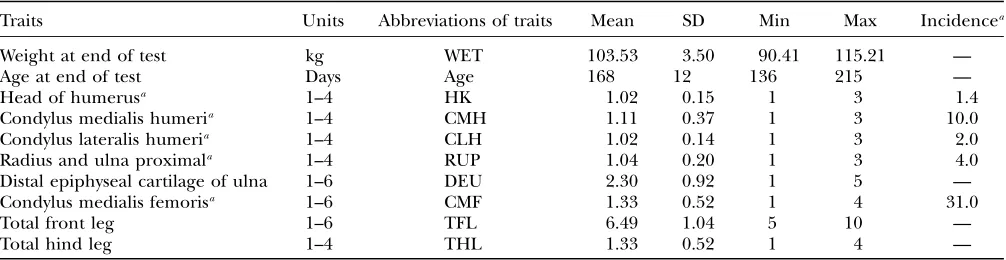
back as possible, which included 2891 animals. The descrip-tion of the data used for segregadescrip-tion analyses is given in Table 1. Two more ‘‘new’’ traits were created: all OC lesions within front legs were summed to give ‘‘total front leg’’ lesions (TFL) as TFL¼CMH1CLH1RUP1HK1DEU and those within hind legs were summed to give ‘‘total hind leg’’ lesions (THL) as THL ¼ CMF 1 FK scores. This summing of scores was performed on the basis of the assumption that all OC lesions within the front or the hind leg bones were likely controlled by similar genes. The TFL resulted in six categories with 175, 483, 318, 135, 48, and 4 animals in categories 1–6, respectively. Since the incidence of FK was nearly zero (Figure 2; only 2 animals were affected with a score of 2), THL was basically equal to CMF, except that there was an increase in the number of animals in category 1 of 1289 and in category 2 of 2 animals. The distribution of animals within each category of TFL and THL is also given in Figure 2.
MITM:A genetic model describing polygenetic and mono-genetic factors for the inheritance of the osteochondral dis-ease (so-called mixed-inheritance model) was used to detect the presence of a major gene in the inheritance of OC in pigs. Threshold-liability models for analysis of binary data were first proposed by Wright(1934) and were later adapted for the analysis of a mixed inheritance by Mortonand MacLean (1974) and to QTL detection and mapping in backcross and F2 populations (e.g., Rebai1997) and in outbred populations on a within-family basis (Kadarmideenet al.2000a; Kadarmideen and Dekkers2001). These models assume the presence of an underlying continuous random variable, calledliability,l¼ flig. Under the liability scale, the MITM model has the form l¼Xb1Zu1ZWg1e; ð1Þ
wherelN31is the vector of liability to OC lesions andbis a vector of nongenetic fixed effects that included:stable period, which is a time period nested within stable in the testing Figure1.—Illustration of positions of differ-ent osteochondral lesions found on bones in pigs. Lesions are scored from 1 to 6 with score 1 showing normal and scores 2–6 showing from mild to severe lesions. HK, head of humerus (1– 4); CMH, condylus medialis humeri (1–4); CLH, condylus lateralis humeri (1–4); RUP, radius and ulna proximal (1–4); DEU, distal epiphyseal cartilage of ulna (1–6); FK, head of femur (1–4); CMF, condylus medialis femo-ris (1–6) (from Kadarmideenet al.2004).
station;year and monthof performance test;breed, consisting of Swiss Large White, Swiss Landrace, Swiss Large White sire line, and Duroc breed;Sex, being a male and female; andweight at end of testas a covariate. Polygenetic effects are modeled byu, while major gene effects are modeled byWg, composed of a matrixWassigning one of three genotypes to each individual and a vectorgto parameterize the genetic effects of the major gene (see details below). TheXandZare incidence matrices, connecting the unknowns inb,u, andWgto the observations. Finally,eis a vector of random residuals forl.
The ‘‘liability,’’ l in model (1) is such that the observed binary (disease) responses (y ¼ fyig) are the result of the relationship
yi¼
0 ifli#T
1 ifli.T;
ð2Þ
whereTis a fixed threshold. Here,yi¼0 denotes a healthy animal andyi¼1 denotes a diseased animal, depending on whether their liability,li, exceeded the ‘‘threshold point,’’T, for manifestation of the disease.
Note thatli’s are not observed; however, they are used to simplify the likelihood and the construction of the MCMC. Often, liabilities are assumed to be normally distributed with mean vectormand covariance matrixR¼Is2
e. Further, as a consequence of the well-known identification problem, the threshold and the dispersion parameter can be set equal to some arbitrary values (here,T¼0 ands2
e¼1).
Assumptions:Prior distribution for the ‘‘fixed’’ effectsbwas
N(0, 10). This normal distribution with relatively large var-iance (residual varvar-iance is set to 1) will apply a mild shrinkage to these fixed effects to avoid unidentifiability and poor con-vergence of their solutions on the liability scale. Distributional assumptions for polygenic effects wereuNð0;As2
uÞ, where Ais the numerator relationship matrix accounting for the additive genetic relationship between individuals with data and their parental generations (Henderson1984) and where, in our standard implementation of the MITM, the prior dis-tribution for polygenic variances2
uwas a uniform on [0, 2]. The major gene was modeled as an autosomal biallelic (allelesAandB) locus, initially, with Mendelian transmission probabilities. The alleleAis defined to decrease the pheno-typic value (lower the OC scores,i.e., associated with healthy phenotypes), and the allele B is defined to increase the phenotypic value (increase the OC scores,i.e., associated with diseased phenotypes). The prior distribution for genotypes can be specified as founder genotypes to have prior probabil-ities of (f)2, 2ff1
, and (f1
)2for genotypesAA,AB/BA, andBB,
respectively, and as nonfounder genotypes to have prior prob-abilities conditional on parental genotypes given Mendelian transmission. Hence, this parameterization assumes a single population and Hardy-Weinberg equilibrium for prior prob-abilities in founders, although actually multiple subpopula-tions were present within the founders. However, this prior distribution in founders generally has only a small influence, being largely overruled by the data, which is also reflected by a generally low accuracy to estimate founder allele frequency; hence we consider that this parameterization is also adequate for the data being analyzed here. For founder allele frequency, onlyfis estimated (f1¼(1f)), and a flat prior distribu-tion on [0, 1] was assigned forf. Effects of the three geno-types AA,AB/BA, andBBwere modeled as g9 ¼(a, 0, a), assuming no dominance, because in our experience the estimation of dominance on a liability scale is difficult, often leading to implausible estimates with large overdominance. The prior distribution for the additive effectawas taken asN(0, 5), which, similarly as for fixed effects, applies a mild shrinkage to a major gene effect. For the model (1), the matrixWand the vectorgare given as
Wg¼
1 0 0 1 0 0 0 0 1 0 1 0 0 0 1 1 0 0
.. .
.. .
.. .
0 1 0 0 B B B B B B B B B B B B B @
1 C C C C C C C C C C C C C A
N33
a
0
a 0 @
1 A
331
;
whereWselects, with a 1 in column 1, 2, or 3, depending on whether each individual has genotype AA, AB/BA, or BB, respectively, andgspecifies the effect of the genotype. Note thatWandgare unknown and have to be estimated by the segregation analysis; that is, the actual genotype of the N
individuals and its corresponding genotypic effects are un-knowns. Note further that, in the MCMC implementation,W indeed contains 0’s and 1’s, not probabilities; probabilities can be obtained by averaging multiple realizations ofWfrom the Markov chain.
The above assumed Mendelian transmission of alleles from parents to offspring can be relaxed, by modeling the prior prob-ability of nonfounder genotypes using transmission probabil-itiestAjAA,tAjAB, andtAjBB, which represent the probabilities of receiving anAallele from a parent with genotypeAA,AB(and TABLE 1
Descriptive statistics for OC lesions from 1163 station-tested pigs
Traits Units Abbreviations of traits Mean SD Min Max Incidencea
Weight at end of test kg WET 103.53 3.50 90.41 115.21 —
Age at end of test Days Age 168 12 136 215 —
Head of humerusa 1–4 HK 1.02 0.15 1 3 1.4
Condylus medialis humeria 1–4 CMH 1.11 0.37 1 3 10.0
Condylus lateralis humeria 1–4 CLH 1.02 0.14 1 3 2.0
Radius and ulna proximala 1–4 RUP 1.04 0.20 1 3 4.0
Distal epiphyseal cartilage of ulna 1–6 DEU 2.30 0.92 1 5 —
Condylus medialis femorisa 1–6 CMF 1.33 0.52 1 4 31.0
Total front leg 1–6 TFL 6.49 1.04 5 10 —
Total hind leg 1–4 THL 1.33 0.52 1 4 —
aOC lesions were transformed to two categories (binary data) as healthy (original score¼1) and diseased (original score.1);
BA), andBB, respectively (ElstonandStewart1971; Lynch and Walsh 1998, pp. 366–369). The Mendelian case is expressed astAjAA¼1,tAjAB¼0.5, andtAjBB¼0. A general expression for the transmission probability of a progeny genotype given parental genotypes then is
Prðprogeny genotypeCDjsire genotypeEF;dam genotypeGHÞ ¼tCjEFtDjGH; ð3Þ
whereC,D,E,F,G, andHrepresent any of the two allelesAorB. The above general expression distinguishes between the two heterozygotes, and termstBj..arising are 1tAj... By estimation of the transmission probabilities, extra safeguards against de-tection of false-positive major genes can be made: as suggested by Elstonand Stewart(1971) a robust indication for the segregation of a major gene is obtained only when estimated transmission probabilities do not deviate significantly from Mendelian, but do differ significantly from equal transmission probabilities, in conjunction with overall significance of the major gene component in the model. Estimation of trans-mission probabilities was done by fixing obtained major gene parameters and polygenic variance to estimated values, allow-ing the estimation of transmission probabilities to indicate whether the inferred major gene might have been caused by other sources.
Variants of MITM: The informative prior model: Polygenic variance of OC lesions under threshold models previously estimated with a pure polygenic model by restricted maximum likelihood and a generalized linear mixed model (REML/ GLMM) methodology by Kadarmideenet al.(2004) was used as apriorfors2
u[the informative prior model (MITM-IP)]. This can be seen as a conservative approach to inference for a mixed inheritance, because this prior suggests that all genetic variance should be polygenic. In conjunction with the prior fors2
ua weighting factor is also specified; with higher weights attached to this prior fors2
u, the sample (and the marginal posterior distribution) is kept closer to the prior value fors2
u, but with low weights it is allowed to still deviate considerably.
The reduced polygenic model: A ‘‘reduced polygenic model’’ (MITM-RM) was used instead of an ‘‘individual polygenic model,’’ estimating only polygenic effects of parents in the form of ‘‘transmitting abilities’’ (TA), or half breeding values. This reduced-model approach was shown to be particularly useful for threshold models (as shown in Janssand Bolder 2000). In model (1),uis then replaced byv, the subset ofuthat pertains to parents, and the design matrix is altered so that the record of an individualiis linked to the TAs of the two parents ofi. This model is equivalent to the previous model as long as parents do not have records, but would become approximate otherwise. Relationships between parents were taken into account, by taking the prior forvN(0,Avs2
v), whereAvis the numerator relationship matrix specifying the relationships between parents in the analysis. The variance component for TAs expresses one-quarter of polygenic variance, and with every record modeled with two TAs, the total variance fitted iss2
p¼s 2 e12s
2
v ¼112s 2
v. In this model an unbounded flat prior fors2
vwas used.
One representative lesion each from front and hind leg bones that had reasonable incidence was chosen. These were CMH and CMF (10 and 31%, respectively) and the above model variants were applied only to these lesions to be able to draw reasonable conclusions.
The Gibbs sampler: Gibbs sampling (Gemanand Geman 1984) was used to obtain marginal posterior distributions of model parameters. The Gibbs sampling strategy with blocking of parents and progeny developed by Jansset al.(1995) was used. For liability-based genetic analysis of polygenic diseases in livestock, Bayesian methods have been used by, e.g., Kadarmideenet al.(2001). The MaGGic 4.1. software
pack-age, developed by Janss(1998), was used to derive marginal posterior distributions of model parameters in (1) for each OC lesion. OC lesion FK was dropped in the final analysis; FK had only 0.1% incidence and zero variance. The addition of FK to CMF (THL) did not make any difference for the reason mentioned above and hence THL was not analyzed. The generation of samples in the MCMC scheme proceeded as follows.
Liabilities:The liabilitiesliare resampled every MCMC cycle according to Equation 1 by resampling the error term, con-ditioning on current values of all model parametersb,u,W, andg. According to the model definition, errors come from a
N(0, 1) distribution. A straightforward rejection sampler was implemented to sample from a truncated normal such that the conditions from Equation 2 are met;i.e., foryi¼0, errors are sampled untilli#Tand foryi¼1, errors are sampled until li.T. Conditional on sampled liabilities, estimation of all other model parameters can proceed as if continuous normal data are available. For a general linear model with normal errors this has been described by Wanget al. (1994) and for a mixed-inheritance model with normal errors by Jansset al.(1995).
Fixed effects:Fixed effects are handled per effect, separating
bintob1,. . .,b5with corresponding incidence matrices (or covariate vector) X1,. . ., X5 for the mentioned effects of stable, year-month, breed, sex, and weight. Then, using cor-rected liability data l˜ ¼lPj6¼iXjbjZuZWg, new bi are sampled from a normal distribution with meanðX9iXi1 10IÞ1ðX9il˜Þand varianceðX9iXi110IÞ
1
s2
e, where the 10I orig-inates from the normal ‘‘shrinkage’’ prior used for fixed ef-fects, and heres2
e¼1. BecauseX9iXihas a simple diagonal structure, the sampling can be simplified to scalar sampling of each element ofbi, leading to the sampling given by Wang et al.(1994).
Polygenic effects:Polygenic effects are equally sampled from normal distributions (Wang et al. 1994), using corrected liability data as l˜ ¼lXbZWg and mean and variance ofuasðZ9Z1kA1Þ1ð
Z9l˜ÞandðZ9Z1kA1Þ1
s2
e, respectively, wherek¼s2
u=s2e, ands2e¼1. The elements ofuare sampled scalar-wise, correcting for each ui the off-diagonals arising fromA1, which involves only correction terms from parents, progeny, and mates. A scalar equation foruiis given in Janss et al.(1995) and also follows from Wanget al.(1994). For the model with reduced parameterization of polygenic effects (MITM-RM) sampling follows analogously, with the principal difference being the differently defined incidence matrixZ.
Genotypes: For genotype sampling, the blocking strategy described by Jansset al.(1995) was used to avoid poor mixing due to ‘‘lock-up’’ in large families. The most general equation is the equation to compute probabilities for the genotypewi for a sirei,
PrðwiÞ}fð˜lijwiÞPðwijwS;i;wD;iÞ
Y
j
Pðwjjwi;wM;jÞ
Yk
X
Wk¼1;3
Pðwkjwi;wM;kÞfð˜lkjwkÞ; ð4Þ
where ˜liare corrected liabilities; in this stepl˜¼lXbZu, the first term is the likelihood or penetrance of the cor-rected liability of individualiwith normal kernel expð1
2ðl˜i wigÞ
2Þ
, the second term is the transmission probability for the genotype of individualiconditional on its parental genotypes, the third term is a product over all progenyjofithat are also parents themselves (nonfinal progeny of i), computing the product of transmission probabilities for progeny genotypeswj conditional onwiand the genotype of the other parent ofj, mate ofi, and the last term is a similar product over all progenyk
probabilities for progeny genotypeswkconditional onwiand the genotype of the other parent ofk, mate ofi, with the weight being the likelihood of the corrected liability of individualk(see above). The last term arises from the blocked sampling strategy to jointly sample sires and final progeny, giving as a first step this reduced conditional for the sire genotype probabilities; after the sire genotype has been sampled, the blocked sampling proceeds by sampling all genotypes of final progeny. For dams the above equation is simplified by considering all progeny within the third term, for final progeny the above equation reduces to the first two terms only, and for founder individuals the second term is replaced by the genotype probabilities in foundersðfÞ2, 2ff1, andðf1Þ2
. The actual sampling of a genotype within the MCMC scheme proceeds by selecting one genotype for the individualiaccording to these probabilities, after normalization, by drawing a random uniform deviate.
Polygenic variance:Using an informative prior as in MITM-IP,
s2
u, conditional on all parameters and data, is taken to be distributed asðu9A1u1ns2
uÞx 2
q1n(Wanget al.1994), whereq is the number of levels inu,s2
uis the prior value used fors 2 u, and
nis the weight attached to that prior value, expressed in degrees of freedom. The quadraticu9A1ucan be computed in a scalar form as exemplified inJansset al.(1995). For a flat prior, as in our standard MITM,s2
u¼0 andn¼ 2 (Wanget al.1994). To implement a bounded flat prior on [0, 2] in MITM,s2
u was sampled until a sample was obtained in the required interval.
Additive allele effect:Conditional onb,u, andWthe model for liabilities can be rewritten asl˜¼lXbZu¼ZWg, which shows a structure for solving and sampling ofgsimilar to that for fixed effects, consideringZWnow as a composite known design matrix. Hence,gis also normally distributed with mean
ðZW9ZW15IÞ1ðZW9l˜Þ and variance ðZW9ZW15IÞ1 s2 e, where the 5Ioriginates from the normal shrinkage prior used for the allele effect, and heres2
e ¼ 1. The allele effect was constrained to be positive so that theAAgenotype remained identifiable as the genotype to lower the liabilities, by rejecting and repeating the sampling in case a negative allele effect was sampled.
Founder allele frequency: These frequencies were sampled from a beta distribution on the basis of counts nA and nB of alleles A and B in the founder individuals using f ðfÞnAð
1fÞnB
. An acceptance-rejection technique was used to sample a newffrom this beta distribution as described in Jansset al.(1995), computing the required terms on a log scale. Transmission probabilities:These were similarly sampled from beta distributions, on the basis of counts of allele transmissions from parents to progeny. Because our basic parameterization of genotypes did not distinguish between the two heterozy-gotes, in a first step this distinction was made for all hetero-zygotes in the pedigree;e.g., a heterozygote from aBBsire and anAAdam was marked to be ‘‘BA’’ to indicate that it inherited theBallele from its sire and theAallele from its dam. When both heterozygotes were possible, one of the two heterozy-gotes was selected randomly. Subsequently, starting with the transmission probabilitytAjAA, the number ofAallelesnAand the number ofBallelesnBto be transmitted from anAAparent were counted, after which tAjAAwas sampled using tAjAA
ðtAjAAÞnAð1tAjAAÞnB with a technique similar to that for sampling of allele frequency. The same counts and sampling were subsequently performed for the other transmission probabilities. The transmission probabilities were constrained so thattAjAA.tAjAB.tAjBBto prevent the Markov chain from switching to insensible mirror configurations whereAalleles become predominantly transmitted by BB genotypes. This constraint was implemented by repeating the sampling of each transmission probability until the condition was met.
MCMC, post-MCMC analyses, and inferences: For each OC lesion, three replicated Markov chains of 50,000 cycles were
run. A spacing of 50 cycles was used to obtain 1000 samples per chain and 3000 samples in total for each lesion. A burn-in period of 1000 cycles was used to allow the Markov chains to reach the equilibrium. The following parameters were saved from the MCMC cycles: polygenic variance components2
u(or
s2
v for MITM-RM), additive effects at the major genea, and allele frequencyf. The following functions of model param-eters were derived from each Gibbs cycle to also allow inference on these parameters:
Additive variance due to major gene : s2 a ¼2f
f1½a2
Polygenic model heritability : h2p ¼
s2 u
s2 u11
Mixed-inheritance model heritability : hm2 ¼
s2 u1s2a
s2 u1s2a11
Polygenic heritability in the MITM-RM : h2p ¼ 4s 2 v
2s2 v11
Mixed-inheritance heritability in the MITM-RM :h2 m ¼
4s2 v1s2a
2s2 v1s2a11
For the post-Gibbs analysis of the samples, an analysis of variance was used to check for equality of multiple chains. This test also yields information about the effective number of samples by comparing within-chain and between-chain var-iances (Jansset al.1997).
The following summary statistics for model parameters were made on the basis of the samples: the marginal posterior means were used as point estimators; marginal posterior standard deviations were computed as measures of inaccuracy; nonparametric density estimates were constructed using the average shifted histogram method ofScott(1992); and on the basis of the latter, highest posterior density regions (HPDR) were determined. The HPDR is constructed in such a way that it includes the part (1a) of the probability mass about the smallest possible region of sampled parameter values (Box and Tiao 1973). The HPDR (as opposed to simple quantiles) can include the boundary of a parameter space,e.g., zero in the case of a variance component.
Hypothesis testing was based on HPDRs, using 1a¼0.95 and denoted as HPDR95%. For testing significance of the major gene component in the mixed inheritance, it was determined whether the HPDR95%ofs2
a(major gene variance) excluded zero. Testing whether transmission probabilities were not significant from Mendelian was done by determining whether the HPDR95%oftAjAA,tAjAB, andtAjBBincluded the Mendelian values of 1, 0.5, and 0, respectively. Testing whether these transmission probabilities were significantly different from an equal transmission model was done by testing whether the HPDR95%of these parameters did not overlap.
Mixed-inheritance linear model: The mixed-inheritance linear model (MILM) was applied to DEU, which was the only OC lesion, with many observations in different categories; lesions were distributed into all five of the six possible classes (Figure 2). The MILM was also used to analyze the newly created trait, TFL. The statistical model was basically the same as that in Equation 1 except that the MILM was applied to the original observed data (y) instead of to liability (l). MILM was also applied to some OC lesions to compare it with regular MITM (without its variants, MITM-IP or MITM-RM).
RESULTS
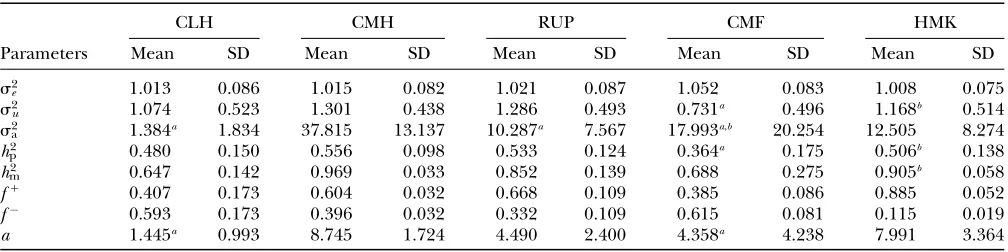
Table 2. Table 2 shows the posterior means and standard deviations of marginal distributions of all parameters. All results (except allele frequencies) from MITM relate to the underlying liability to have the disease. The ex-istence of the major gene for any OC lesion was con-firmed by magnitude and significance of genetic variance contributed by the major gene (s2
a) in the mixed model; with the use of average shifted histograms, density esti-mates were made to supply an HPDR95%to formally test whether these estimates were significantly different from zero at 95% probability.
CLH: Polygenic variance was lower than major gene variance (s2
a) andh2m(0.65) was higher thanh2p(0.48). Frequency of the positive allele that increases the ge-notypic value of the disease (from healthy to diseased or from score 1 to 4),f1
, was (0.41) lower than that of the one that decreases it. The marginal posterior mean of additive major gene effect was 1.445. However, the major gene is not significant as the HPDR95%of its var-iance component (s2
a) includes zero.
CMH:Polygenic variance was substantially lower than the additive major gene variance, resulting in higherh2
m (0.96) thanh2
p(0.55). Frequency of the disease allele,f 1
, was higher than that of the one that decreases it. The marginal posterior mean of additive major gene effect of 8.745 OC score, together with the high frequency of the disease allele, makes theh2
mmuch higher thanhp2. The HPDR95%for parameters of CMH did not include zero for the variance components (includings2
a), as well as for the corresponding derived parameters,h2
p orh 2 m. Hence contributions of both a major gene component and additional polygenic background genes are statisti-cally significant.
RUP: Major gene variance (s2
a) was substantially higher than polygenic variance resulting inh2
m of 0.85 vs. h2
pof 0.53. The frequency of the disease allele,f 1
, was higher than that of the one that decreases the
inci-dence. However, the major gene component, judged by its variance, was not significant as its HPDR95%included zero; note that the allele effect for the major gene would be tested to be different from zero, but this is generally not a reliable guide for testing a major gene effect.
CMF:Point estimates ofs2
awere?s 2
u, resulting inh 2 m of 0.69 andh2
p of 0.36. The additive effect was 4.35 OC liability units. The frequency of the disease allele,f1, was (0.39) lower than that of the one that decreases the incidence (f1¼0.62). In general, however, estimates of genetic components for CMF were rather inaccurate, showing zero to be included in the HPDR95%for both the polygenic variance and the major gene variance, as well as the derived polygenic heritability. This does not necessarily mean that there is no genetic component for CMF; rather, it appears difficult to distinguish between these two genetic components, rendering both of them inaccurate when modeled jointly.
HK:Major gene variance (s2
a) was substantially higher than polygenic variance, resulting inh2
mof 0.91vs. h 2 pof 0.51. The frequency of the disease allele,f1
, was (0.89) higher than that of the one that decreases the in-cidence. The HPDR95% for all parameters of HK did not include zero, which shows genetic components as well the presence of a major gene for this lesion.
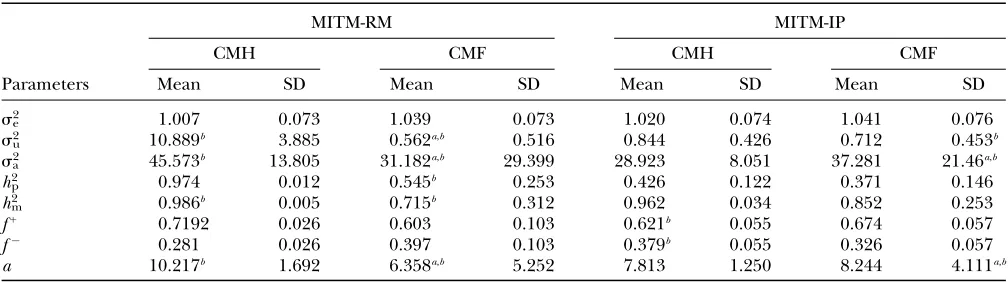
The MITM-RM:With the MITM-RM, two OC lesions (CMH and CMF) were reanalyzed. Results are given in Table 3 and are compared with those from standard MITM without reduced polygenic parameterization (in Table 2). For CMH, the posterior mean ofs2
uincreased substantially from 1.30 to 10.89, and s2
a increased relatively less from 37.82 to 45.57 with a slight increase in additive effect from 8.75 to 10.21. Consequently, both h2
pandh 2
mincreased to 0.97 and 0.98, respectively. These results show the difficulties of estimating polygenic variance, where this reduced parameterization is consid-ered to provide the more reliable estimates. Clear TABLE 2
Marginal posterior means and standard deviations of model and derived parameters for osteochondral diseases (transformed to healthy or diseased) in pigs by Bayesian mixed-inheritance threshold models modeling polygenic effects for all individuals
in the pedigree and using a flat bounded prior for polygenic variance (MITM)
CLH CMH RUP CMF HMK
Parameters Mean SD Mean SD Mean SD Mean SD Mean SD
s2
e 1.013 0.086 1.015 0.082 1.021 0.087 1.052 0.083 1.008 0.075
s2
u 1.074 0.523 1.301 0.438 1.286 0.493 0.731a 0.496 1.168b 0.514
s2
a 1.384a 1.834 37.815 13.137 10.287a 7.567 17.993a,b 20.254 12.505 8.274
h2
p 0.480 0.150 0.556 0.098 0.533 0.124 0.364a 0.175 0.506b 0.138
h2
m 0.647 0.142 0.969 0.033 0.852 0.139 0.688 0.275 0.905b 0.058
f1 0.407 0.173 0.604 0.032 0.668 0.109 0.385 0.086 0.885 0.052
f 0.593 0.173 0.396 0.032 0.332 0.109 0.615 0.081 0.115 0.019
a 1.445a 0.993 8.745 1.724 4.490 2.400 4.358a 4.238 7.991 3.364
Results are based on 10,000 Gibbs samples from three replicated chains.
a
The 95% highest probability density region of this parameter (HPDR95%) included 0.0.
b
evidence for a major gene remain confirmed for CMH. For CMF, the posterior mean of s2
u decreased to 0.56 (from 0.73) whiles2
a increased to 31.18 (from 17.99). There was a slight increase in additive effect from 4.36 to 6.36. Consequently, bothh2
pandh 2
mincreased to 0.55 and 0.72, respectively. However, both genetic compo-nents remained to include zero in their HPDR95% and therefore indicated no significant contribution from either component. Hence, also with the reduced poly-genic parameterization it appears difficult to distinguish between the two genetic components for CMF.
The MITM-IP: With the MITM-IP, two OC lesions (CMH and CMF) were reanalyzed. Results are given in Table 3 and are compared with those from standard MITM without informative prior for polygenic variance (in Table 2).
For CMH, the posterior mean ofs2
udecreased from 1.30 to 0.84 ands2
aalso decreased from 37.81 to 28.92. Theh2
p andh 2
m decreased from 0.56 to 0.43 and from 0.97 to 0.96, respectively. There was also a slight de-crease in additive effect. Overall, the prior for polygenic variance therefore had a tempering effect on all genetic components, but did not affect the general conclusion about presence of a major gene, whose variance com-ponent remained significant.
For CMF, the posterior mean ofs2
u did not change much buts2
amore than doubled (from 17.99 to 37.28), becoming comparable to the estimate from MITM-RM (31.18). There was also a twofold increase in additive effect (from 4.35 to 8.24). Consequently, theh2
pdid not change much buth2
mincreased from 0.69 to 0.85. Now, accuracy of polygenic variance was improved, although this cannot be taken as an appropriate measure of accuracy because it includes prior information. Most importantly, accuracy of major gene variance remained
low and major gene variance remained not significantly different from zero.
Tests for Mendelian segregation:Representative OC lesions, one each from front and hind leg bones that had reasonable incidence, were chosen (as per Figure 1 and Table 1). These were CMH and CMF (with inci-dence 10 and 31%, respectively) and the additional tests for presence of a major gene were applied only to these lesions.
Mendelian transmission probabilities for CMH and CMF were estimated as follows. First, the variance components, allele affect, and founder allele frequency from the basic model (MITM) were fixed, and then the model was rerun while estimating jointly fixed effects, polygenic effects, genotypes, and transmission proba-bilities. Results for estimated transmission probabilities are in Table 4. For CMH, Mendelian transmission prob-abilities (1,12, or 0) were not rejected, while the test for equal transmission probabilities was rejected, as con-firmed by HPDR95%(Table 4). This confirms evidence of a segregating Mendelian major gene for this OC lesion.
For CMF, the test for Mendelian transmission prob-abilities (1,1
2, or 0) rejected Mendelian segregation, but
also the test for equal transmission probabilities was rejected as two transmission probabilities did not have overlapping HPDR95% (Table 4). This confirms evi-dence of some segregating genetic factor for this OC lesion, although it is likely not Mendelian.
Posterior distributions:For each parameter, a uni- or bimodal density was found (graphs not shown for all diseases and parameters). In all cases (models and diseases), mode was very close to the corresponding marginal posterior mean (Tables 2 and 3). In cases of bimodal densities with two peaks, two corresponding TABLE 3
Marginal posterior means and standard deviations of model and derived parameters for osteochondral diseases in pigs by Bayesian mixed-inheritance threshold models using a reduced parameterization for polygenic effects with
parental effects only (MITM-RM) or using an informative prior for polygenic variance suggesting
a prioria pure polygenic inheritance (MITM-IP)
MITM-RM MITM-IP
CMH CMF CMH CMF
Parameters Mean SD Mean SD Mean SD Mean SD
s2
e 1.007 0.073 1.039 0.073 1.020 0.074 1.041 0.076
s2
u 10.889b 3.885 0.562a,b 0.516 0.844 0.426 0.712 0.453b
s2
a 45.573b 13.805 31.182a,b 29.399 28.923 8.051 37.281 21.46a,b
h2
p 0.974 0.012 0.545b 0.253 0.426 0.122 0.371 0.146
h2
m 0.986b 0.005 0.715b 0.312 0.962 0.034 0.852 0.253
f1
0.7192 0.026 0.603 0.103 0.621b 0.055 0.674 0.057
f 0.281 0.026 0.397 0.103 0.379b 0.055 0.326 0.057
a 10.217b 1.692 6.358a,b 5.252 7.813 1.250 8.244 4.111a,b
Results are based on 10,000 Gibbs samples from three replicated chains.
a
The 95% highest probability density region of this parameter (HPDR95%) included 0.0.
b
HPDR95%were available. For showing the differences between models with and without informative prior (MITM vs. MITM-IP) and between full vs. reduced polygenic models (MITM vs. MITM-RM), CMF was chosen as a representative disease as the population in-cidence was 31%. The densities of s2
u and s2a for OC lesions in DEU and TFL were compared with those in CMF, to show the impact of different phenotypic distributions on the posterior distribution of two im-portant model parameters,s2
uands 2 a. The posterior densities ofs2
u ands 2
a for CMF from MITM and its two variants MITM-IP and MITM-RM are plotted in Figure 3a through Figure 4c. Analyses of liabil-ity to CMF by MITM produced asymmetric distributions (bimodal), showing possibly the poor mixing of the Gibbs chains and/or convergence. However, comparing this with segregation analysis with the informative prior fors2
u (MILM-IP), there is a marked difference. For example, distributions ofs2
uin Figure 3avs.Figure 3b and ofs2ain Figure 4avs.Figure 4b show the bimodal distribution be-coming unimodel as well as more area under the curve for boths2
u ands 2
a. The corresponding HPDR95%also changed from being nonsignificant to significant (includ-ing zero to not includ(includ-ing zero) fors2
a(Table 2vs.Table 3). In the case of the reduced polygenic model, MITM-RM, sampling of polygenic values or transmitting abili-ties was for parents only. The density distributions are given in Figure 3c fors2
u and in Figure 4c fors 2 a. Comparing Figure 3a and Figure 3c, the posterior mode is confirmed by MITM-RM to correspond to the first peak in Figure 3a although the density of the second peak became much smaller in MITM-RM. Fors2
a, there was not much difference between shapes of the densities but the area under the curve was larger under MITM-RM than under MITM (Figure 4avs.Figure 4c).
MILM analyses: DEU: With the linear model, all es-timates were on the original (observed) scale. Point estimates ofs2
awere approximately two times more than that ofs2
u, resulting in h 2
m of 0.22 vs. h 2
p of 0.12. The additive gene effect was 0.73 OC units and dominance effect was 0.98 OC units. The HPDR95% for all pa-rameters of DEU did not include zero, excepts2
a. These results show genetic components as well the presence of a major gene for this lesion.
TFL:With the linear model, all estimates were on the original (observed) scale. Theh2
p was 0.07 whereas hm2 was 0.11. The major gene variance was much larger than polygenic variance. The frequency of the disease allele, f1, was (0.65) higher than that of the one that decreases the incidence, like many other OC lesions. As a result of combining different (genetically correlated) lesions in the front leg into one, the polygenic variances as well as major gene variances (s2
u and s 2
a) were much higher than those for other individual lesions in front legs (results not shown). Despite such high genetic vari-ances, the heritabilities (bothh2
pandh 2
m) decreased, due to substantially larger residual variances, s2
e, relative to that of other lesions in the front leg. The impact of large residual variance was such that most of the model parameters were nonsignificant and inaccurate; the HPDR95%included zero for all buts2e.
DISCUSSION
The results reported here clearly showed familial transmission and evidence for a segregating major gene for an important disease, osteochondrosis. Results for analysis of the CMH showed significant major gene variance in a mixed-inheritance model and passed the tests for Mendelian transmission. This is the first in-vestigation to report the results from segregation or mixed-inheritance model analysis of osteochondrosis in pigs or in any other animal species. Hence none of the results from our study could be compared with the literature, except for polygenic parameters for osteo-chondrosis (e.g., Kadarmideenet al.2004). In addition, only a few studies have investigated complex segrega-tion analysis for ordinal or binary data (e.g., Thaller et al. 1996; Cargillet al. 2004) but this is the first study to extensively investigate a liability or threshold model method for identifying major genes for binary diseases in complex pedigrees withinbreeding and marriage loops. The basic theory and algorithms developed in this study could also be used in humans and companion an-imals (e.g., horses, cats, and dogs) where (poly- or oligo-genic) diseases/disorders are observed in categorical form. While reporting evidence for major genes for osteochondrosis, this study also investigated and TABLE 4
Estimated Mendelian transmission probabilities, expressed as the probability of receiving anAallele from a parent with genotypeAA,AB, orBB, for osteochondral diseases CMF and CMH in pigs by Bayesian
mixed-inheritance threshold models (MITM)
Transmission probability
CMF CMH
Mean SD HPDR95% Mean SD HPDR95%
Prob(AjAA) 0.890 0.065 0.988–0.761 0.967 0.025 1–0.922
Prob(AjAB) 0.552 0.063 0.668–0.442 0.538 0.033 0.600–0.475
compared different approaches that can be adopted in the segregation analysis of categorical disease data, using threshold or liability models.
The magnitude and significance of genetic variance at the major gene (based on HPDR95%) was used to confirm the presence of a segregating major gene. This criterion is appropriate because it collectively represents the magnitude and significance of individual major gene parameters of the model and has been used by several studies (e.g., Janss et al. 1997; Ilahi and Kadarmideen 2004). General transmission models
(Elstonand Stewart1971; Lynchand Walsh1998, pp. 366–369) are usually not considered in animal pop-ulations, arguing that there are usually no nongenetic relationships or environmental resemblances between
parents and progeny and that families are dispersed and linked through multiple marriages. Nevertheless, we have also fitted the general transmission model to fur-ther substantiate the presence of a Mendelian segrega-tion. For CMH, results showed that the mixed-inheritance models gave a significant fit (as confirmed by HPDR of the major gene component) and that a model of equal transmission was rejected along with a failure to reject Mendelian transmission probabilities (Table 4). Thus, for CMH, all classical tests for providing evidence of a seg-regating major gene are passed. Results of the general transmission model for CMF were less clear, but showed a potential other use of this general model. Here, Mendelian segregation was rejected, but also an equal Figure 3.—Marginal posterior distributions of polygenic
variance from the mixed-inheritance threshold models: (a) without informative prior (MITM), (b) with informative prior (MITM-IP), and (c) under the reduced polygenic model (MITM-RM) for the lesion condylus medialis femoris scored on a binary scale (CMF).
transmission model was rejected, concluding that some-thing genetic, but not Mendelian, might be present, which may point to, e.g., an imprinted, X-linked, or digenic (epistatic) model.
When binary data have very low incidences, fitting several cross-classified ‘‘fixed’’ effects in a model may cause convergence problems and produce illogical es-timates (e.g., due to all healthy or diseased phenotypes in a given class). This problem has been encountered in the genetic analysis of binary data (e.g., Kadarmideen et al. 2000b, 2001). We solved this problem by using shrinkage estimators for fixed effects. Apart from fixed effects, polygenic effects with an individual polygenic model parameterization also cause problems in the discrete data analyses with linear or threshold models (as shown by Kadarmideen et al. 2000b, 2004). One alternative is to fit a ‘‘sire’’ model but in MITM analysis, the genotype probabilities would still have to be esti-mated at an individual level. In an alternative parame-terization we considered modeling only polygenic values of the parents. With this approach, the estimation of polygenic variance was similar to that used in the reduced polygenic model. A few OC lesions were re-analyzed by this reduced polygenic model with no restric-tions on polygenic variances and other model parameters; however, this model still resulted in a much larger poste-rior mean for polygenic variances (Table 3 and Figure 3c). This result shows the impact of very small family sizes in the data (with the larger families, this approximation usually works well). In principle, the reduced parameter-ization can also be developed for genotypes, but this model is less straightforward to develop, because a heterogeneity of variance within families, dependent on parental genotypes, would result. We retained the full parameterization with individual genotypes and also applied a shrinkage estimator for the allele effect of the major gene, which appeared to work well.
The other approach investigated was the use of an informative priorfor polygenic variance and the study of its impact on model parameters and their significance. Results (Table 3 and Figures 3b and 4b) showed sig-nificant improvement in point estimates and distribu-tional properties of polygenic variance as well as major gene parameters. This shows the advantage of Bayesian methods over likelihood-based methods in segregation analysis with respect to the ability to include and update aninformative prior.
The DEU lesion was the only lesion with many obser-vations in different categories; lesions were distributed into all five of six possible classes (Figure 2). Hence, this trait by definition should mimic a continuous trait and give more reliable estimates/information than those traits with fewer categories and/or skewed distributions (e.g., binary traits with very high/low incidence). For this reason, this trait was analyzed by the MILM. It has been shown that there is a loss of information from continuous or ordinal data to binary data and it severely
reduces power and accuracy in QTL mapping (Rebai 1997; Kadarmideen et al. 2000a). The distributional properties or advantages of DEU were reflected in good mixing of chains, convergence, and hence more reliable parameter (point) estimates (as seen in posterior distributions in Figure 5, a and b) than those traits with extreme distributions.
The TFL was defined as the sum of all OC lesions in front legs, which was meant to treat all the OC lesions in the front leg as one OC lesion; this also resulted in a trait that created more categories with a sufficient number of records to be analyzed by the MILM (Figure 6). The ‘‘clustering’’ of front leg lesions was based on our earlier findings (Kadarmideen et al. 2004) that they were genetically correlated traits (genetic correlation rang-ing from 0.57 to 0.69). The results based on the TFL lesion should be more reliable than those based on individual lesions, as they created six categories instead of only four (except for DEU) as well as ensured a reasonable number of animals in each category (Figure 2). The variances due to polygene and major gene did increase (as expected) but simultaneously there was a drastic increase in residual variance also, as there were very high environmental/error correlations among front leg lesions. In general, this approach shows how one can perform clustering of genetically related dis-eases in segregation analysis, when individual disdis-eases have very low incidences.
We also applied MILMs to most OC lesions on the original scales (scores from 1 to 6 depending on the lesions) to make a comparison with the standard liability model (MITM) analysis of the binary form of the same OC data. Comparing results (not shown), the point estimates on the observedvs.liability scales, the major gene parameterh2
mincreased from 0.40 to 0.65, 0.40 to 0.96, 0.44 to 0.85, and 0.64 to 0.69 for CLH, CMH, RUP, and CMF, respectively. The frequency of the allele that increases the liability to the disease (f1
) actually de-creased when estimated with MITM; the f1
reduced from 0.83 to 0.41, 0.73 to 0.61, 0.80 to 0.67, and 0.47 to 0.39 for CLH, CMH, RUP, and CMF, respectively. Hence, on the discrete observed scale, major gene variances were generally higher, but must also be considered to be less reliable. The analysis of discrete traits by the linear model may have introduced some biases because it tries to match disease genotype (BB) directly to OC scores (1, 2, 3,. . ., etc) which may give a better fit but also causes an upward bias. The threshold model, in con-trast, fits the genotypes to data on a continuous liability scale (rather than on a ‘‘one score-to-one genotype’’ fit in linear models). Hence, the genotypic values and frequencies are more reliable under liability models. This difference explains probably why the disease allele frequencies were overestimated by the linear model. Linear models typically are more sensitive/less robust
to extreme (too low/high) incidence of diseases than threshold models (e.g., Kadarmideen et al. 2000a,b, 2001; Kadarmideenand Dekkers2001). In this study, MILM results for CLH and RUP OC lesions (with inci-dence 2 and 4%, respectively) produced illogical polygenic and major gene parameter estimates. The advantages of MITM would be that gene-environment interactions could be handled more easily on the underlying scale than on the observed scale (Kadarmideenet al.2004). All results (except allele frequencies) from MITM were on the underlying liability (to have the disease) scale and on this scale one would expect the magnitude to be larger than that on the observed scale. These higher magnitudes of estimates from MITM (e.g., major gene heritabilities of liability to disease; Tables 2 and 3) should contribute to larger and faster genetic progress in selec-tion for resistance/tolerance to osteochondrosis in pigs. Regardless of the method, very low incidence rates for certain lesions (as low as 1%) created problems in mixing of the chains and convergence. Similar problems were also encountered by other studies (e.g., Thalleret al. 1996). According to the central limit theorem, more power and accuracy in analysis of categorical/ordinal data could be obtained by increasing the population size and by intermediate incidences (Kadarmideen et al. 2000a, 2001). From a practical point of view, it may be financially prohibitive to collect data on diseases that re-quire manual or anatomical-pathological examinations.
The results presented here open up a new possibility for investigating the presence of major genes in the in-heritance of osteochondral lesions in other species such as humans, companion animals (e.g., horses, dogs, and cats), and other farm animals, as these species are known to have osteochondrosis and may also have similar pat-terns of mixed inheritance. Andersson-Eklund et al. (2000) reported very large QTL for osteochondrosis on chromosome 5 as well as on chromosomes 13 and 15. Lee et al.(2003) conducted QTL mapping in Large White3
Meishan crossbred pigs and found no QTL for osteo-chondrosis but found a QTL forPhysis, another closely related bone abnormality, in pig chromosome 7. The evidence collected from the current segregation analysis in Swiss pigs and from QTL for Physis and osteochon-drosis in the United Kingdom and Swedish pig popula-tions justifies that a resource/commercial population of pigs could be genotyped for these candidate chromo-somes to fine map QTL for osteochondrosis.
CONCLUSION
The research conducted in this study is the first of its kind in that no study has so far investigated osteo-chondrosis in pigs or other animals for the evidence of a major gene by complex segregation analyses, accounting for inbreeding and marriage loops, commonly found in animal pedigrees. In the analysis, novel approaches such as Bayesian threshold mixed-inheritance models were Figure 6.—Marginal posterior distributions of polygenic
introduced for the analysis of diseases observed as binary data, healthy or diseased, and compared with different alternative approaches as well as with linear mixed-inheritance models. All models provided significant evi-dence that osteochondrosis is not only under a polygenic mode of inheritance but also importantly affected by a major gene with Mendelian transmission (at least for osteochondrosis in the condylus medialis humeri). Mod-els with an informative prior for polygenic variance and/ or sampling only parental/grand-parental polygenic values resulted in higher efficiency of Gibbs sampling algorithms and corresponding accuracy of model param-eters. Marginal distributions of major gene and polygene parameters in threshold models were for underlying liability of the animals to develop this disease while linear models provided the estimates for the disease episode; by virtue of the scale, the liabilities were higher in magnitude than observed scales. These results, in gen-eral, should be confirmed by molecular genome map-ping for the disease loci in pig populations via linkage analysis and quantitative trait loci mapping methods. Since osteochondrosis is a health and welfare problem and has unfavorable (genetic) effects on many traits that are economically and functionally important, the evi-dence of a segregating major gene from this study pro-vides an opportunity to select against this disease. The results from this study not only are useful for pig breed-ers but also may function as a ‘‘pig model’’ for un-derpinning genetic inheritance of this disease in other animals and in humans.
The authors thank A. Hofer and D. Schwo¨rer from SUISAG for supplying data. This research was completed as part of an ongoing collaboration between the Federal Institute of Technology of Switzerland (ETH Zurich) and Wageningen University and Research Centre, Lelystad, The Netherlands.
LITERATURE CITED
Andersson-Eklund, L., H. Uhlhorn, N. Lundeheim, G. Dalinand
L. Andersson, 2000 Mapping quantitative trait loci for principal
components of bone measurements and osteochondrosis scores in a wild boar3Large White intercross. Genet. Res.75:223–230. Audige, L., P. R. Wilson, R. S. Morris and G. W. Davidson,
1995 Osteochondrosis, skeletal abnormalities and enzootic ataxia associated with copper deficiency in a farmed red deer (cervus-elaphus) herd. New Zealand Vet. J.43:70–76.
Barneveld, A., and R. vanWeeren, 1999 Conclusions regarding
the influence of exercise on the development of the equine mus-culoskeletal system with special reference to osteochondrosis. Equine Vet J. (Suppl.)31:112–119.
Box, G. E. P., and G. Tiao, 1973 Bayesian Inference in Statistical
Anal-ysis.Addison-Wesley, Reading, MA.
Cargill, E. J., T. R. Famula, G. M. Strain and K. E. Murphy,
2004 Heritability and segregation analysis of deafness in U.S. dalmatians. Genetics166:1385–1393.
Elston, R. C., and J. Stewart, 1971 A general model for the
anal-ysis of pedigree data. Hum. Hered.21:523–542.
Geman, S., and D. Geman, 1984 Stochastic relaxation, Gibbs
distri-butions and Bayesian restoration of images. IEEE Trans. Patt. Anal. Mach. Intell.6:721–741.
Guo, S. W., and E. A. Thompson, 1992 Monte Carlo method for
combined segregation and linkage analysis. Am. J. Hum. Genet.
51:1111–1126.
Hagger, C., L. L. G. Janss, H. N. Kadarmideenand G. Stranzinger,
2004 Bayesian inference on major loci in related multi genera-tion selecgenera-tion lines of laying hens. Poultry Sci.83:1932–1939. Henderson, C. R., 1984 Applications of Linear Models in Animal
Breed-ing.University of Guelph, Guelph, ON, Canada.
Ilahi, H., and H. N. Kadarmideen, 2004 Bayesian segregation
anal-ysis of milk flow in Swiss dairy cattle using Gibbs sampling. Genet. Sel. Evol.36:563–576.
Janss, L. L. G., 1998 MAGGIC: a package of subroutines for genetic
analyses with Gibbs sampling, pp. 459–460 inProceedings of the 6th World Congress on Genetics Applied to Livestock Production, vol. 27. Organizing Committee on 6th WCGALP, Armidale, Australia. Janss, L. L. G., and N. M. Bolder, 2000 Heritabilities of and genetic
relationships between salmonella resistance traits in broilers. J. Anim. Sci.78:2287–2291.
Janss, L. L. G., R. Thompson and J. A. M. van Arendonk,
1995 Application of Gibbs sampling for inference in a mixed major gene-polygenic inheritance model in animal populations. Theor. Appl. Genet.91:1137–1147.
Janss, L. L. G., J. A. M. van Arendonk and E. W. Brascamp,
1997 Bayesian statistical analyses for presence of single major genes affecting meat quality traits in crossed pig population. Genetics145:395–408.
Kadarmideen, H. N., and J. C. M. Dekkers, 2001 Generalized marker
regression and interval QTL mapping methods for binary traits in half-sib family designs. J. Anim. Breed. Genet.118:297–309. Kadarmideen, H. N., L. L. G. Janss and J. C. M. Dekkers,
2000a Power of QTL mapping for polygenic binary traits using generalized and regression interval mapping in multi-family half-sib designs. Genet. Res.76:305–317.
Kadarmideen, H. N., R. Thompsonand G. Simm, 2000b Linear and
threshold model genetic parameters for disease, fertility and milk production in dairy cattle. Anim. Sci.71:411–419.
Kadarmideen, H. N., R. Rekaya and D. Gianola, 2001 Genetic
parameters for clinical mastitis in Holstein-Friesians: a Bayesian analysis. Anim. Sci.73:229–240.
Kadarmideen, H. N., D. Schwo¨ rer, H. Ilahi, M. Malek and
A. Hofer, 2004 Genetics of osteochondral disease and its
rela-tionship with meat quality and quantity, growth and feed conver-sion traits in pigs. J. Anim. Sci.82:3118–3127.
Lee, G. J., A. L. Archibald, G. B. Garth, A. S. Law, D. Nicholson
et al., 2003 Detection of quantitative trait loci for locomotion and osteochondrosis-related traits in Large White 3 Meishan pigs. Anim. Sci.76:155–165.
Lynch, M., and B. Walsh, 1998 Genetics and Analysis of Quantitative
Traits.Sinauer Associates, Sunderland, MA.
Morton, N. E., and C. J. MacLean, 1974 Analysis of family
resem-blance. III. Complex segregation of quantitative traits. Am. J. Hum. Genet.26:489–503.
Nea` s, A., M. Dvoa´ kand J. Zatloukal, 1999 Incidence of
osteochon-drosis in dogs and its late diagnosis. Acta Vet. Brno68:131–139. Rebai, A., 1997 Comparison of methods for regression interval
map-ping in QTL analysis with non-normal traits. Genet. Res.69:69–74. Scott, D. W., 1992 Multivariate Density Estimation: Theory, Practice,
and Visualization.John Wiley & Sons, New York.
Seidler, A. U., V. Bolm-Audor, H. Heiskel, N. Henkel, B. Roth
-Ku¨ veret al., 2001 The role of cumulative physical work load
in lumbar spine disease: risk factors for lumbar osteochondrosis and spondylosis associated with chronic complaints. Occup. Environ. Med.58:735–746.
Thaller, G., L. Dempfle and I. Hoeschele, 1996
Maximum-likelihood analysis of rare binary traits under different modes of inheritance. Genetics143:1819–1829.
Trostle, S. S., R. G. Nicoll, L. J. Forrest and M. D. Markel,
1997 Clinical and radiographic findings, treatment, and out-come in cattle with osteochondrosis: 29 cases (1986–1996). J. Am. Vet. Med. Assoc.211:1566.
Wang, C. S., J. J. Rutledgeand D. Gianola, 1994 Bayesian analysis
of mixed linear models via Gibbs sampling with an application to litter size in Iberian pigs. Genet. Sel. Evol.26:91–115. Wright, S., 1934 An analysis of variability in number of digits in an
inbred strain of guinea pigs. Genetics19:506–536.