Cloning and Characterization of Maize B Chromosome Sequences
Derived From Microdissection
Ya-Ming Cheng and Bor-Yaw Lin
1Institute of Molecular Biology, National Chung Hsing University, Taichung 402, Taiwan, Republic of China Manuscript received September 23, 2002
Accepted for publication January 10, 2003
ABSTRACT
Isolation of sequences from the maize B chromosome is always hampered by its high homology with the normal complements. In this study, this handicap was overcome by cloning the sequences from the pachytene B chromosomes dissected out of a slide by a micromanipulator followed by degenerate oligonucleotide-primed PCR. The isolated sequences were found to hybridize with genomic DNA in a B-dosage-dependent manner and with the pachytene B chromosome by fluorescencein situhybridization (FISH), corroborating their B origin. A total of 19 B sequences were isolated, all of which are repetitive and, with one exception, are homologous to the A chromosome(s). Three sequences have strong homology to maize sequences that include two knob repeats and onezeingene (noncoding region), and 10 others are homologous to the noncoding region ofAdh1,Bz1,Gag,Zein, and B centromere to a lesser degree. Six sequences have no homology to any gene. In addition to FISH, the B-specific sequence and a partially B-specific one were also mapped, by seven newly characterized TB-10L translocations, to a similar location on the central portion of the distal heterochromatic region, spreading over a region of about one-third of the B chromosome.
S
UPERNUMERARY B chromosome of maize is an structed from a line carrying 15 B’s, by differentialhy-bridization, using genomic DNA with and without B as extra or nonessential chromosome, and its origin
is still not clear. In the form of B-A translocations, it probes. Only 8 phages hybridized more strongly to the B-carrying DNA, and all were subsequently shown to be has been widely used for gene deletion mapping (Roman
andUllstrup1951;Beckett1978) and for gene dos- a portion of the same sequence. Byin situhybridization and B-A translocations, they mapped the sequence to age analysis (Birchler1979;Lin1982). It differs from
the normal complements (A chromosomes) in several the centric region of the B chromosome. Page et al.
(2001) observed recently that this sequence has homol-aspects: it is mitotically telocentric and highly
hetero-chromatic, and it has no detectable genetic effects on the ogy to the fourth centromere.Starket al.(1996) com-pared the digestion pattern of DNA with and without plant, except with high numbers (Randolph1941). In
addition, it enhances recombination on the A chromo- B, and no obvious difference was observed. They didin somes (Rhoades1968) and undergoes nondisjunction situ hybridization of mitotic B chromosomes with
la-at the second pollen mitosis (Randolph1941;Roman beled genomic DNA without B and demonstrated the
1947). Yet, B and A are not molecularly divergent. presence of hybridization signals almost the entire
Relatively few articles on B sequence have been pub- length of the B chromosome. They also constructed lished, and all indicated high homology between B and three partial genomic libraries from the 0.5- to 3.0-kb
A chromosomes.ChiltonandMcCarthy(1973) per- fractions of B-containing DNA digested with three
dif-formed a thermal kinetics study on maize DNA with ferent enzymes and screened the libraries by comparing and without B and found no detectable altered base the hybridization pattern between genomic probes with
composition between the two samples. They also ana- and without B chromosomes. No B-specific clone was
lyzed the same DNA by ultracentrifugation and observed found, suggesting again similar DNA composition
be-the same buoyant densities. Alfenito and Birchler tween B and A chromosomes.
(1993) screened 5000 phages from a -library, con- In this article, a different approach was adopted. We dissected the B chromosome from microsporocytes and obtained 19 B sequences, 18 of which share homology with the A chromosomes. Thus, our results confirm Sequence data from this article have been deposited with the
EMBL/GenBank Data Libraries under accession nos. BH814952– the previous conclusions of similarity between B and 814955 and BH814957–814977.
A chromosomes. In addition, by fluorescence in situ
1Corresponding author: Institute of Molecular Biology, National
hybridization (FISH) analysis, we mapped all sequences, Chung Hsing University, Taichung 402, Taiwan, Republic of China.
E-mail: [email protected] 2 of which were also localized by B-10L translocations.
MATERIALS AND METHODS cycles and a final extension at 72⬚for 10 min. The low-strin-gency cycle was performed as follows: 94⬚for 1 min, 30⬚for
Plant material:Three inbred lines (L289, W22, and B73) 1.5 min, and 72⬚for 3 min, and the high-stringency cycle was were used in this study. Of three types of L289 plants, one performed as follows: 94⬚ for 1 min, 55⬚for 1 min, and 72⬚ carrying 2 B’s (L289⫹2B) was used to prepare the pachytene for 1.5 min. To increase the amount of PCR product, DNA chromosomes for microdissection as well as FISH analysis, and (2l) from DOP-PCR was used as template for further ampli-the two oampli-thers containing 1 B (L289⫹1B) and no B (L289⫹ fication with 25 high-stringency cycles. The second-round PCR 0B), respectively, were the positive and negative controls in products were ligated into a linearized vector (pBluescript), mapping studies. Three W22 plants bearing no B (W22 ⫹ transformed to competent cells (Escherichia coli, DH5␣) and 0B), 6 B’s (W22⫹6B), and 16 B’s (W22⫹16B), respectively, plated onto Luria broth (LB)/Amp/X-gal/isopropyl thioga-were used to characterize all isolated sequences. B73 was used lactoside plates for selection of white colonies, which were as a positive control of degenerate oligonucleotide-primed transferred to a fresh ampicillin-containing plate and num-PCR (DOP-num-PCR) and as the maternal parent for production of bered individually.
hyperploid and hypoploid plants. Seven B-10L translocations Characterization of PCR-generated clones: The plasmid (TB-10L7, TB-10L16, TB-10L20, TB-10L26, TB-10L32, TB- DNA of a selected colony was prepared by a rapid screening 10L36, and TB-10L38) isolated byLin(1972) were used to protocol. Each numbered clone was first inoculated into 500 generate hyperploids and hypoploids. They were carried by l LB with ampicillin in a 1.5-ml tube by a sterile toothpick W22 and have a breakpoint on the B long arm (BL) and the and incubated at 37⬚overnight. Bacterial cells were spun down, second breakpoint on the long arm of chromosome 10 (10L; and the supernatant was removed. The pellet was mixed with
Lin1974). 20l 5⫻loading dye and resuspended by vortexing. The cells
Synthesis of plants hyperploid or hypoploid for the long were lysed with equal volume of phenol/chloroform (1/1), arm of chromosome 10: Hyperploid and hypoploid plants vortexed for 1 min, and centrifuged at 12,000 rpm for 10 were produced from crossing W22 carrying the B-10L translo- min. The upper aqueous phase, containing plasmid DNA, was cation as staminate parents to B73. A B-10L translocation loaded on a gel for electrophoresis, blotted onto a nylon contains two different chromosomes, 10-B and B-10. The for- membrane, and probed with genomic (W22 ⫹16B) DNA. mer carries the 10th centromere and the distal portion of the Clones giving positive hybridization signal were recultured BL; the latter bears the B centromere and the distal portion of and their plasmid DNA was then prepared by alkaline mini-the 10L. When B-10 undergoes nondisjunction at mini-the second preparation method (Sambrooket al.1989). The insert DNA pollen mitosis, two sperm will be produced: one with 10-B was amplified using M13 forward/reverse primers and used B-10 B-10 (hyperploid) and the other with 10-B (hypoploid). to probe the genomic DNA for characterization of the nature The B-10 can be followed by the expression ofR-scm(colored of cloned sequences.
aleurone and scutellum) located on the 10L portion of B-10. Genomic DNA isolation and Southern hybridization:Plant A hyperploid kernel has colored scutellum but colorless aleu- DNA was isolated by the method of Saghai-Maroof et al. rone, and a hypoploid one has colorless scutellum but colored (1984) with modifications byLinandChou(1997). The
pro-aleurone. cedure of blotting, probing, hybridization, and washing was
Preparation of pachytene chromosomes:The slide was pre- done by the method outlined byLinet al.(1997).
pared by following the conventional protocol (Burnham Fluorescencein situhybridization of pachytene B
chromo-1982). Briefly, L289 ⫹ 2B was grown in the field, and mi- some:Identification of microsporocytes containing pachytene crosporocytes undergoing meiosis I were fixed in ethanol- chromosomes was performed according to Phillips and glacial acetic acid (3/1) overnight before being stored in 70% Wang(1982), and preparation of FISH slides followed proto-ethanol at⫺20⬚. A single anther of a floret was placed into a cols of J.Lamb, A.Katoand J.Birchler(personal communi-drop of propionic carmine on a slide. The anther was cut cation) and Kasza´s et al. (2002), both with modifications. transversely, and microsporocytes were gently squeezed out Briefly, immature microsporocytes of L289⫹2B were fixed by a needle. After the anther walls were discarded, a coverslip in ethanol-glacial acetic acid (3/1) overnight, and an anther was applied. The slide containing isolated B’s in most cells was squashed in propionic carmine to determine the develop-at the appropridevelop-ate stage was frozen in liquid nitrogen. The
ment stage of microsporocytes. When the appropriate stage coverslip was removed with a razor blade, and the slide was
was found, the remaining two anthers were treated with 2% air-dried for microdissection.
Onozuka R10 cellulase (Yakult Honsha) and 5% pectinase
Isolation, amplification, and cloning of B DNA collected
(Serva) in 4 mmcitric acid/6 mmsodium citrate buffer (pH
from pachytene B chromosomes:Pachytene B chromosomes
4.8) at 37⬚for 3 hr. The resulting protoplasts were suspended were isolated with a microneedle driven by a mechanical
mi-in ethanol-acetic acid (1/1), dropped onto a slide, and dried cromanipulator (Leitz) under an inverted microscope (IX70;
slowly. Olympus, Lake Success, NY). The microneedle was prepared
Probe preparation, hybridization, and signal detection fol-as follows: a borosilicate glfol-ass rod with an external diameter
lowed essentially the method ofLeeet al.(1999). Probe was of 1.0 mm was pulled on a micropipette puller (P-80; Shutter
prepared from an isolated sequence labeled with digoxigenin-Instrument) to form a microneedle with a tip diameter of 2–5
11-dUTP (Roche Molecular Biochemicals, Indianapolis) by m, which was shaped on a microforge (MF-83; Narishige,
PCR amplification using M13 forward/reverse primers, puri-Greenvale, NY). The B fragments scraped off from a cell were
fied through a G-50 column, precipitated in ethanol, and treated with a 0.1-l drop of proteinase K buffer [0.5 mg/ml
resuspended in TE (10 mm Tris-Cl, 1 mm EDTA, pH 8.0). proteinase K in 1⫻Takara (Berkeley, CA) PCR buffer], which
Hybridization mixture (50% formamide, 2⫻SSC, 10% dex-was transferred to the reaction mixture of DOP-PCR for
ampli-tran sulfate, 0.1% SDS, and 5 ng/l probe DNA) was dropped fication. The B DNA was amplified by the method outlined
onto the slide prepared above and a coverslip was applied.
byTeleniuset al.(1992). PCR mixture (final volume 50l)
The slide was heated at 80⬚ for 2 min on a hot plate and included 0.1l dissected DNA, 1⫻PCR buffer (Takara), 0.7
incubated at 37⬚overnight in a humid chamber. mdegenerate oligonucleotide primer (6-MW 5⬘-CCG ACT
After hybridization, the slide was washed with 20% for-CGA GNN NNN NAT GTG G-3⬘), 0.2 mmdNTP, and 2.5 units
mamide in 2⫻SSC at 45⬚for 10 min, with 2⫻SSC at 42⬚for TaqDNA polymerase (Takara). After initial denaturation (94⬚,
10 min, and with 2⫻SSC at room temperature three times, 10 min), 5 low-stringency cycles were run before a transition
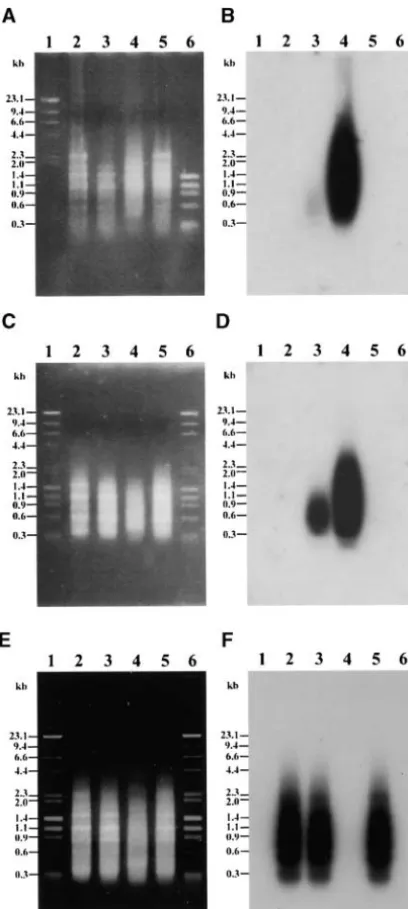
mono-TABLE 1 PCR products (5l). The dissected B fragments yielded products of 0.2–4.5 kb (Figure 2A, lane 3), and the
Twenty-five microdissection sequences and
positive control (genomic DNA of B73 as template)
accession numbers in GenBank
yielded products of 0.2–6.0 kb (Figure 2A, lane 4). Unex-pectedly, the negative controls (no template DNA)
pro-Clone no. Accession no.
duced a substantial amount of products (Figure 2A,
pBPC1 BH814972
lanes 2 and 5). To determine if DNA in the negative
pBPC2 BH814957
controls was amplified from maize DNA, the gel was
pBPC3 BH814970
blotted and probed with genomic (W22⫹ 16B) DNA
pBPC4 BH814954
(Figure 2B). Hybridization signal was present in the
pBPC5 BH814965
pBPC6 BH814961 products of B DNA and B73 (Figure 2B, lanes 3 and
pBPC7 BH814959 4), but not in that of the negative controls (Figure 2B,
pBPC8 BH814955 lanes 2 and 5). The signal of the B DNA is much weaker
pBPC14 BH814962
than that of B73; thus, the B DNA was amplified along
pBPC15 BH814966
with contaminant DNA. The products of the second
pBPC16 BH814958
PCR (Figure 2C) have a similar hybridization pattern
pBPC21 BH814976
(Figure 2D), but the signal intensity of the B products
pBPC23 BH814975
pBPC28 BH814974 is enhanced (Figure 2D, lane 3). Furthermore, to clarify
pBPC29 BH814971 whether the unexpected products are the result of
inad-pBPC31 BH814969 equate DOP-PCR protocols, products of the second PCR
pBPC32 BH814964
(Figure 2E) were probed by the contaminated products
pBPC42 BH814963
(Figure 2E, lane 2). No hybridization was observed in
pBPC43 BH814960
the products of B73 DNA (Figure 2F, lane 4) but very
pBPC45 BH814968
strong signal was observed in that of the negative
con-pBPC48 BH814953
pBPC49 BH814973 trols (Figure 2F, lanes 2 and 5) and the B DNA sample
pBPC50 BH814952 (Figure 2F, lane 3), suggesting a negative correlation
pBPC51 BH814977 (seediscussionfor implications).
pBPC52 BH814967
Southern analysis:A library was constructed from the B PCR products. A total of 1671 clones were screened for the presence of B sequences. Probed with labeled clonal anti-digoxin (Sigma, St. Louis), amplified with FITC- genomic (W22 ⫹ 16B) DNA, 40 positive clones were conjugated anti-mouse IgG (Sigma), counterstained with identified. Their inserts were used to probe genomic 1 g/ml propidium iodide, and mounted in Vectashield
DNA of (W22⫹ 0B), (W22⫹ 6B), and (W22⫹ 16B)
mounting medium (Vector Laboratories, Burlingame, CA). It
digested with three enzymes (PstI,EcoRI, andSacI). Out was visualized under an Olympus BH2 fluorescent microscope
equipped with appropriate filter sets. The image was captured of 40 positive clones, 25 produced hybridization signals, with a cooled charge-coupled device camera (Penguin 150CL; and the remainder did not. Southern analyses of the Pixera) and processed in Photoshop (Adobe, San Jose, CA). 25 clones are listed in Table 2. Sixteen clones have an
Sequence analysis: Sequence comparison was performed
increase in signal intensity paralleled with an increase using BLAST software of the National Center for
Biotechnol-in B numbers, 8 others do not, and 1 is B specific. ogy Information (NCBI) website. Twenty-five sequences were
registered in the genome survey sequences database (dbGSS) Among those clones with B-dosage response, 4 have an of GenBank. Their accession numbers are listed in Table 1. increased intensity in all signals. For example, the signal of pBPC4 is smeared in theSacI-digested DNA (Figure 3, A1 and A2, lanes 7–9), and in discrete bands in two RESULTS
other digests (Figure 3, A1 and A2, lanes 1–6). All of these signals show high correlation with the B number. Isolation of B sequence: A bivalent B chromosome
was removed directly from a pachytene slide by a micro- Six others (pBPC2, pBPC6, pBPC7, pBPC14, pBPC16, and pBPC43) have two types of signals: one is responsive manipulator (seematerials and methods). It was
dis-tinguished by its large heterochromatic block and a to the B dosage (discrete bands) and the other is not (smeared portion; data not shown). The last 6 clones large knob at one end (Figure 1A;Lin1979). Monitored
under microscope, an isolated B chromosome was are also B-dosage responsive, but different from the
clones described above in one aspect. For example, scraped off from the cell (Figure 1B). The resulting
frag-ments, amassed to a pile and adhered statically onto the pBPC45 has two signals in all three DNA digests: one major and one minor signal inPstI and EcoRI digests needle tip, were transferred into a drop of proteinase K
buffer placed on a separate slide. A total of 10 B chromo- (Figure 3, B1 and B2, lanes 1–6) and two major bands in theSacI digest (Figure 3, B1 and B2, lanes 7–9). All somes were collected, and the B-containing buffer was
Figure1.—Isolation of an individ-ual B chromosome by micromanipu-lator. (A) B bivalent (arrow) at the pachytene stage. (B) The B bivalent in A (arrow) was removed from the cell.
Yet, the intensity between (W22 ⫹ 6B) and (W22 ⫹ The unique signal patterns were individually
repre-16B) is alike. sented by pBPC16 with signal on the entire B
chromo-Clone pBPC31 is a representative sequence that does some, by pBPC7 on all B regions but DE, by pBPC48 not have the B-dosage response. It has smeared signals on all regions except BS and CK, by pBPC51 on all in the PstI digest (Figure 3, C1 and C2, lanes 1–3), regions but PE and DE (Figure 4A), and by pBPC50 on smeared signals plus one discrete band in the EcoRI CK and H1–4 (Figure 4B). The signal pattern, expressed digest (Figure 3, C1 and C2, lanes 4–6), and two discrete by 2 sequences, had signals on either CK and H4 bands in the SacI digest (Figure 3, C1 and C2, lanes (pBPC23 and pBPC21; Figure 4C) or all B regions ex-7–9). The signal pattern and intensity are identical in cept BS and DE (pBPC4 and pBPC14). The last
pat-samples with and without B chromosome, implying tern expressed by 10 sequences (e.g., pBPC28; Figure
abundance of the sequence in A chromosomes. A partic- 4D), displayed signals on the entire B chromosome ex-ularly interesting clone (pBPC51) is a B-specific se- cept BS.
quence. Its hybridization signal is smeared in all three Sequence analysis:Nineteen B clones were sequenced enzyme digests, absent in (W22 ⫹0B), but present in and analyzed by Blast Two sequences (Tatusovaand
(W22⫹6B) and (W22⫹16B) (Figure 3, D1 and D2). Madden1999). The B sequences average 345 bp (184–
Moreover, it also has B-dosage response; its signal is 743 bp) long (Table 4) and are 57% A-T rich (47–69%).
more intense in (W22⫹ 16B) than in (W22⫹ 6B). Of the 19 sequences, 1 has its entire sequence in
com-Signal complexity of the 25 sequences varies consider- mon with and embodied in another sequence: pBPC21 ably. On the basis of the signal pattern expressed in [nucleotide (nt) 1–215] corresponds to nt 396–181 and
three enzyme digests, those sequences were grouped nt 216–1 of pBPC23 (92% identity). In addition, two
into three types: a smeared signal (type I; Figure 3D2),
pairs of sequences are partially homologous to each a smeared signal in addition to discrete bands (type II;
other: nt 59–371 of pBPC28 matches nt 98–403 of Figure 3, A2 and C2), and only discrete bands (type III;
pBPC43 (81% identity) and nt 1–246 of pBPC1 matches Figure 3B2). Among 25 clones, 4 belong to type I, 14
nt 7–252 of pBPC49 (93% identity). The remaining 13 to type II, and 7 to type III (Table 2).
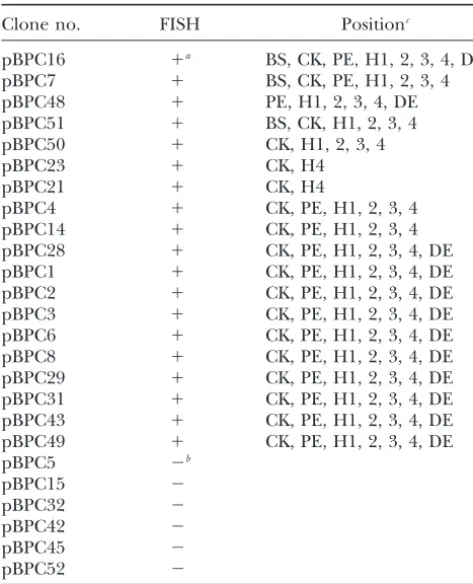
sequences exhibit no homology to any other sequence. FISH analysis:To firmly establish that the isolated 25
In view of the fact that previously isolated B sequences sequences originated from the B chromosome, we used
in maize (Peacocket al.1981;AlfenitoandBirchler fluorescencein situhybridization to analyze the
pachy-1993) and rye (Sanderyet al.1990;Blundenet al.1993) tene B chromosome, which is composed of—from
prox-are of tandem repetitive nature, it is interesting to see if imal to distal—a short arm (BS), a centromere, a
centro-similar structure exists in the isolated sequences. Using meric knob (CK), a proximal euchromatic region (PE),
Tandem Repeats Finder (Benson1999), we found that four distal heterochromatic regions (H1–4), and a distal
only 1 of 19 B sequences contains short tandem repeats; euchromatic tip (DE) as shown in Figures 5A and 7.
pBPC7 has repeats of 3 different sequences: 2 of 18 bp Using these sequences as probes, the hybridization
sig-(3.3 and 1.9 copies, respectively) and 1 of 15 bp (2.3 nal was detected in all but 6 sequences as listed in Table
copies). The remaining sequences bear no tandem re-3, indicative of B origin. Absence of hybridization
associ-peats. ated with the exceptional sequences indicates that they
The B sequences were compared with sequences in were either not from the B chromosome or from B but
GenBank (Table 4). Six clones do not show homology not detectable by the FISH system of this study. The
to any published sequence. The entire sequence of first view agrees with the results of sequence comparison
pBPC48 is homologous to two noncoding regions of detailed in discussion. The remaining 19 sequences
maize 22-kDzeingene (90% identity). Nine clones have that hybridized with the B chromosome displayed eight
a fraction of sequence homologous to the noncoding different signal patterns. Five patterns are uniquely
ex-regions in the GenBank entries of several maize genes, pressed by a single sequence, two others each by 2
TABLE 2
Southern analysis of 25 sequences isolated by microdissection of the pachytene B chromosome
B-dosage Signal
Clone no. response complexitye
pBPC4 ⫹a II
pBPC8 ⫹ II
pBPC48 ⫹ II
pBPC50 ⫹ III
pBPC2 (⫹)b II
pBPC6 (⫹) II
pBPC7 (⫹) II
pBPC14 (⫹) II
pBPC16 (⫹) II
pBPC43 (⫹) II
pBPC45 ⬍⫹⬎c III
pBPC5 ⬍⫹⬎ III
pBPC15 ⬍⫹⬎ III
pBPC32 ⬍⫹⬎ III
pBPC42 ⬍⫹⬎ III
pBPC52 ⬍⫹⬎ III
pBPC31 ⫺d II
pBPC1 ⫺ II
pBPC3 ⫺ II
pBPC21 ⫺ I
pBPC23 ⫺ I
pBPC28 ⫺ I
pBPC29 ⫺ II
pBPC49 ⫺ II
pBPC51 B specific I
aPositive B-dosage response.
bOnly a portion of signals are B-dosage responsive. cB-dosage responsive clone with similar signal intensity
be-tween (W22⫹6B) and (W22⫹16B).
dNo response to B dosage.
eI, smeared signal; II, smeared signal plus discrete bands;
III, only discrete bands.
specific repeat clone (GenBank accession no. M32522; DennisandPeacock1984). pBPC23 is 399 bp in length,
Figure2.—Characterization of products from first and
sec-homologous to three regions of the knob sequence: nt ond PCRs. (A) Gel electrophoresis of the products of the first
1–30, 35–214, and 215–394 (147–176, 1–180, and 1–180, PCR. (B) Autoradiogram of the first PCR products probed
with genomic (W22⫹16B) DNA. (C) Gel electrophoresis of respectively, in M32522, average identity 96%). The sec-the products of sec-the second PCR. (D) Autoradiogram of sec-the ond sequence, pBPC21, is 215 bp in length and its nt second PCR products probed with genomic (W22 ⫹ 16B)
3–182 correspond to knob region 180–1 in M32522 DNA. (E) Gel electrophoresis of the products of the second
(95% identity).Peacocket al.(1981) observed that the PCR. (F) Autoradiogram of the second PCR products probed
repeated sequence is specific to knobs on A chromo-with the products of the negative control. Lane 1, size marker
(-HindIII digest or with⌽x174-HaeIII digest); lane 2, negative somes and the B-centromeric knob, which was verified control (no template); lane 3, dissected B fragments as tem- by our FISH analysis (Figure 4C; other data not shown). plate; lane 4, positive control [B73 genomic DNA (110 ng)
Accordingly, these two sequences may have derived as template]; lane 5, negative control (no template); lane 6,
from the centromeric knob of the B chromosome. A size marker (⌽x174-HaeIII digest or with-HindIII digest).
third sequence (pBPC51) has 329 bp and is B specific. A portion of the sequence is present in seven docu-mented B-centromeric sequences (90% identity). Thirty-to bz1 are sequences sharing homology with the LTR
three base pairs (nt 293–325) of pBPC51 correspond region of retroelement.
to nt 485–517 of K7 (accession no. U62002), to nt 361– Of particular interest are sequences related to maize
393 of K5 (U62000), to nt 417–449 of K2 (U621988), knobs and the B centromere. Two sequences (pBPC23
Figure3.—Southern blot analysis of four cloned sequences. Genomic DNA (W22⫹0B, lanes 1, 4, and 7; W22⫹6B, lanes 2, 5, and 8; and W22⫹16B, lanes 3, 6, and 9) was digested withPstI,EcoRI, andSacI (A1, B1, C1, and D1) and probed with clones pBPC4 (A2), pBPC45 (B2), pBPC31 (C2), and pBPC51 (D2). The molecular weights are shown on the left of the ethidium-bromide-stained gels (top) and the corresponding Southern blots (bottom).
(U61996), to nt 486–518 of B7b (U61995), and to nt in H3 near the H3-H4 junction (Figure 5, G and H).
Of these, the breakpoint of TB-10L20 is proximal to 397–429 of B3 (U61991). Since only 33 out 329 bp
are identical to the published B-centromeric sequences, that of TB-10L36. The map positions of these break-points were summarized in Figure 7. Results of this whether pBPC51 originated from the B centromere is
a matter of speculation. study are consistent with the previous observation by
Lin(1978) on the breakage of 10L7, 10L20, TB-Using Open Reading Frame Finder (NCBI), the
lon-gest open reading frames (ORFs) range from 22 to 124 10L36, and TB-10L38.
These translocations were used to map the B sequences. codons (Table 4). Disregarding sequences homologous
to knob and B-centromeric sequences, the longest ORF Feasibility of such mapping depends on whether a se-quence conforms to one of the two following require-(pBPC7) covers 115 codons matching with maize zein
protein. The second longest ORF (pBPC8) includes 107 ments: it is either B specific or not B specific but its signal in⫹1B DNA is distinguishable from that in⫹0B codons, which have no similarity to any gene in
Gen-Bank. The next ORFs in this order have 100 and 94 DNA. Out of 19 B sequences, 17 do not meet either
requirement; they are not B specific. And 8 of these codons, respectively, and both are not comparable to
any documented protein. The remaining ORFs are hybridize equally among W22⫹0B, W22⫹6B, L289⫹
0B, and L289⫹1B. Nine others have their signal inten-shorter than 72 codons. Whether or not these ORFs are
valid cannot be determined until the regions upstream sity in L289⫹1B indistinguishable from that in L289⫹ 0B, although their signals are more intense in W22⫹ and downstream of these sequences are available.
Mapping B sequences by B-10L translocations:Seven 6B than in W22⫹0B (Figure 3A2). Of the remaining two sequences, pBPC51 is B specific. And pBPC50 is B-10L translocations (TB-10L7, TB-10L16, TB-10L20,
TB-10L26, TB-10L32, TB-10L36, and TB-10L38) with a not B specific but some of its signals are B specific in L289 ⫹ 1B digested with BamHI (Figure 6B, lane 1) breakpoint located on the BL were used to map the B
sequences. The breakpoint of TB-10L7 and TB-10L16 and with BglII, EcoRI, EcoRV, HindIII, and SacI (data not shown). Thus, only these two sequences could be is located in the PE region (Figure 5, B and C), and
five others break in the distal heterochromatic regions: mapped by translocations.
The rationale of mapping is as follows: the 10-B of 10L38 at the junction of H1 and H2 (Figure 5D),
TABLE 3 the other hand, when the B signal is absent in the hypoploid DNA, it should be located proximal to the
FISH analysis of 25 sequences isolated by microdissection
breakpoint; that is, it is on the B-10. Independent of
of the pachytene B chromosome
the break position, the hyperploid DNA should have the signal.
Clone no. FISH Positionc
Figure 6A shows the result of mapping the first
se-pBPC16 ⫹a BS, CK, PE, H1, 2, 3, 4, DE
quence (pBPC51). The hybridization signal is present
pBPC7 ⫹ BS, CK, PE, H1, 2, 3, 4
in L289⫹ 1B but not in L289⫹0B (Figure 6A, lanes
pBPC48 ⫹ PE, H1, 2, 3, 4, DE
1 and 2), indicative of sequence unique to the B. It is
pBPC51 ⫹ BS, CK, H1, 2, 3, 4
also present in both hyperploid and hypoploid of
TB-pBPC50 ⫹ CK, H1, 2, 3, 4
pBPC23 ⫹ CK, H4 10L7, TB-10L16, and TB-10L38 (Figure 6A, lanes 3–8).
pBPC21 ⫹ CK, H4 Two of the remaining translocations, 10L20 and
TB-pBPC4 ⫹ CK, PE, H1, 2, 3, 4 10L36, possess signal in the hyperploid but not in the
pBPC14 ⫹ CK, PE, H1, 2, 3, 4
hypoploid (Figure 6A, lanes 13–16). TB-10L26 is
differ-pBPC28 ⫹ CK, PE, H1, 2, 3, 4, DE
ent from the five aforementioned translocations, in that
pBPC1 ⫹ CK, PE, H1, 2, 3, 4, DE
its hypoploid has eight discrete bands but it lacks the
pBPC2 ⫹ CK, PE, H1, 2, 3, 4, DE
intense smeared background and a 2.0-kb band (Figure
pBPC3 ⫹ CK, PE, H1, 2, 3, 4, DE
pBPC6 ⫹ CK, PE, H1, 2, 3, 4, DE 6A, lane 10). TB-10L32 has a signal pattern comparable
pBPC8 ⫹ CK, PE, H1, 2, 3, 4, DE to that of TB-10L26, but its hypoploid deletes a 2.8-kb
pBPC29 ⫹ CK, PE, H1, 2, 3, 4, DE band, which, apparently, is located between the two
pBPC31 ⫹ CK, PE, H1, 2, 3, 4, DE
breakpoints (Figure 6A, lane 12). Results imply that
pBPC43 ⫹ CK, PE, H1, 2, 3, 4, DE
pBPC51 is a repetitive sequence spreading in a region
pBPC49 ⫹ CK, PE, H1, 2, 3, 4, DE
from TB-10L38 to TB-10L20, and the last two
transloca-pBPC5 ⫺b
tions break in the middle of the region with TB-10L26
pBPC15 ⫺
pBPC32 ⫺ proximal to TB-10L32 (Figure 7).
pBPC42 ⫺ Figure 6B illustrates results of mapping pBPC50 to
pBPC45 ⫺ the similar location. Hybridization signal appears in
pBPC52 ⫺
both L289⫹1B and L289⫹0B with the exception of
aDetectable hybridization signals on the B chromosome. three bands (2.3, 5.3, and 6.6 kb). The 2.3- and 6.6-kb bNo hybridization signals on the B chromosome.
bands are present in the former, but deleted in the
cPosition of B signals: BS, short arm; CK, centromeric knob;
latter, and the third one is present in the DNA of both, PE, proximal euchromatic region; H1, 2, 3, 4, distal
hetero-but its intensity is much (at least fivefold) stronger in chromatic regions; DE, distal euchromatic tip.
the former than in the latter (Figure 6B, lanes 1 and 2). The sequence was mapped on the basis of these polymorphic signals. The 5.3-kb band is present in the hypoploid progeny contains a 10-B but no B-10. The
hyperploid and hypoploid of seven translocations, but hyperploid plant, on the other hand, carries a 10-B and
reduced in the hypoploids of TB-10L20 and TB-10L36 two B-10’s (seematerials and methods). When a B
(Figure 6B, lanes 14 and 16). The pattern of the 2.3-kb signal is present in the hypoploid DNA, it must be
lo-cated distal to the breakpoint, that is, on the 10-B. On band in the seven translocations is identical to that of
Figure4.—FISH analysis
TABLE 4
Sequence analysis of 19 B sequences
Nucleotide comparisons
Clone no. Size (bp) Sequence in GenBank Xa Yb Zc
pBPC1 248 Maize clone ZMMBBb_0138B04 5–238 94 40
Maizebz1genomic region 1–246 92
pBPC2 239 Maize 22-kD␣zeingene cluster 12–33 100 22
Also 163–239 84
pBPC3 292 Maize alcohol dehydrogenase 1 gene 202–252 98 64
Also 1–184 87
pBPC4 301 None — — 58
pBPC6 743 None — — 44
pBPC7 396 Maize 22-kD␣zeingene cluster 2–312 93 115
pBPC8 349 None — — 107
pBPC14 620 None — — 94
pBPC16 345 Maizebz1genomic region 167–196 96 27
Also 133–224 88
pBPC21 215 Maize 180-bp knob-specific repeat 3–182 95 69
pBPC23 399 Maize 180-bp knob-specific repeat 35–214 95 124
Also 215–394 98
pBPC28 373 Maize 19-kDzeinprotein 1–109 93 54
pBPC29 354 None — — 100
pBPC31 184 Maize retroelement PREM-2gaggene 3–181 94 28
Maize 22-kD␣zeingene cluster 9–184 93
pBPC43 411 Maize 19-kDzeinprotein 98–147 96 72
pBPC48 244 Maize 22-kD␣zeingene cluster 1–244 90 68
pBPC49 254 Maizebz1genomic region 11–254 97 34
pBPC50 262 None — — 32
pBPC51 329 Maize B centromere sequence 293–325 90 44
aThe portion of a B sequence in terms of the nucleotide position that is the most homologous to the
GenBank sequence.
bIdentity of X between B and GenBank sequences. cThe longest possible open reading frame.
the 5.3-kb band except for TB-10L26, TB-10L32, TB- genes or sequences. By using FISH and B-10L transloca-tions, these sequences were mapped to various B regions. 10L20, and TB-10L36, where the 2.3-kb band is absent
Unexpected products appeared in the PCR amplifi-in the hypoploids (Figure 6B, lanes 10, 12, 14, and 16).
cation. These products were observed in the first PCR The last B signal (6.6 kb) has a signal pattern similar
with and without B DNA template. The reaction without to that of the 2.3-kb band, although its intensity is
re-B DNA generated more products than that with re-B DNA duced in the hypoploids of TB-10L26 and TB-10L32
(Figure 2A, lanes 2, 3, and 5). For the products of the (Figure 6B, lanes 10 and 12). These results place
latter, only a minor fraction hybridized with maize DNA pBPC50 in two regions of B chromosome: one between
(Figure 2B, lane 3), but for the products of the former, 10L38 and 10L26 and the other between
TB-no hybridization was observed (Figure 2B, lanes 2 and 10L32 and TB-10L20 (Figure 7). In addition, since the
5). This result is not an artifact of PCR because the PCR other hybridization signals are present in L289 ⫹ 0B,
products of genomic (B73) DNA included in the same they are also located in A chromosomes, but their exact
assay hybridized strongly with maize DNA (Figure 2, A location is not clear.
and B, lane 4) as would be expected. Apparently, the unexpected products result from DNA contamination of an unknown source. They were favorably amplified DISCUSSION
Figure5.—Pachytene structure of the B chromosome and seven B-10L translocations. (A) B chromosome. (B) TB-10L7. (C) TB-10L16. (D) TB-10L38. (E) TB-10L26. (F) TB-10L32. (G) TB-10L20. (H) TB-10L36. The breakpoint of TB-10L7 and TB-10L16 could not be determined, since the PE region is cytologically indistinguishable from the euchromatic region of the long arm of chromosome 10. Arrow marks the breakpoint of a translocation.
first reaction suppressed amplification of the contami- identified a separate repetitive sequence and also mapped it to the knobs of both B and A chromosomes. Some nated DNA. When B73 DNA was not present, the
con-taminated DNA was predominantly amplified. Similar copies of the sequence were located in the A euchro-matic region and others were located in the distal het-results were documented bySteinet al.(1998). They
isolated the short arm of maize pachytene chromosome erochromatic block of the BL. Recently,Alfenitoand Birchler (1993) isolated eight B-centromeric se-6 by microdissection and amplified with
linker-adaptor-mediated PCR, which produced substantial products quences, each about 10 kb in size. One sequence
(EMBL3-8Bb, 9.8 kb) was analyzed in great detail. It without DNA template. The products did not hybridize
with maize DNA. They explained that enzyme solution consists of two subsequences, one (ⵑ6.4 kb) of which shares homology with A chromosome(s) and the other containing bacterial DNA might be the source of
con-tamination. Yet, contamination in other reagents may (2.9 plus 0.5 kb) is B specific.Starket al.(1996) probed the mitotic metaphase B chromosome with labeled ge-also be the source.
Most B DNA is in common with DNA of the A chromo- nomic DNA without B and noted that the hybridization signal spread over the entire length of the B chromo-somes. This is evidence that 18 B sequences hybridized
with DNA of both B and A chromosomes (Table 2), some. Similar situations also occur in other plant spe-cies. Sandery et al. (1991) isolated a rye B sequence indicating that most B sequences have counterparts in
the A chromosomes. This observation conforms to ear- by microdissection and microcloning. This sequence
hybridized with both B and A chromosomes. Houben
lier reports. Peacock et al. (1981) isolated a 185-bp
Figure 6.—Mapping two B sequences by seven B-10L translocations. DNA was di-gested withBamHI and probed with pBPC51 (A) and pBPC50 (B). Signal of pBPC51 and the 6.6-kb band of pBPC50 were absent in the hypoploids of TB-10L20 and TB-10L36, reduced in that of 10L26 and TB-10L32, and present in that of other translocations. The 5.3-kb band of pBPC50 was re-duced in the hypoploids of TB-10L20 and TB-10L36, and the 2.3-kb band was deficient in the hypoploids of 10L26, 10L32, 10L20, and TB-10L36. Lane 1, L289⫹1B; lane 2, L289 ⫹ 0B; lane 3, hyper-ploid of TB-10L7; lane 4, hypo-ploid of TB-10L7; lane 5, hy-perploid of TB-10L16; lane 6, hypoploid of TB-10L16; lane 7, hyperploid of TB-10L38; lane 8, hypoploid of TB-10L38; lane 9, hyperploid of TB-10L26; lane 10, hypoploid of TB-10L26; lane 11, hyperploid of TB-10L32; lane 12, hypoploid of TB-10L32; lane 13, hyperploid of TB-10L20; lane 14, hypoploid of TB-10L20; lane 15, hyperploid of TB-10L36; lane 16, hypoploid of TB-10L36. Bottom panel of A is the internal control for DNA quantity. It was prepared by stripping the pBPC51 probe from the blot (top) before hybridizing with umc133(chromosome 6). Size markers are indicated on the left.
B-PCR products showed hybridization in both samples and 1 other is highly homologous to the gaggene of maize retroelement. The remaining 8 sequences either with and without B chromosomes.Jamilenaet al.(1995)
isolated the B chromosome ofCrepis capillarisby micro- are in the noncoding regions of known genes or show no identity to any published sequence. It is possible dissection and amplified it by DOP-PCR, the products of
which hybridized with the A chromosomes. A B-specific that they are representatives of mobile inverted-repeat elements (BureauandWessler1994) or other related library was constructed from the products and 100
clones were analyzed, none of which is B specific. Taken sequences.
Yet, not all B sequences are homologous to A chromo-together the results suggest that the sequences in B and
A chromosomes are very much alike. somes; few are B specific. One (pBPC51) of 19 B
se-quences isolated in the current study is B specific (Table Most B sequences shared by the B and A
chromo-somes may be of retroelement or other related DNA 2). It was mapped to the BL region between the
breakpoints of TB-10L38 and TB-10L20, covering about origin. Fourteen B sequences of this study showed either
absence of or partial B-dosage response (Table 2). Two one-third of the B chromosome (Figure 7). FISH analy-sis confirmed this map location (Figure 4A). Another of these, pBPC21 and pBPC23, are knob-specific
se-quences (Table 4), and 12 others had FISH signal in clone (pBPC50), partially B specific, is located in the same regions, but its distribution in the regions is discon-almost all B regions (Table 3) and A chromosomes (data
not shown). Such wide B distribution and no B-dosage tinuous (Figures 4B and 7). These are the first maize B sequences mapped to the BL and to a large chromo-response are consistent with the nature of widely
dis-persed retroelements (or other related DNA). This no- some region. Two other maize sequences specific to the tion is supported by the finding that 3 of the above B chromosome have been published before. The first
sequences are highly homologous to the LTR region sequence (pZmBs) was obtained by Alfenito and
Birchler (1993) and mapped to the B centromere. The second one (pBGBM18.2) was isolated byStarket al.(1996) from the PCR products of a B-specific ran-domly amplified polymorphic DNA marker, and its posi-tion on the B chromosome was not determined. In rye, two B-specific sequences, E1100 and E3900, were cloned from two partial libraries made from theDraI andEcoRI digests, respectively, of DNA carrying B’s. The former was from a 1.1-kb band (Sandery et al. 1990), and the latter was from a 3.9-kb band (Blundenet al.
Figure7.—Map position of pBPC50 (—) and pBPC51 (…)
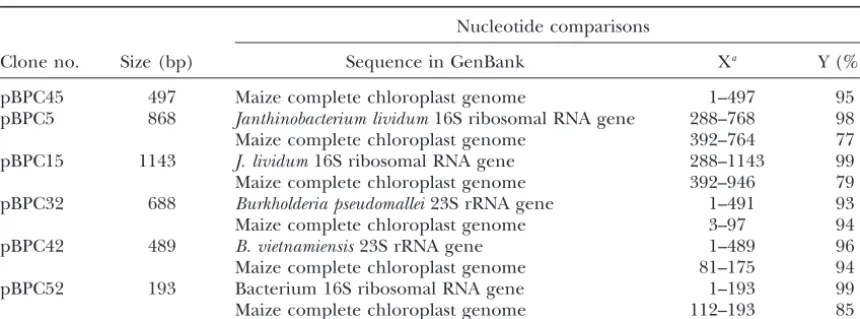
TABLE 5
Sequence analysis of six non-B sequences isolated by microdissection
Nucleotide comparisons
Clone no. Size (bp) Sequence in GenBank Xa Y (%)b
pBPC45 497 Maize complete chloroplast genome 1–497 95
pBPC5 868 Janthinobacterium lividum16S ribosomal RNA gene 288–768 98
Maize complete chloroplast genome 392–764 77
pBPC15 1143 J. lividum16S ribosomal RNA gene 288–1143 99
Maize complete chloroplast genome 392–946 79
pBPC32 688 Burkholderia pseudomallei23S rRNA gene 1–491 93
Maize complete chloroplast genome 3–97 94
pBPC42 489 B. vietnamiensis23S rRNA gene 1–489 96
Maize complete chloroplast genome 81–175 94
pBPC52 193 Bacterium 16S ribosomal RNA gene 1–193 99
Maize complete chloroplast genome 112–193 85
aThe portion of a non-B sequence in terms of the nucleotide position that is the most homologous to the
GenBank sequence.
bIdentity of X with the GenBank sequence.
long arm byin situhybridization (Blundenet al.1993). or PCR amplification. One (pBPC45) of the 6 sequences has its entire sequence homologous with maize chloro-InBrachycome dichromosomatica, a 176-bp tandem repeat
sequence (pBd49) likewise unique to the B chromo- plast genome sequences (95% identity) and the
re-maining 5 were homologous with prokaryotic ribosomal some was isolated by subtractive DNA hybridization, but
its position has not been determined (Johnet al.1991). RNA genes (⬎93% identity) as well as chloroplast se-quences (77–94% identity; Table 5). These sese-quences The location of B sequence detected by FISH analysis
agrees with that mapped by B-10L translocations with were used to probe the pachytene B chromosome in
FISH analysis, and none hybridized with either B (Table minor exceptions. The FISH signal of pBPC51 was
lo-cated on all B regions but PE and DE (Figure 4A; Table 3) or A chromosome (data not shown), indicating a non-B, non-A origin. Contamination of the chloroplast 3). Accordingly, the B signal in Southern analysis is
expected to appear in the hypoploid of TB-10L36 car- sequence might arise from chloroplast DNA present
either on the pachytene B chromosome or in regions rying H4 and DE (Figure 7), but the result is contrary
to this expectation. The B signal was in the hyperploid nearby on the slide. Yet, it is questionable that the source of contamination would be the same for 5 other se-but not in hypoploid of TB-10L36 (Figure 6A, lanes 15
and 16). A similar minor discrepancy was observed in quences. Alternatively, the contamination may originate from PCR reagents.
comparison of the FISH map (Figure 4A) with the B-A
translocation map (Figure 7). In the first map, pBPC51 Contrary to the FISH analysis, all six sequences hybrid-ized strongly with maize genomic DNA; all expressed was located in H1 in addition to other regions, but in
the second map, it was not in this region. Such a differ- strong signals of multiple bands (Figure 3B2; Table 2). That these sequences hybridized in Southern analysis ence was noted previously byAlfenitoandBirchler
(1993). They mapped a B-specific sequence to the cen- with the genomic DNA but did not hybridize in FISH analysis with chromosomes A or B implies the contami-tromere by using hypoploids of TB-10L18 and TB-10Sc,
butin situhybridization located it to the centromere as nation of organelle DNA during extraction of genomic DNA. This explanation is understandable for pBPC45, well as the junction of H4 and DE. They attributed
such variation to lower stringency associated with in as plant genomic DNA extracted by conventional proto-cols carries a substantial amount of chloroplast DNA situprotocols that promote hybridization of part of the
probe to the H4-DE junction, which is not detectable (Zhang et al.2002). The same explanation can be ex-trapolated to the other five sequences, because parts of by Southern analysis. In this study, the major stringency
variation between the two analyses is the wash condi- these sequences are also homologous to maize chloro-plast sequences (Table 5). Consistent with this view is tions, which is high stringency (0.1⫻ SSC, 0.1% SDS)
in Southern blotting but low stringency (2⫻ SSC, 0% the fact that the same signal intensity was detected be-tween 6B and 16B DNA (Figure 3B2). Yet, why the signal SDS) in FISH analysis. Also different is the hybridization
temperature, which is 42⬚in the former but 37⬚in the of 0B DNA is consistently less intense than that of 6B DNA is still unclear.
latter.
Lin, B.-Y., 1972 Synthesis of a set of B-A translocations involving a 13 were homologous to the noncoding region of maize
given segment of chromosome 10. Maize Genet. Coop. News genes, includingbz1,adh1, a 22-kDzeingene, and a 19- Lett.46:193–194.
Lin, B.-Y., 1974 TB-10 breakpoints and marker genes on the long kDzein gene, located on chromosomes 9, 1, 4, and 7,
arm of chromosome 10. Maize Genet. Coop. News Lett.48:182– respectively. In addition, 15 sequences (Table 3) showed
184.
FISH signals in most B regions and also displayed broad Lin, B.-Y., 1978 Regional control of nondisjunction of the B-chromo-some in maize. Genetics90:613–627.
signals in 20 A chromosomes (data not shown). Five
Lin, B.-Y., 1979 Two new B-10 translocations involved in the control major knobs showing FISH signals of pBPC21 are
lo-of nondisjunction lo-of the B-chromosome in maize. Genetics92:
cated on 5 different chromosomes (data not shown) as 931–945.
Lin, B.-Y., 1982 Association of endosperm reduction with paternal noted in the Black Mexican maize by Peacock et al.
imprinting in maize. Genetics100:475–486. (1981). Accordingly, the data are in agreement with the
Lin, B.-Y., andH.-P. Chou, 1997 Physical mapping of four RAPDs view that the B chromosome may evolve from multiple in the B-chromosome of maize. Theor. Appl. Genet.94:534–538.
Lin, B.-Y., S.-F. Peng, Y.-J. Chen, H.-S. ChenandC.-F. Kao, 1997 A chromosomes of maize, as proposed by Pageet al.
Physical mapping of RFLP markers on four chromosome arms (2001). They uncovered a centromere sequence of
chro-in maize uschro-ing termchro-inal deficiencies. Mol. Gen. Genet.256:509–
mosome 4 that is homologous to the B centromere. In 516.
Page, B. T., M. K. WanousandJ. A. Birchler, 2001 Characteriza-consideration of the finding in conjunction with the
tion of a maize chromosome 4 centromeric sequence: evidence cytological distribution of knobs, they suggested, as one
for an evolutionary relationship with the B chromosome centro-possibility, “that the B-chromosome is a conglomerate mere. Genetics159:291–302.
Peacock, W. J., E. S. Dennis, M. M. RhoadesandA. J. Pryor, 1981 of heterochromatinized sequences from several
chro-Highly repeated DNA sequence limited to knob heterochromatin mosomes” (p. 301).
in maize. Proc. Natl. Acad. Sci. USA78:4490–4494.
Phillips, R. L., and A. S. Wang, 1982 In situhybridization with We are grateful to J. Birchler for the FISH protocol, J.-C. Ju for
maize meiotic cells, pp. 121–122 inMaize for Biological Research, providing the micromanipulator, and C.-H. Chen for technical
assis-edited by W. F.Sheridan. Plant Molecular Biology Association, tance.
Charlottesville, VA.
Randolph, L. F., 1941 Genetic characteristics of the B-chromosomes in maize. Genetics26:608–631.
Rhoades, M. M., 1968 Studies on the cytological basis of crossing LITERATURE CITED
over, pp. 229–241 inReplication and Recombination of Genetic
Mate-Alfenito, M. R., andJ. A. Birchler, 1993 Molecular characteriza- rial, edited by W. J.Peacockand R. D.Brock. Australian Academy tion of a maize B-chromosome centric sequence. Genetics135: of Science, Canberra, Australia.
589–597. Roman, H., 1947 Mitotic nondisjunction in the case of interchanges
Beckett, J. B., 1978 B-A translocations in maize. J. Hered.69:27–36. involving the B-type chromosome in maize. Genetics32:391–409.
Benson, G., 1999 Tandem repeats finder: a program to analyze DNA Roman, H., andA. J. Ullstrup, 1951 The use of A-B translocations sequences. Nucleic Acids Res.27:573–580. to locate genes in maize. Agron. J.43:450–454.
Birchler, J. A., 1979 A study of enzyme activities in a dosage series Saghai-Maroof, M. A., K. M. Soliman, R. A. JorgensenandR. W. of the long arm of chromosome one in maize. Genetics 92: Allard, 1984 Ribosomal DNA spacer-length polymorphisms
1211–1229. in barley: Mendelian inheritance, chromosomal location, and
Blunden, R., T. J. Wilkes, J. W. Forster, M. M. Jimenez, M. J. population dynamics. Proc. Natl. Acad. Sci. USA81:8014–8018. Sanderyet al., 1993 Identification of the E3900 family, a second Sambrook, J., E. F. FritschandT. Maniatis, 1989 Molecular Clon-family of rye B-chromosome specific repeated sequences. Ge- ing : A Laboratory Manual, Ed. 2. Cold Spring Harbor Laboratory
nome36:706–711. Press, Plainview, NY.
Bureau, T. E., and S. R. Wessler, 1994 Mobile inverted-repeat Sandery, M. J., J. W. Forster, R. BlundenandR. N. Jones, 1990 elements of the tourist family are associated with the genes of Identification of a family of repeated sequences on the rye many cereal grasses. Proc. Natl. Acad. Sci. USA91:1411–1415. B-chromosome. Genome33:908–913.
Burnham, C. R., 1982 Details of the smear technique for studying Sandery, M. J., J. W. Forster, S. R. Macadam, R. Blunden, R. N. chromosomes in maize, pp. 107–118 inMaize for Biological Research, Joneset al., 1991 Isolation of a sequence common to A- and edited by W. F.Sheridan. Plant Molecular Biology Association, B-chromosomes of rye (Secale cereale) by microcloning. Plant Mol.
Charlottesville, VA. Biol. Rep.9:21–30.
Chilton, M.-D., andB. J. McCarthy, 1973 DNA from maize with Stark, E. A., I. Connerton, S. T. Bennett, S. R. Barnes, J. S. Parker and without B-chromosomes: a comparative study. Genetics74: et al., 1996 Molecular analysis of the structure of the maize
605–614. B-chromosome. Chromosome Res.4:15–23.
Dennis, E. S., andW. J. Peacock, 1984 Knob heterochromatin ho- Stein, N., N. Ponelies, T. Musket, M. McMullenandG. Weber, mology in maize and its relatives. J. Mol. Evol.20:341–350. 1998 Chromosome micro-dissection and region-specific
librar-Houben, A., R. G. Kynast, U. Heim, H. Hermann, R. N. Joneset al., ies from pachytene chromosomes of maize (Zea maysL.). Plant 1996 Molecular cytogenetic characterization of the terminal J.13:281–289.
heterochromatic segment of the B-chromosome of rye (Secale Tatusova, T. A., andT. L. Madden, 1999 Blast 2 sequences—a new
cereale). Chromosoma105:97–103. tool for comparing protein and nucleotide sequences. FEMS
Jamilena, M., M. Garrido-Ramos, M. R. Rejo´ n, C. R. Rejo´ nand Microbiol. Lett.174:247–250.
J. S. Parker, 1995 Characterization of repeated sequences from Telenius, H., N. P. Carter, C. E. Bebb, M. Nordenskjo¨ ld, B. A. J. microdissected B-chromosomes ofCrepis capillaris.Chromosoma Ponderet al., 1992 Degenerate oligonucleotide-primed PCR:
104:113–120. general amplification of target DNA by a single degenerate
John, U. P., C. R. LeachandJ. N. Timmis, 1991 A sequence specific primer. Genomics13:718–725.
to B-chromosomes ofBrachycome dichromosomatica.Genome34: Viotti, A., E. Privitera, E. SalaandN. Pogna, 1985 Distribution
739–744. and clustering of two highly repeated sequences in the A and
Kasza´s, E´ ., A. KatoandJ. A. Birchler, 2002 Cytological and molec- B-chromosomes of maize. Theor. Appl. Genet.70:234–239. ular analysis of centromere misdivision in maize. Genome45: Zhang, X.-H., R. G. Ewy, J. M. Widholmand A. R. Portis, Jr.,
759–768. 2002 Complementation of the nuclear antisenserbcS-induced
Lee, C., R. Stanyon, C.-C. Lin andM. A. Ferguson-Smith, 1999 photosynthesis deficiency by introducing anrbcSgene into the Conservation of human gamma-X centromeric satellite DNA tobacco plastid genome. Plant Cell Physiol.43:1302–1313. among primates with an autosomal localization in certain Old