DOI: 10.1534/genetics.104.026351
Selective and Mutational Patterns Associated With Gene Expression in Humans:
Influences on Synonymous Composition and Intron Presence
Josep M. Comeron
1Department of Biological Sciences, University of Iowa, Iowa City, Iowa 52242
Manuscript received January 8, 2004 Accepted for publication March 23, 2004
ABSTRACT
We report the results of a comprehensive study of the influence of gene expression on synonymous codons, amino acid composition, and intron presence and size in human protein-coding genes. First, in addition to a strong effect of isochores, we have detected the influence of transcription-associated muta-tional biases (TAMB) on gene composition. Genes expressed in different tissues show diverse degrees of TAMB, with genes expressed in testis showing the greatest influence. Second, the study of tissues with no evidence of TAMB reveals a consistent set of optimal synonymous codons favored in highly expressed genes. This result exposes the consequences of natural selection on synonymous composition to increase efficiency of translation in the human lineage. Third, overall amino acid composition of proteins closely resembles tRNA abundance but there is no difference in amino acid composition in differentially expressed genes. Fourth, there is a negative relationship between expression and CDS length. Significantly, this is observed only among genes with introns, suggesting that the cause for this relationship in humans cannot be associated only with costs of amino acid biosynthesis. Fifth, we show that broadly and highly expressed genes have more, although shorter, introns. The selective advantage for having more introns in highly expressed genes is likely counterbalanced by containment of transcriptional costs and a minimum exon size for proper splicing.
P
OPULATION genetics theory predicts that traits prints of selection on exon composition and intronpres-under weak selection in species with large effective ence and size. Finally, recent genomic analyses in species
population size (Ne;e.g.,Saccharomyces cerevisiae,Drosoph- with no clear isochore structure such as yeast,
Drosoph-ila melanogaster,Caenorhabditis elegans, etc.), will exhibit ila, andC. elegans show that gene composition, length
a weaker (if any) signature of selection in humans, with a of CDS, and intron features are not independent
pa-smaller long-termNe(LiandSadler1991;Wall2003). rameters (PowellandMoriyama1997;Moriyamaand
Additionally, the ability to detect this signature at a Powell 1998; Comeron et al. 1999; Coghlan and
genomic level in the human lineage is complicated by Wolfe2000;ComeronandKreitman2000, 2002;Hey
other factors. The most significant one is the heteroge- andKliman2002), and therefore their response to
dif-neous structure of the genome, which is observed at the ferent levels of expression and to selection in general
level of nucleotide composition (i.e., isochoric structure; ought to be investigated simultaneously.
Bernardi 1995; Nekrutenko and Li 2000) and also The influence of selection on gene composition,
espe-for features such as expression patterns (D’Onofrio cially on the unequal use of synonymous codons, has
2002; Lercher et al. 2002) and gene structure [i.e., been the archetypal example of a trait under weak
selec-length of the coding sequence (CDS) and introns tion in species with large Ne (Sharp and Li 1986; Li
(Mouchiroud et al. 1991; Duret et al.1995; Lander 1987;Shieldset al.1988;KlimanandHey1993; Mori-et al.2001)]. Whether these large-scale genomic features
yamaandHartl1993;Hartlet al.1994;Akashi1995,
have coevolved due to selection is under debate (Duret 1996, 2003; PowellandMoriyama1997;Comeronet
et al. 2002; Lercheret al. 2003), but this multifaceted
al.1999;DuretandMouchiroud1999;Llopartand
mosaic structure clearly makes the distinction between
Aguade2000;Begun2001;McVeanandVieira2001; coincidental and causative associations not trivial. The
Duret2002;HeyandKliman2002;Carliniand
Ste-second confounding factor is the large fraction (⬎30%)
phan2003). Indeed, two different features are observed
of human genes showing alternative splicing forms
in several model eukaryotes such asSaccharomyces
cerevis-(Landeret al.2001), which might obscure the
finger-iae,Drosophila melanogaster,Caenorhabditis elegans, and Ar-abidopsis thaliana. First, differences in synonymous co-don usage are associated with differences in expression
1Address for correspondence:Department of Biological Sciences,
Uni-levels (Ikemura1985;SharpandLi1987;Duretand
versity of Iowa, 212 Biology Bldg. (BB), Iowa City, IA 52242.
E-mail: [email protected] Mouchiroud 1999; Duret 2000). Second, highly
MATERIALS AND METHODS
pressed genes show a set of synonymous codons that
correspond mainly to abundant tRNAs (Ikemura1985; Sequence data:Genomic sequences were obtained from
Gen-MoriyamaandPowell1997;DuretandMouchiroud Bank, Build 31 ( January 3, 2003) available at ftp://ftp.ncbi.nih. gov/genomes/H_sapiens/. Information on alternative splicing
1999; Coghlan and Wolfe 2000; Duret 2000). The
was extracted from the National Center for Biotechnology
combination of both observations strongly supports the
Information (NCBI) Reference Sequence database (http://
action of selection at the level of translational efficiency
www.ncbi.nlm.nih.gov/RefSeq/ index.html; January, 2003)
(i.e., translational selection), increasing either accuracy using nonredundant human mRNA sequences (hs.gbff) for
or speed of translation (Ikemura1985; Bulmer1991; known genes (i.e., predicted genes were not used). Only
nu-clear genes with complete information on protein-coding se-Kurland1992).
quence, a CDS⬎300 bp, and no evidence of multiple-splicing
Nevertheless, the evidence supporting translational
se-forms were included in this study. Altogether, we obtained
infor-lection in humans has been—at best—arguable (Eyre- mation for a total of 11,441 genes (list available upon request).
Walker 1999; Iida and Akashi 2000; Urrutia and Microarray data: Expression data for human tissues were obtained from a high-throughput gene expression study of Hurst2001;Duret2002;Galtier2003) and the
iso-the normal mammalian transcriptome (Suet al.2002; http://
choric structure of the genome is, with certainty, the most
expression.gnf.org; April 2003) based on hybridization to
influential factor shaping synonymous composition.
high-density arrays (GLP91 platform; Affymetrix U95A). A
Other factors, such as multiple-splicing forms, method- total of 5280 genes (4876 with introns) overlapped with those
ological biases introduced by the use of serial analysis described above and were used in this study.
Presence/ab-sence for each probe/transcript (the Absolute Call) was
deter-of gene expression (SAGE) or expressed sequence tag
mined for each sample from the reference series GSE96 using
(EST) studies (Margulieset al.2001), pooling of data
Affymetrix MAS4 algorithm, as reported in NCBI’s Gene
Ex-from different tissues, and the overlaying effect of selec- pression Omnibus (Edgaret al.2002). Levels of expression
tion at certain synonymous sites influencing pre-mRNA were investigated using positive AD values only in genes with
validated presence. Nineteen tissues were investigated using
structures (Shen et al.1999; Duanet al. 2003), might
a total of 45 samples: adrenal gland, brain (fetal and adult),
all have played a part in the inability to detect reliable
liver (fetal and adult), heart, kidney, lung, ovary pool,
pan-patterns of translational selection in the human lineage.
creas, pituitary gland, placenta, prostate, salivary gland, spinal
On the other hand, it is well known that intron size cord, spleen, testis, thymus, thyroid, trachea, and uterus.
and presence vary considerably between homologous Two different measures of expression were used in this
study: breadth of expression (Expressionbreadth; Duret and
genes. Several studies have applied population-genetic
Mouchiroud2000;UrrutiaandHurst2001), which is the
techniques to provide a primary insight on modes of
number of tissues in which transcription is detected (ranging
selection that could explain the proliferation and
main-up to 19 tissues), and the level of transcription within each
tenance of spliceosomal introns as well as their variation of these 19 tissues (Expression
level). Genes are defined as
ubiq-in size (Stephan et al. 1994; Leicht et al. 1995; Car- uitously or narrowly expressed if they are expressed in⬎14
(1497 genes) and⬍3 (1732 genes) tissues, respectively. We valhoandClark1999;ComeronandKreitman2000;
have avoided using measures of expression based on pooled Llopart et al. 2002; Lynch 2002; Schaeffer 2002;
or mean levels of transcription from different tissues because Parsch 2003). Moreover, recent studies in humans these latter measures are more dependent on breadth of ex-(Castillo-Daviset al.2002;UrrutiaandHurst2003) pression (Urrutia and Hurst 2003) and they are highly
suggest the action of selection favoring short introns in sensitive to the particular set of tissues chosen for the analysis
and to possible differences in overall expression levels. We
highly expressed genes, possibly due to the beneficial
also avoided using transcription information based on SAGE
effects of reducing transcriptional costs (time and
en-because of its known GC content bias (Margulieset al.2001)
ergy;Castillo-Daviset al. 2002). Nonetheless, the evo- that could not only influence the analysis of expression and
lution of introns cannot be understood independently composition but also generate spurious clustering of
expres-of the known impact expres-of intronic sequences on down- sion across the genome in association with different isochores.
BLAST searches and CpG islands: Local alignments
be-stream mRNA metabolism (Sun and Maquat 2000;
tween human and mouse (Mus musculus) orthologous intron Zhou et al. 2000; Le Hir et al. 2001; Yu et al. 2002),
sequences were used to estimate the number of conserved sites
splicing efficiency (KlinzandGallwitz1985;Sterner in introns by applying BLASTn searches (Altschulet al.1997).
et al.1996), and overall gene regulation. BLASTn searches are highly sensitive to the set of parameters
used, most conspicuously when fairly divergent sequences are
Here, we report a comprehensive study of the
influ-compared, but there is no reason to presume a systematic bias
ence of gene expression on both composition and
in-when comparing broadly and narrowly expressed genes. We
tron presence and size in human protein-coding genes
used a word size set to 11 and masked off segments of the human
with no evidence of multiple-splicing forms. The appli- introns that have low compositional complexity and human
re-cation of several approaches to take into account back- peats (http://www.ncbi.nlm.nih.gov/blast). The presence of
CpG islands was predicted with the program NewCpGreport
ground effects and the study of expression (i.e.,
tran-(EMBOSS v.2.3.1. package) using default parameters. As
ex-scription) in different tissues based on microarray data
pected, both approaches reveal higher percentages of CpG
allow detection of the signature of natural selection islands and conserved sites in first introns than in other
in-on both traits and transcriptiin-on-associated mutatiin-onal trons, which is a positive control for these methods.
Statistical analyses:All correlation coefficients reported in
this study were obtained using all genes independently, avoiding the approach of subdividing genes into groups to later investigate relationships among groups. Note that this latter approach is equally valuable to detect statistically signifi-cant associations but it cannot be used to assess the actual strength of association. Statistical analyses were carried out using Statistica for Windows v.6 (StatSoft, Tulsa, OK).
RESULTS
Gene expression and nucleotide composition
Gene expression and amino acid composition:Total amino acid composition and tRNA abundance show a positive correlation in prokaryotes and in several eukary-otes, supporting the concept that selection has max-imized translation efficiency at the amino acid level (Ikemura1985;SharpandLi1986;Bulmer1991;
Kur-land1992;Duret 2000;AkashiandGojobori 2002;
Akashi2003). We also observe this trend in human pro-teins, with an overall amino acid composition that strongly resembles the relative number of corresponding tRNA
genes: nonparametric Spearman’s rank correlation,R⫽
⫹0.527;P⫽0.017. [We use the number of isoaccepting
tRNA genes as a proxy for cellular abundance of each
tRNA (Percudani et al.1997; Duret2000; Landeret
al.2001;Akashi2003)]. But, contrary to results using
SAGE (UrrutiaandHurst2003) and EST data, when
microarray data are used there is no detectable influ-ence of expression on amino acid usage. No amino acid
Figure 1.—(A) Association (Spearman’s rank correlation
increases its frequency in a gene, in any of the 19 tissues
R) between levels of expression within each tissue and the
under study, in association with Expressionlevel(seema- difference in composition between third position of codons
terials and methods) after sequential Bonferroni cor- and introns. Tissues are ordered according to the overall in-fluence of Expressionlevel. (B) Association (R) between
expres-rection for multiple tests (Rice1989). Congruently with
sion within each tissue and the G⫹T content in the coding
this lack of influence of expression on amino acid usage,
strand of introns (Gi⫹Ti) as a measure of strand asymmetry.
there is no evidence for a better fit to tRNA abundance Open symbols indicate nonsignificant (P⬎0.05) association
in highly expressed than in poorly expressed genes. For after sequential Bonferroni correction.
instance, amino acid composition of highly and poorly expressed genes in brain shows similar association with
tRNA abundance (R ⫽ ⫹0.548, P ⫽ 0.012 and R ⫽ pected to be associated with translational efficiency,
⫹0.568,P⫽0.009, respectively). shows the opposite tendency, with GC3 increasing with
Gene expression and synonymous base composition: Expressionlevel in all 19 tissues withRranging between
Many studies have shown that GC content at the third ⫹0.078 (P⫽6⫻10⫺6) and⫹0.393 (P⬍1⫻10⫺12). The
positions of codons (GC3) is greater than GC content same trend is observed for GC12 and GCi, increasing
at introns (GCi) or at the first and second position significantly with Expressionlevelalso in all 19 tissues, with
of codons (GC12) (our data set shows an average GC Rbetween⫹0.055 (P⫽0.0015) and⫹0.234 (P⬍1⫻
content of 58.3, 49.4, and 45.7%, for GC3, GC12, and 10⫺12) for GC12 and between⫹0.142 and⫹0.433 (P⬍
GCi, respectively). This overall difference has been 1⫻10⫺12) for GCi. The covariation of GC3 and GCi with
used, at times, as an argument in favor of selection on Expressionlevelexposes a strong nonselective component
synonymous base composition (although see discus- not specific to synonymous composition, with two
obvi-sion). ous possible causes for this observation: isochores and
Previous studies based on EST data (Duret 2002) transcription-associated mutational biases (TAMB).
revealed a negative relationship between GC3 and Ex- We investigated the influence of expression on
synon-pressionbreadth(see materials and methods), and this ymous base composition relative to that in introns for
is also observed using microarray data (R ⫽ ⫺0.120, each nucleotide separately. Figure 1A shows the
correla-P⬍1⫻10⫺12). On the other hand, the study of Expres- tion coefficient,R, between Expression
leveland the
ex-codons and introns. In testis and, to a lesser degree, in over, neither of these two methods reveal the codons that increase in frequency with expression.
prostate and pituitary gland, the influence of expression
There is no clear prediction on which tissues are most on synonymous composition can be explained by an
likely to exhibit the strongest link between expression equivalent influence of expression on intron
composi-and translational selection. However, we can predict on tion. On the other hand, tissues like spleen, heart,
pla-the basis of pla-the previous results that tissues showing no centa, liver, or kidney, show that C and, to a lesser degree,
or minimal TAMB should be those exhibiting clearer, G content at synonymous sites increases with expression
if any, patterns. Congruently, tissues least influenced by beyond mutational tendencies operating on whole
tran-TAMB (e.g., liver, spleen, heart, placenta, and kidney)
scripts, a first indication of translational selection in these
reveal a strong effect of expression on the usage of tissues.
synonymous codons, with several codons showing a posi-Transcription-associated mutational biases:
Transcrip-tive ⌬RSCU (Table 1). On the other hand, genes
ex-tion-associated repair is expected to cause strand
asymmet-pressed in testis (with strongest TAMB) expose only two ries, increasing G relative to C and T relative to A content
synonymous codons increasing significantly with
expres-of the coding strand (Sullivan1995;Greenet al.2003).
sion (the same two codons showing the strongest effect Then, we investigated consequences of TAMB by
mea-of expression in tissues with no TAMB). These results,
suring G ⫹ T content in the coding strand of introns
however, could be explained without invoking selection (Gi ⫹ Ti; Green et al.2003). As shown in Figure 1B,
if highly expressed genes cluster in GC-rich isochores genes expressed in testis show the greatest influence of
(see Introduction) and therefore we have compared
expression on Gi ⫹ Ti (R⫽ ⫹0.146,P ⬍ 1⫻ 10⫺12),
highly and poorly expressed genes in rich and GC-evidencing TAMB, followed by genes expressed in
thy-poor isochores separately (we defined three isochore roid, prostate, and pituitary gland. Conversely, genes
categories with equivalent gene numbers based on GCi). expressed in liver, spleen, kidney, heart, and placenta
A conservative definition of optimal codons then refers show no evidence of TAMB. Note that tissues for which
to codons showing strong positive ⌬RSCU in both
GC-a chGC-ange in synonymous composition cGC-annot be
ex-rich and GC-poor isochores in tissues with no evidence of plained by a similar change in intron composition are
TAMB (e.g., liver and spleen). A total of 17 optimal codons
the same tissues showing weakest TAMB.
are consistently observed in tissues with no detectable Set of optimal synonymous codons in highly expressed
TAMB, 12 C- and 5 G-ending codons (see Table 1). genes:To investigate consequences of translational
se-In total, the frequency of optimal codons in a gene lection, we have looked into the set of synonymous codons
(Fop) increases with Expressionlevelin all tissues, withR
that increase in frequency with expression (i.e., optimal
ranging from ⫹0.100 (testis) to ⫹0.406 (spleen; P ⬍
codons). A caveat, however, should be mentioned since
1⫻10⫺12in all cases). Another measure that explores
translational selection depend on aspects of protein
the overall adaptation of codon usage taking into ac-translation while we used levels of transcription due to
count background mutational biases (isochoric and/or the scarcity of information on protein amounts. Here,
TAMB) is the ratio of GC-ending optimal to GC-ending we assume that transcript levels are strongly correlated
nonoptimal codons (GCoptimal/GCnonoptimal) in a gene (a
with protein levels. Table 1 shows the difference in the
ratio that should be computed using only amino acids
relative synonymous codon usage (RSCU; Sharp and with both optimal and nonoptimal GC-ending codons,
Li 1987; Duret and Mouchiroud 1999; Duret 2000) i.e., four- and sixfold degenerate amino acids). As
ex-between highly and poorly expressed genes (⌬RSCU). pected if the set of optimal codons properly describes
Highly and poorly expressed genes were defined as the consequences of translational selection, all tissues show
25% with highest and lowest levels, respectively, of de- a significant increase of GC
optimal/GCnonoptimalwith
Expres-tectable transcription within each tissue, to allow for differ- sion
level, with R ranging from ⫹0.139 to ⫹0.307 (P ⬍
ences in overall expression levels among tissues. We 1 ⫻ 10⫺12 in all cases). Note that this latter analysis
avoided using the effective number of codons (Wright reveals that the influence of expression on synonymous
1990), which is a measure of overall codon bias that is codon usage is also detectable, although to a much
not influenced by the number of codons under study lesser degree, in tissues such as testis where a
nonselec-(Wright1990;ComeronandAguade1998), because it tive component in association with expression (i.e.,
does not directly correct for differences in background TAMB) is the main influence on synonymous
composi-composition. On the other hand, a measure of codon tion. Figure 2 shows the relationship between GCoptimal/
bias that corrects for background composition such as GCnonoptimal and Expressionlevel for genes expressed in
MCB (UrrutiaandHurst2001) is strongly influenced liver, the tissue with least evidence of TAMB.
by the length of the CDS in a nonlinear manner (Urr- Frequency of optimal codons and CDS length: In
utia and Hurst 2001) and it exposes heterogeneity yeast, Drosophila, and nematodes, measures of codon
of synonymous base composition among amino acids usage bias correlate negatively with CDS length (
Mori-rather than bias in synonymous codon usage that might, yamaandPowell1998; Comeronet al. 1999;Duret
More-TABLE 1
Difference in codon usage (⌬RSCU) between highly and poorly expressed genes in three different tissues
Spleen Liver Testis
All GC rich GC poor All GC rich GC poor All GC rich GC poor
Asn AACa 0.37⫹⫹ 0.28⫹ 0.36⫹⫹ 0.32⫹⫹ 0.27⫹ 0.38⫹⫹ 0.09 0.03 0.16
AAT ⫺0.37 ⫺0.28 ⫺0.36 ⫺0.32 ⫺0.27 ⫺0.38 ⫺0.09 ⫺0.03 ⫺0.16
Asp GAC 0.36⫹⫹ 0.35⫹⫹ 0.31⫹⫹ 0.30⫹⫹ 0.27⫹ 0.28⫹ 0.04 ⫺0.02 0.09
GAT ⫺0.36 ⫺0.35 ⫺0.31 ⫺0.30 ⫺0.27 ⫺0.28 ⫺0.04 0.02 ⫺0.09
Cys TGC 0.35⫹⫹ 0.29⫹ 0.30⫹⫹ 0.27⫹ 0.20⫹ 0.27⫹ 0.06 0.00 0.04
TGT ⫺0.35 ⫺0.29 ⫺0.30 ⫺0.27 ⫺0.18 ⫺0.27 ⫺0.06 0.00 ⫺0.04
Gln CAA ⫺0.33 ⫺0.28 ⫺0.33 ⫺0.28 ⫺0.28 ⫺0.26 ⫺0.13 ⫺0.10 ⫺0.11
CAG 0.33⫹⫹ 0.28⫹ 0.33⫹⫹ 0.28⫹ 0.28⫹ 0.26⫹ 0.13 0.10 0.11
Glu GAA ⫺0.49 ⫺0.44 ⫺0.46 ⫺0.40 ⫺0.38 ⫺0.41 ⫺0.14 ⫺0.05 ⫺0.19
GAG 0.49⫹⫹ 0.44⫹⫹ 0.46⫹⫹ 0.40⫹⫹ 0.38⫹⫹ 0.41⫹⫹ 0.14 0.05 0.19
His CAC 0.41⫹⫹ 0.41⫹⫹ 0.36⫹⫹ 0.32⫹⫹ 0.32⫹⫹ 0.34⫹⫹ 0.09 0.07 0.07
CAT ⫺0.41 ⫺0.41 ⫺0.36 ⫺0.32 ⫺0.32 ⫺0.34 ⫺0.09 ⫺0.07 ⫺0.07
Lys AAA ⫺0.45 ⫺0.41 ⫺0.43 ⫺0.36 ⫺0.33 ⫺0.43 ⫺0.14 ⫺0.09 ⫺0.15
AAG 0.45⫹⫹ 0.41⫹⫹ 0.43⫹⫹ 0.36⫹⫹ 0.33⫹⫹ 0.43⫹⫹ 0.14 0.09 0.15
Phe TTC 0.43⫹⫹ 0.39⫹⫹ 0.41⫹⫹ 0.37⫹⫹ 0.34⫹⫹ 0.40⫹⫹ 0.12 0.06 0.13
TTT ⫺0.43 ⫺0.39 ⫺0.41 ⫺0.37 ⫺0.34 ⫺0.40 ⫺0.12 ⫺0.06 ⫺0.13
Tyr TAC 0.38⫹⫹ 0.31⫹⫹ 0.35⫹⫹ 0.31⫹⫹ 0.26⫹ 0.33⫹⫹ 0.10 0.05 0.17
TAT ⫺0.38 ⫺0.31 ⫺0.35 ⫺0.31 ⫺0.26 ⫺0.33 ⫺0.10 ⫺0.05 ⫺0.17
Ile ATA ⫺0.35 ⫺0.20 ⫺0.20 ⫺0.32 ⫺0.19 ⫺0.24 ⫺0.11 ⫺0.04 ⫺0.06
ATC 0.79⫹⫹ 0.47⫹⫹ 0.49⫹⫹ 0.67⫹⫹ 0.40⫹⫹ 0.48⫹⫹ 0.18 0.02 0.16
ATT ⫺0.44 ⫺0.26 ⫺0.29 ⫺0.35 ⫺0.21 ⫺0.24 ⫺0.07 0.01 ⫺0.10
Ala GCA ⫺0.49 ⫺0.21 ⫺0.24 ⫺0.37 ⫺0.16 ⫺0.21 ⫺0.16 ⫺0.04 ⫺0.09
GCC 0.61⫹⫹ 0.23⫹ 0.29⫹ 0.51⫹⫹ 0.21⫹ 0.27⫹ 0.14 0.02 0.09
GCG 0.14 0.08 0.07 0.10 0.03 0.05 0.02 ⫺0.01 0.04
GCT ⫺0.26 ⫺0.10 ⫺0.12 ⫺0.24 ⫺0.08 ⫺0.12 0.00 0.03 ⫺0.04
Gly GGA ⫺0.59 ⫺0.25 ⫺0.29 ⫺0.46 ⫺0.20 ⫺0.26 ⫺0.21 ⫺0.12 ⫺0.11
GGC 0.51⫹⫹ 0.23⫹ 0.22⫹ 0.45⫹⫹ 0.22⫹ 0.22⫹ 0.14 0.04 0.12
GGG 0.26⫹ 0.11 0.14 0.16 0.06 0.08 0.01 0.00 ⫺0.01
GGT ⫺0.18 ⫺0.08 ⫺0.07 ⫺0.15 ⫺0.08 ⫺0.05 0.07 0.08 0.00
Pro CCA ⫺0.39 ⫺0.16 ⫺0.18 ⫺0.35 ⫺0.19 ⫺0.14 ⫺0.11 ⫺0.07 ⫺0.08
CCC 0.56⫹⫹ 0.23⫹ 0.25⫹ 0.48⫹⫹ 0.22⫹ 0.26⫹ 0.12 0.05 0.09
CCG 0.17 0.08 0.08 0.14 0.07 0.05 0.03 0.00 0.05
CCT ⫺0.34 ⫺0.15 ⫺0.15 ⫺0.27 ⫺0.11 ⫺0.16 ⫺0.05 0.02 ⫺0.06
Thr ACA ⫺0.42 ⫺0.18 ⫺0.20 ⫺0.40 ⫺0.17 ⫺0.22 ⫺0.12 ⫺0.04 ⫺0.08
ACC 0.59⫹⫹ 0.33⫹⫹ 0.29⫹ 0.53⫹⫹ 0.28⫹ 0.33⫹⫹ 0.19 0.06 0.10
ACG 0.19 0.07 0.06 0.18 0.08 0.05 0.03 0.01 0.05
ACT ⫺0.36 ⫺0.23 ⫺0.15 ⫺0.31 ⫺0.18 ⫺0.16 ⫺0.10 ⫺0.03 ⫺0.08
Val GTA ⫺0.37 ⫺0.17 ⫺0.18 ⫺0.32 ⫺0.15 ⫺0.18 ⫺0.08 ⫺0.02 ⫺0.04
GTC 0.24⫹ 0.12 0.11 0.18 0.09 0.09 0.03 0.00 0.02
GTG 0.62⫹⫹ 0.26⫹ 0.30⫹⫹ 0.51⫹⫹ 0.24⫹ 0.26⫹ 0.15 0.01 0.09
GTT ⫺0.50 ⫺0.21 ⫺0.23 ⫺0.38 ⫺0.17 ⫺0.17 ⫺0.10 0.01 ⫺0.06
Arg AGA ⫺1.00 ⫺0.29 ⫺0.31 ⫺0.84 ⫺0.26 ⫺0.28 ⫺0.33 ⫺0.07 ⫺0.11
AGG ⫺0.22 ⫺0.07 ⫺0.07 ⫺0.18 ⫺0.05 ⫺0.10 ⫺0.16 0.01 ⫺0.11
CGA ⫺0.17 ⫺0.06 ⫺0.05 ⫺0.13 ⫺0.05 ⫺0.02 ⫺0.04 ⫺0.02 ⫺0.02
CGC 0.75⫹⫹ 0.21⫹ 0.24⫹ 0.66⫹⫹ 0.23⫹ 0.25⫹ 0.27⫹ 0.05 0.13
CGG 0.67⫹⫹ 0.21⫹ 0.20⫹ 0.47⫹⫹ 0.18 0.13 0.18 0.01 0.10
CGT ⫺0.03 0.00 ⫺0.01 0.03 0.02 0.03 0.08 0.02 0.00
Leu TTA ⫺0.51 ⫺0.14 ⫺0.16 ⫺0.44 ⫺0.14 ⫺0.15 ⫺0.16 ⫺0.05 ⫺0.04
TTG ⫺0.33 ⫺0.11 ⫺0.11 ⫺0.25 ⫺0.08 ⫺0.11 ⫺0.03 0.01 ⫺0.03
CTA ⫺0.19 ⫺0.06 ⫺0.05 ⫺0.20 ⫺0.07 ⫺0.05 ⫺0.08 ⫺0.02 ⫺0.03
CTC 0.34⫹⫹ 0.09 0.09 0.28⫹ 0.08 0.09 0.06 ⫺0.01 0.01
CTG 1.16⫹⫹ 0.34⫹⫹ 0.36⫹⫹ 0.96⫹⫹ 0.31⫹⫹ 0.35⫹⫹ 0.31⫹⫹ 0.04 0.13
CTT ⫺0.46 ⫺0.12 ⫺0.13 ⫺0.35 ⫺0.10 ⫺0.12 ⫺0.09 0.02 ⫺0.05
Ser AGC 0.50⫹⫹ 0.15 0.14 0.43⫹⫹ 0.13 0.15 0.04 ⫺0.01 0.05
AGT ⫺0.37 ⫺0.13 ⫺0.11 ⫺0.34 ⫺0.11 ⫺0.11 ⫺0.12 0.00 ⫺0.06
TCA ⫺0.38 ⫺0.08 ⫺0.13 ⫺0.36 ⫺0.09 ⫺0.14 ⫺0.10 ⫺0.03 ⫺0.04
TCC 0.44⫹⫹ 0.14 0.14 0.41⫹⫹ 0.13 0.15 0.17 0.03 0.08
TCG 0.11 0.03 0.03 0.11 0.03 0.04 0.06 0.01 0.01
TCT ⫺0.30 ⫺0.10 ⫺0.08 ⫺0.25 ⫺0.08 ⫺0.10 ⫺0.05 0.00 ⫺0.04
aOptimal codons (in underlined italic) defined by a positive⌬RSCU (⬎0.2) in both GC-rich and GC-poor isochores in tissues
Figure2.—Relationship between the level of expression in the liver and the ratio of GC-ending optimal to GC-ending
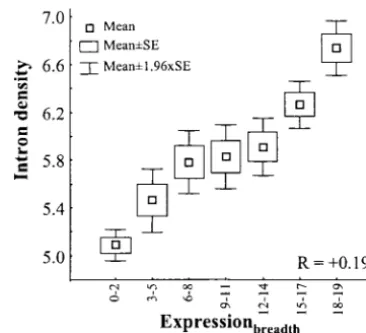
Figure3.—Relationship between gene expression (Expres-nonoptimal codons in a gene. Genes are divided according
sionbreadth) and intron density (number of introns per kilobase
to their level of transcription into five classes with equivalent
of CDS) in human genes.Ris measured using all genes inde-sample size, from lowest (L-1) to highest (L-5) level. Only
pendently. four- and sixfold degenerate amino acids were used (see text).
Spearman’s rank correlation (R) is measured using all genes independently.
set with an average CDS length of 983 bp, and observed again a negative relationship between expression and case in humans, with a negative relationship between
CDS length, for both Expressionbreadthand Expressionlevel
Fop and CDS length (R ⫽ ⫺0.076, P ⬍ 1 ⫻ 10⫺12),
in all tissues (P⬍3⫻10⫺10). This latter result indicates
although this is not unexpected because both
parame-that the observed distinct behavior of genes with and
ters exhibit a significant association with Expressionlevel, without introns is not attributable to differences in CDS
positive and negative (see below), respectively. More
length. informative are multivariate analyses showing that Fop
Gene expression and intron density:Several cellular decreases with CDS length after taking into account
processes associated with intron presence and size might
Expressionlevel in the different tissues: B ranges from
influence the final amount of mRNA correctly
tran-⫺0.067 (P⫽ 6⫻ 10⫺4) to⫺0.135 (P ⬍1⫻10⫺12).
scribed, spliced, and exported to the cytoplasm. In this
regard, various selective models (seediscussion)
fore-Gene expression, CDS length, and intron presence cast an association of levels of gene expression with differences in intron presence and size among genes. Gene expression and CDS length:There is a negative
Predictably, intron number increases with the length relationship between expression and the length of the
of CDS (R ⫽ ⫹0.665, P ⬍ 1 ⫻ 10⫺12). Therefore, to
CDS. This effect is detected using Expressionbreadth(R⫽
investigate the influence of expression on intron
pres-⫺0.088,P ⫽1.4 ⫻ 10⫺10) and Expression
level in any of
ence and because of the aforementioned association
the 19 tissues investigated (Rranges between⫺0.118 and
between expression and CDS length, we have studied
⫺0.204, P ⬍ 1 ⫻ 10⫺12 in all cases). Equivalent results
measures of intron presence relative to the size of the based on pooled SAGE data have been recently reported
CDS (i.e., intron density; number of introns per kilobase
(UrrutiaandHurst2003), and this study broadens the
of CDS). Intron density increases with any measure of validity of this relationship in humans.
expression: Expressionbreadth (R ⫽ ⫹0.194, P ⬍ 1 ⫻
Significantly, the negative correlation between
ex-10⫺12) and Expression
level in all tissues (R ranging
be-pression and CDS length is observed only among genes
tween ⫹0.114 and⫹0.204;P ⬍1⫻ 10⫺12in all cases;
with introns (R ⫽ ⫺0.111 for Expressionbreadth and R
Figure 3). The same results are obtained when multiple
between⫺0.124 and⫺0.211 for Expressionlevel,P⬍1⫻
regression analyses that account for variation in CDS
10⫺12 in all cases). In contrast, there is no detectable
length are performed:B⫽ ⫹0.185 (P⬍1⫻10⫺12) for
correlation among genes without introns using either
Expressionbreadth andBranges from⫹0.034 (P ⫽0.01)
Expressionbreadthor Expressionlevel(all associations are
sta-to ⫹0.107 (P ⬍ 1 ⫻ 10⫺12) for Expression
level. These
tistically nonsignificant after sequential Bonferroni
cor-results are not caused simply by intron-less genes being rection). Nevertheless, genes without introns are usually
narrowly/lowly expressed because the same trend is ob-shorter (average 984 bp) than genes with introns
(aver-tained when only genes with introns are analyzed:R⫽
age 1505 bp) and one could argue that the relationship
⫹0.177 andR⬎ ⫹0.102 (P ⬍ 1⫻ 10⫺12in all cases),
between expression and CDS length is detected only
for Expressionbreadth and Expressionlevel, respectively.
among genes with intermediate/long CDS. We have
Figure5.—Intron size along (from proximal to terminal
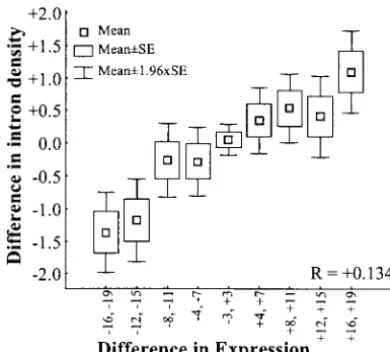
Figure 4.—Comparison of gene expression (Expres- position) human genes. Comparison between ubiquitously sionbreadth) and intron density (number of introns per kilobase (Expressionbreadth⬎14 tissues; 1497 genes) and narrowly
(Ex-of CDS) between physically adjacent genes. When comparing pression
breadth⬍3 tissues; 1732 genes) expressed genes.
two adjacent genes, difference indicates Expressionbreadth(or
intron density) of the second gene minus that of the first gene in the order present in the genomic sequences.Ris measured
using all independent comparisons. tissues shows a higher density of introns (2377 gene
pairs,R⫽ ⫹0.134,P⬍1⫻10⫺12).
Possible influence of intron position along genes: In
hu-mans, as in most eukaryotes, first introns (i.e., introns
have higher intron density is somewhat unexpected
un-closer to the start codon) tend to be longer than other der the hypothesis that highly expressed genes tend to
introns. Indeed, there is a reduction in intron size with
reduce transcriptional costs (time and energy;
Cas-respect to their position along a gene (from 5⬘ to 3⬘;
tillo-Daviset al.2002). This hypothesis was proposed
R⫽ ⫺0.161,P⬍1⫻10⫺12). Note that there is a gradual
on the basis of a negative relationship between
expres-decay in intron length from proximal to terminal posi-sion levels and intron size pooling EST data and among
tions along a CDS and this is observed in both
ubiqui-genes expressed in brain (Castillo-Daviset al.2002)
tously and narrowly expressed genes (R⫽ ⫺0.146 and
or using SAGE data (UrrutiaandHurst2003). Our
R⫽ ⫺0.172, respectively;P⬍1⫻10⫺12in both cases).
analyses also show this same trend, with a negative
associ-Therefore, intron size and intron number are not inde-ation between expression and average intron size using
pendent parameters and we have investigated the influ-Expressionbreadth(R⫽ ⫺0.075,P⫽1⫻10⫺7) and
Expres-ence of expression on intron size taking into account sionlevel in all 19 tissues, with R ranging from ⫺0.038
intron position. We confirmed the general trend of
(P ⫽ 0.008) to ⫺0.248 (P ⬍ 1 ⫻ 10⫺12). Altogether,
ubiquitously expressed genes having shorter introns these results suggest that the reduction in intron size
than narrowly expressed genes and report that this ten-may well be the result of selection to reduce
transcrip-dency is observed at any given intron position (Figure tional costs but also that other factors might operate
5). Further, the relative difference in intron size is least favoring an increase in intron density in highly/broadly
obvious for the first intron (a reduction ofⵑ17%)
com-expressed genes even though this will increase transcript
pared to any other intron where the reduction is close to length.
30%, hence supporting the perception that first introns
Possible influence of isochores:We considered the
possi-contain a larger number of regulatory elements for tran-ble coincidental basis to our previous results because
scription control (MajewskiandOtt2002).
both transcription patterns and gene structures differ
among isochores (Mouchiroudet al.1991;Duretet al.
1995;Zoubaket al.1996;Landeret al.2001;D’Onofrio
DISCUSSION
2002). We compared patterns of expression and intron
density between physically adjacent genes, both with We have used two measures of gene expression based
on microarray data: the number of tissues in which a expression data, hence removing background
tenden-cies even under a restrictive definition of isochore (Nek- gene is transcribed (breadth of expression) and the
level of transcription within tissues. This design has
al-rutenkoandLi2000). This analysis is possible only by
using Expressionbreadth because too few adjacent genes lowed us to investigate the different behavior of both
measures and, more importantly, to query for differ-show expression data in the same tissue. As differ-shown in
Figure 4, when two adjacent genes differ in breadth of ences among tissues, a required feature if we wanted to
expected to be tissue specific. The results shown here evolution of amino acid composition and tRNA abun-dance in the human lineage is driven by selection to indicate that the mutational/selective tendencies
associ-ated with both measures of expression (Expressionbreadth minimize amino acid misincorporation during
transla-tion and not to reduce translatransla-tional costs.
and Expressionlevel) should not be presumed to be alike;
we show comparable outcomes when studying CDS size Selection and mutational biases on synonymous
com-position: The observed difference in GC content be-and intron presence be-and size be-and show opposite
tenden-cies for gene composition. tween synonymous sites and introns (seeresults) can
be explained under a nonselective scenario by arguing This study also illustrates that results based on SAGE
or EST data are equivalent to those based on gene chips that transposable elements (TEs), which have a reduced
GC content (Duret et al. 1995), represent a frequent
when investigating intron features but very different,
even conflicting, when investigating base composition. component of many introns. The difference between
synonymous sites and introns then might just reflect the The incongruence between methods is likely caused by
the known bias in the quantitative aspect (i.e., Expres- recent insertion of TEs in introns, especially in genes
with long introns (DuretandHurst2001). In partial
sionlevel) of the SAGE and EST methods relative to GC
content (Margulieset al.2001;Duret 2002). On the agreement with this proposal, there is a strong tendency
for long introns to have reduced GC content (R ⫽
other hand, qualitative studies (i.e., Expressionbreadthsince
it is based on presence/absence) are expected to be com- ⫺0.507,P⬍1⫻10⫺12). Nevertheless, our analyses
indi-cate that highly transcribed genes show the strongest parable between SAGE/EST and microarray data, as
ob-served. Another noteworthy difference between this and compositional difference between synonymous sites and
introns while, at the same time, have shorter introns previous studies is that we have used only genes that have
not yet shown evidence of multiple-splicing forms. The and a reduced number of TEs in introns (Castillo
-Daviset al.2002). This would argue against the possibil-use of genes with multiple-splicing forms would introduce
a certain degree of ambiguity when composition is investi- ity that the positive association between expression and
compositional difference between synonymous sites and gated because constitutive and facultative exons differ in
synonymous GC content (IidaandAkashi 2000). introns is a consequence of TE presence.
In addition to a strong effect of isochores, we have Certainly, the major determinants of various gene
features in mammals are the isochore in which they are also detected the influence of transcription-associated
mutational biases evidenced by compositional strand located and the functional properties of the encoded
proteins. In accordance, in this study we show associa- bias in introns. Although TAMB is expected to be
appar-ent only in genes expressed in germline cells (
Hana-tions that, although with great statistical significance,
explain individually only a small percentage of the over- walt 1994; Svejstrup 2002), recent analyses suggest
that some level of germline transcription may involve all variance in gene composition or intron features (2–
16% of the overall variance). a large fraction of human genes (Green et al. 2003;
Majewski2003). Here, we report that the influence of Gene expression and amino acid composition:
Selec-tion at the level of amino acid composiSelec-tion might favor expression on strand bias varies widely among tissues,
with genes expressed in testis showing the greatest in-reducing energetic costs of amino acid biosynthesis
(AkashiandGojobori2002) or act in association with fluence while genes expressed in tissues such as liver, spleen, heart, placenta, and kidney show no evidence the abundance of tRNAs for each amino acid, increasing
translation accuracy or reducing translation costs of proof- of TAMB. Genes expressed in tissues with significant
TAMB will be subject to conflicting mutational and
se-reading (time and energy). There is noa priorireason
to expect the fitness consequence of an amino acid lective pressures on synonymous composition beyond
the isochore effects. As a result, tissues showing TAMB misincorporation to be proportional to the degree of
expression of a protein (Bulmer1991). Conversely, the also reveal the least obvious influence of selection on
synonymous codon usage. Conversely, tissues showing fitness costs associated with amino acid biosynthesis and
proofreading will increase with expression. In the pro- little or no evidence of TAMB are those in which
selec-tion on synonymous composiselec-tion is better observed. karyotesEscherichia coliandBacillus subtilis, the usage of
less energetically costly amino acids increases in abun- Translational selection in humans:Overall, the results
shown here are evidence that selection on synonymous
dant proteins (Akashiand Gojobori2002). In C.
ele-gans (Duret 2000) and yeast (Akashi 2003), highly codons is operating at a detectable level in the human lineage. As predicted by population genetics theory, transcribed protein-coding genes show a stronger
correla-tion between amino acid composicorrela-tion and tRNA abun- however, the signature of translational selection is less
conspicuous in humans than in species with much larger dance than do poorly transcribed genes, supporting the
proposal that selection minimizes translational costs. In Ne. Indeed, genomic patterns of selection on
synony-mous codons are distinguished only after taking into humans, the overall amino acid composition of proteins
also matches tRNA abundance but there is no support account the strong influence of background composition
(isochores) and tissue-specific features such as TAMB. for different amino acid composition in differentially
selectively favored in highly expressed genes. All optimal playing a role in this relationship. Thus, the results indi-cate that the association between expression and CDS codons are GC ending and they resemble the set
pro-posed forD. melanogaster more closely than that forC. size should be investigated not only by selective models
based on total protein size (e.g., on costs of amino acid
elegansorA. thaliana(DuretandMouchiroud1999).
The comparison between optimal codons and gene copy biosynthesis) but also in conjunction with models based
on the evolutionary/metabolic consequences of exon numbers of isoaccepting tRNAs (expected to reflect
cel-lular tRNA abundance) shows a good, although not size and intron presence (see below).
Gene expression and intron presence and size: Previ-perfect, association, with 14 of the 17 optimal codons
being decoded by the most frequent isoaccepting tRNA ous reports showed that short introns are favored in
highly expressed genes and this study confirms this trend according to classical rules of codon-anticodon
interac-tions (Ikemura1985). In agreement with the proposal in a wide range of different tissues. Altogether, these
re-sults support the hypothesis of a measurable selective of translational selection, two amino acids (glycine and
proline) show a corresponding change in codon prefer- advantage for having small transcripts to reduce
tran-scriptional costs (time and energy;Castillo-Davis et
ence and tRNA abundance whenC. elegansand humans
are compared, generating in both species precise, al- al. 2002). Significantly, we show a counterbalancing
trend that is not caused by background tendencies, insti-though different, matches between optimal codons and
the most frequent isoaccepting tRNA. For instance, in gating broadly/highly expressed genes to have higher
intron density in the human lineage. One could argue the case of glycine, the optimal codon and the
antico-don of the most frequent tRNA inC. elegans are GGA that genes expressed in many tissues are more likely to
have more introns because they are more likely to be
and UCC, respectively (Duret 2000); in humans, the
optimal codon and the anticodon of the most frequent alternatively spliced, but these multiple-splicing forms
have not yet been detected. Nevertheless, the same tRNA are GGC and GCC, respectively. Certainly, the use
of optimal codons will increase our capability to explore trend is observed using Expressionlevelin specific tissues,
ruling out the possibility of a spurious relationship be-further consequences of translational selection at both
intra- and interspecific levels. Further, the exposure of tween intron density/number and, at least,
Expres-sionlevel.
translational selection in the human lineage is a factor
that should be introduced into evolutionary analyses that Selective causes favoring intron presence:A
heteroge-neous group of selective causes might associate intron often assume neutrality of all synonymous mutations.
Gene expression and CDS size:The negative relation- presence in protein-coding genes with levels of correct gene products. At this level, the advantage for having ship between expression and protein size reported in
S. cerevisiae(Akashi2003) andC. elegans (Jansenand higher intron density would be counterbalanced by a
minimum exon size required for proper splicing (Upholt
Gerstein 2000) has been explained by the selective
advantage of reducing energetic costs of amino acid bio- andSandell1986;DominskiandKole1991) and
re-strictions on transcription costs that are likely to be
synthesis in highly expressed genes (Akashiand
Gojo-bori2002;Akashi2003). On the other hand, the overall species specific, hence explaining differences among
species. excess of deletions over insertions described in many
eukaryotes, including mammals (Ogataet al.1996;Ophir A first possibility is that genes with a broader and/
or higher expression require an increased number of andGraur1997), and the possibility of
transcription-associated deletions could also generate a nonselective regulatory signals in different introns. We have applied
two indirect approaches to investigate the presence of association between transcription rates in germinal cells
and a reduction in protein size. Thus, in multicellular regulatory regions (see materials and methods for
details). Our survey of CpG islands reveals an equivalent organisms a negative relationship between expression
and protein size does not require a selective explanation presence in narrowly and ubiquitously expressed genes,
with an average of 1.67 and 1.64 islands per gene, re-unless such a relationship is observed among genes not
transcribed in germinal cells. spectively, comparing genes with ⬎10 introns. In the
second approach, we applied BLASTn searches to iden-We have shown a negative association between
pro-tein size and Expressionbreadth. Because broadly expressed tify conserved segments of noncoding DNA as a proxy
for functionally important sequences (Hardisonet al.
genes are also more likely to be expressed in germinal
cells (DuretandMouchiroud2000), this observation 1997;Jareborget al.1999;Wassermanet al.2000;
Sha-balina et al. 2001). The comparison of human and alone would not rule out a mutational
(transcription-associated) cause. However, the same trend is also ob- mouse orthologous sequences reveals that the total
number of conserved sites in introns does not increase
served using Expressionlevel, including tissues with no
detectable mutational trends expected in germinal cells, with breadth of expression. On the contrary, narrowly
expressed genes have an average of 473 conserved sites hence supporting a selective explanation for the
associa-tion between expression and CDS size in the human in introns compared to 372 in ubiquitously expressed
genes (Mann-WhitneyU-test,P⫽0.020), with
percent-lineage. Interestingly, this trend is specific to genes with
-Akashi, H., 1996 Molecular evolution betweenDrosophila
melanogas-test, P⫽ 0.029). In all, these indirect analyses suggest
terandD. simulans: reduced codon bias, faster rates of amino
that differences in intron number are not likely a conse- acid substitution, and larger proteins inD. melanogaster. Genetics
144:1297–1307. quence of an increased number of regulatory signals
Akashi, H., 2003 Translational selection and yeast proteome evolu-distributed in different introns.
tion. Genetics164:1291–1303.
A second explanation for the observed association Akashi, H., andT. Gojobori, 2002 Metabolic efficiency and amino
acid composition in the proteomes ofEscherichia coliandBacillus
between gene expression and intron density might be
subtilis.Proc. Natl. Acad. Sci. USA99:3695–3700. related to the influence of introns on mRNA
metabo-Altschul, S. F., T. L. Madden, A. A. Schaffer, J. Zhang, Z. Zhang
lism (SunandMaquat2000;Zhouet al.2000;Le Hir et al., 1997 Gapped BLAST and PSI-BLAST: a new generation
of protein database search programs. Nucleic Acids Res.25:3389– et al.2001;Yuet al.2002) and splicing efficiency (Klinz
3402. andGallwitz1985;Sterneret al.1996). The so-called
Begun, D. J., 2001 The frequency distribution of nucleotide
varia-exon-exon junction complexes (EJC) are deposited up- tion in Drosophila simulans. Mol. Biol. Evol.18:1343–1352.
Bernardi, G., 1995 The human genome: organization and
evolu-stream of intron positions after splicing (Kataokaet al.
tionary history. Annu. Rev. Genet.29:445–476.
2000; Le Hir et al. 2000, 2001) and there is evidence
Betancourt, A. J., andD. C. Presgraves, 2002 Linkage limits the
that EJC enhance export efficiency of spliced mRNAs power of natural selection in Drosophila. Proc. Natl. Acad. Sci.
USA99:13616–13620.
to the cytoplasm (Zhouet al.2000;Le Hiret al.2001).
Bulmer, M., 1991 The selection-mutation-drift theory of synony-Also, splicing factors might promote transcriptional
mous codon usage. Genetics129:897–907.
elongation (Fong and Zhou 2001). Therefore, selec- Carlini, D. B., andW. Stephan, 2003 In vivo introduction of
unpre-ferred synonymous codons into the Drosophila Adh gene results tion could be acting at the level of intron density to
in reduced levels of ADH protein. Genetics163:239–243. increase mRNA transport and/or transcriptional
elon-Carvalho, A. B., andA. G. Clark, 1999 Intron size and natural
gation, especially in highly expressed genes. selection. Nature401:344.
Castillo-Davis, C. I., S. L. Mekhedov, D. L. Hartl, E. V. Koonin
Another selective model for intron presence is
associ-andF. A. Kondrashov, 2002 Selection for short introns in ated with the deleterious consequences of linkage
be-highly expressed genes. Nat. Genet.31:415–418.
tween sites under selection, a phenomenon termed the Coghlan, A., andK. H. Wolfe, 2000 Relationship of codon bias
to mRNA concentration and protein length inSaccharomyces
cere-Hill-Robertson effect (Hill and Robertson 1966;
visiae.Yeast16:1131–1145.
Felsenstein1974; see alsoLi 1987;Kliman andHey
Comeron, J. M., andM. Aguade, 1998 An evaluation of measures
1993;Comeronet al.1999;McVeanandCharlesworth of synonymous codon usage bias. J. Mol. Evol.47:268–274.
Comeron, J. M., andM. Kreitman, 2000 The correlation between
2000;Tachida2000;BetancourtandPresgraves2002;
intron length and recombination in Drosophila: dynamic
equilib-ComeronandKreitman2002;HeyandKliman2002).
rium between mutational and selective forces. Genetics 156:
Specifically,ComeronandKreitman(2000, 2002) have 1175–1190.
Comeron, J. M., andM. Kreitman, 2002 Population, evolutionary proposed that the Hill-Robertson effect might be
detect-and genomic consequences of interference selection. Genetics able at an intragenic level in many eukaryotes due to
161:389–410.
the prevalence of mutations under weak selection in Comeron, J. M., M. KreitmanandM. Aguade, 1999 Natural
selec-tion on synonymous sites is correlated with gene length and coding regions. Under this model, introns (generally
recombination in Drosophila. Genetics151:239–249. with a reduced frequency of sites under selection
com-Dominski, Z., and R. Kole, 1991 Selection of splice sites in
pre-pared to exons) will reduce the Hill-Robertson effect at mRNAs with short internal exons. Mol. Cell. Biol.11:6075–6083.
the intragenic level,i.e., intron-containing genes would D’Onofrio, G., 2002 Expression patterns and gene distribution in
the human genome. Gene300:155–160. exhibit increased effectiveness of selection. Then, all
Duan, J., M. S. Wainwright, J. M. Comeron, N. Saitou, A. R.
Sand-else being equal, highly expressed genes would benefit erset al., 2003 Synonymous mutations in the human dopamine
from high intron density to maximize the consequences receptor D2 (DRD2) affect mRNA stability and synthesis of the
receptor. Hum. Mol. Genet.12:205–216. of selection on amino acid and synonymous
composi-Duret, L., 2000 tRNA gene number and codon usage in theC.
tion. A fraction of replacement (amino acid changing) elegansgenome are co-adapted for optimal translation of highly
mutations in many species are likely under weak selec- expressed genes. Trends Genet.16:287–289.
Duret, L., 2002 Evolution of synonymous codon usage in metazo-tion and our report of selecmetazo-tion on synonymous
muta-ans. Curr. Opin. Genet. Dev.12:640–649. tions increases the likelihood of detectable
Hill-Robert-Duret, L., andL. D. Hurst, 2001 The elevated GC content at
son effect within genes in the human lineage, particularly exonic third sites is not evidence against neutralist models of
isochore evolution. Mol. Biol. Evol.18:757–762. in highly expressed genes. Upcoming large-scale
popula-Duret, L., andD. Mouchiroud, 1999 Expression pattern and, sur-tion genetics analyses based on polymorphism and
diver-prisingly, gene length shape codon usage in Caenorhabditis,
Dro-gence data will allow testing of these possibilities. sophila, and Arabidopsis. Proc. Natl. Acad. Sci. USA96:4482–
4487. I thank A. Llopart for fruitful discussions and many comments on
Duret, L., andD. Mouchiroud, 2000 Determinants of substitution the manuscript. C. Castillo-Davis, J. Hey, and S. Schaeffer provided
rates in mammalian genes: expression pattern affects selection useful suggestions to improve this manuscript. This research was partly
intensity but not mutation rate. Mol. Biol. Evol.17:68–74. funded by The Old Gold Summer Fellowship Program (University of Duret, L., D. MouchiroudandC. Gautier, 1995 Statistical analysis
Iowa). of vertebrate sequences reveals that long genes are scarce in
GC-rich isochores. J. Mol. Evol.40:308–317.
Duret, L., M. Semon, G. Piganeau, D. MouchiroudandN. Galtier, 2002 Vanishing GC-rich isochores in mammalian genomes.
Ge-LITERATURE CITED
netics162:1837–1847.
Edgar, R., M. DomrachevandA. E. Lash, 2002 Gene Expression
Akashi, H., 1995 Inferring weak selection from patterns of
polymor-Omnibus: NCBI gene expression and hybridization array data phism and divergence at “silent” sites in Drosophila DNA.
Eyre-Walker, A., 1999 Evidence of selection on silent site base sophila driven by positive Darwinian selection. Proc. Natl. Acad. Sci. USA99:8121–8126.
composition in mammals: potential implications for the evolution
of isochores and junk DNA. Genetics152:675–683. Lynch, M., 2002 Intron evolution as a population-genetic process. Proc. Natl. Acad. Sci. USA99:6118–6123.
Felsenstein, J., 1974 The evolutionary advantage of recombination.
Genetics78:737–756. Majewski, J., 2003 Dependence of mutational asymmetry on
gene-expression levels in the human genome. Am. J. Hum. Genet.73:
Fong, Y. W., andQ. Zhou, 2001 Stimulatory effect of splicing factors
on transcriptional elongation. Nature414:929–933. 688–692.
Majewski, J., andJ. Ott, 2002 Distribution and characterization of
Galtier, N., 2003 Gene conversion drives GC content evolution in
mammalian histones. Trends Genet.19:65–68. regulatory elements in the human genome. Genome Res. 12:
1827–1836.
Green, P., B. Ewing, W. Miller, P. J. ThomasandE. D. Green, 2003
Transcription-associated mutational asymmetry in mammalian Margulies, E. H., S. L. KardiaandJ. W. Innis, 2001 Identification and prevention of a GC content bias in SAGE libraries. Nucleic evolution. Nat. Genet.33:514–517.
Hanawalt, P. C., 1994 Transcription-coupled repair and human Acids Res.29:E60.
McVean, G. A., andB. Charlesworth, 2000 The effects of Hill-disease. Science266:1957–1958.
Hardison, R. C., J. OeltjenandW. Miller, 1997 Long human- Robertson interference between weakly selected mutations on patterns of molecular evolution and variation. Genetics155:929– mouse sequence alignments reveal novel regulatory elements: a
reason to sequence the mouse genome. Genome Res.7:959–966. 944.
McVean, G. A., andJ. Vieira, 2001 Inferring parameters of
muta-Hartl, D. L., E. N. MoriyamaandS. A. Sawyer, 1994 Selection
intensity for codon bias. Genetics138:227–234. tion, selection and demography from patterns of synonymous site evolution in Drosophila. Genetics157:245–257.
Hey, J., andR. M. Kliman, 2002 Interactions between natural
selec-tion, recombination and gene density in the genes of Drosophila. Moriyama, E. N., andD. L. Hartl, 1993 Codon usage bias and base composition of nuclear genes in Drosophila. Genetics134:
Genetics160:595–608.
Hill, W. G., andA. Robertson, 1966 The effect of linkage on limits 847–858.
Moriyama, E. N., andJ. R. Powell, 1997 Codon usage bias and to artificial selection. Genet. Res.8:269–294.
Iida, K., andH. Akashi, 2000 A test of translational selection at tRNA abundance in Drosophila. J. Mol. Evol.45:514–523.
Moriyama, E. N., andJ. R. Powell, 1998 Gene length and codon ‘silent’ sites in the human genome: base composition
compari-sons in alternatively spliced genes. Gene261:93–105. usage bias inDrosophila melanogaster, Saccharomyces cerevisiaeand
Escherichia coli.Nucleic Acids Res.26:3188–3193.
Ikemura, T., 1985 Codon usage and tRNA content in unicellular
and multicellular organisms. Mol. Biol. Evol.2:13–34. Mouchiroud, D., G. D’Onofrio, B. Aissani, G. Macaya, C. Gautier
et al., 1991 The distribution of genes in the human genome.
Jansen, R., and M. Gerstein, 2000 Analysis of the yeast
tran-scriptome with structural and functional categories: characteriz- Gene100:181–187.
Nekrutenko, A., andW. H. Li, 2000 Assessment of compositional ing highly expressed proteins. Nucleic Acids Res.28:1481–1488.
Jareborg, N., E. BirneyandR. Durbin, 1999 Comparative analysis heterogeneity within and between eukaryotic genomes. Genome Res.10:1986–1995.
of noncoding regions of 77 orthologous mouse and human gene
pairs. Genome Res.9:815–824. Ogata, H., W. FujibuchiandM. Kanehisa, 1996 The size
differ-ences among mammalian introns are due to the accumulation
Kataoka, N., J. Yong, V. N. Kim, F. Velazquez, R. A. Perkinsonet
al., 2000 Pre-mRNA splicing imprints mRNA in the nucleus of small deletions. FEBS Lett.390:99–103.
Ophir, R., andD. Graur, 1997 Patterns and rates of indel evolution with a novel RNA-binding protein that persists in the cytoplasm.
Mol. Cell6:673–682. in processed pseudogenes from humans and murids. Gene205:
191–202.
Kliman, R. M., andJ. Hey, 1993 Reduced natural selection
associ-ated with low recombination inDrosophila melanogaster.Mol. Biol. Parsch, J., 2003 Selective constraints on intron evolution in Dro-sophila. Genetics165:1843–1851.
Evol.10:1239–1258.
Klinz, F. J., andD. Gallwitz, 1985 Size and position of intervening Percudani, R., A. PavesiandS. Ottonello, 1997 Transfer RNA gene redundancy and translational selection inSaccharomyces
cere-sequences are critical for the splicing efficiency of pre-mRNA
in the yeast Saccharomyces cerevisiae. Nucleic Acids Res. 13: visiae.J. Mol. Biol.268:322–330.
Powell, J. R., andE. N. Moriyama, 1997 Evolution of codon usage 3791–3804.
Kurland, C., 1992 Translational accuracy and the fitness of bacteria. bias in Drosophila. Proc. Natl. Acad. Sci. USA94:7784–7790.
Rice, W. R., 1989 Analyzing tables of statistical tests. Evolution43:
Annu. Rev. Genet.26:29–50.
Lander, E. S., L. M. Linton, B. Birren, C. Nusbaum, M. C. Zodyet 223–225.
Schaeffer, S. W., 2002 Molecular population genetics of sequence
al., 2001 Initial sequencing and analysis of the human genome.
Nature409:860–921. length diversity in the Adh region of Drosophila pseudoobscura.
Genet. Res.80:163–175.
Le Hir, H., M. J. MooreandL. E. Maquat, 2000 Pre-mRNA splicing
alters mRNP composition: evidence for stable association of pro- Shabalina, S. A., A. Y. Ogurtsov, V. A. Kondrashovand A. S. Kondrashov, 2001 Selective constraint in intergenic regions teins at exon-exon junctions. Genes Dev.14:1098–1108.
Le Hir, H., D. Gatfield, E. IzaurraldeandM. J. Moore, 2001 The of human and mouse genomes. Trends Genet.17:373–376.
Sharp, P. M., andW. H. Li, 1986 An evolutionary perspective on exon-exon junction complex provides a binding platform for
factors involved in mRNA export and nonsense-mediated mRNA synonymous codon usage in unicellular organisms. J. Mol. Evol.
24:28–38. decay. EMBO J.20:4987–4997.
Leicht, B. G., S. V. Muse, M. HanczycandA. G. Clark, 1995 Con- Sharp, P. M., andW. H. Li, 1987 The codon Adaptation Index—a measure of directional synonymous codon usage bias, and its straints on intron evolution in the gene encoding the myosin
alkali light chain in Drosophila. Genetics139:299–308. potential applications. Nucleic Acids Res.15:1281–1295.
Shen, L. X., J. P. BasilionandV. P. Stanton, Jr., 1999
Single-Lercher, M. J., A. O. UrrutiaandL. D. Hurst, 2002 Clustering
of housekeeping genes provides a unified model of gene order nucleotide polymorphisms can cause different structural folds of mRNA. Proc. Natl. Acad. Sci. USA96:7871–7876.
in the human genome. Nat. Genet.31:180–183.
Lercher, M. J., A. O. Urrutia, A. PavlicekandL. D. Hurst, 2003 Shields, D., P. Sharp, D. HigginsandF. Wright, 1988 “Silent” sites in Drosophila genes are not neutral: evidence of selection A unification of mosaic structures in the human genome. Hum.
Mol. Genet.12:2411–2415. among synonymous codons. Mol. Biol. Evol.5:704–716.
Stephan, W., V. S. Rodriguez, B. ZhouandJ. Parsch, 1994
Molecu-Li, W. H., 1987 Models of nearly neutral mutations with particular
implications for nonrandom usage of synonymous codons. J. Mol. lar evolution of the metallothionein gene Mtn in themelanogaster
species group: results fromDrosophila ananassae. Genetics138:
Evol.24:337–345.
Li, W. H., andL. A. Sadler, 1991 Low nucleotide diversity in man. 135–143.
Sterner, D. A., T. CarloandS. M. Berget, 1996 Architectural Genetics129:513–523.
Llopart, A., andM. Aguade, 2000 Nucleotide polymorphism at limits on split genes. Proc. Natl. Acad. Sci. USA93:15081–15085.
Su, A. I., M. P. Cooke, K. A. Ching, Y. Hakak, J. R. Walkeret al., the RpII215 gene in Drosophila subobscura. Weak selection on
synonymous mutations. Genetics155:1245–1252. 2002 Large-scale analysis of the human and mouse tran-scriptomes. Proc. Natl. Acad. Sci. USA99:4465–4470.
Llopart, A., J. M. Comeron, F. G. Brunet, D. LachaiseandM.
impli-cations for genome evolution. Curr. Opin. Genet. Dev.5:786– mediated by expression on human genes. Genome Res.13:2260– 2264.
791.
Sun, X., andL. E. Maquat, 2000 mRNA surveillance in mammalian Wall, J. D., 2003 Estimating ancestral population sizes and diver-gence times. Genetics163:395–404.
cells: the relationship between introns and translation
termina-tion. RNA6:1–8. Wasserman, W. W., M. Palumbo, W. Thompson, J. W. Fickettand
C. E. Lawrence, 2000 Human-mouse genome comparisons to
Svejstrup, J. Q., 2002 Mechanisms of transcription-coupled DNA
repair. Nat. Rev. Mol. Cell. Biol.3:21–29. locate regulatory sites. Nat. Genet.26:225–228.
Tachida, H., 2000 Molecular evolution in a multisite nearly neutral Wright, F., 1990 The ‘effective number of codons’ used in a gene.
mutation model. J. Mol. Evol.50:69–81. Gene87:23–29.
Upholt, W. B., andL. J. Sandell, 1986 Exon/intron organization Yu, J., Z. Yang, M. Kibukawa, M. Paddock, D. A. Passeyet al., 2002 of the chicken type II procollagen gene: intron size distribution Minimal introns are not “junk.” Genome Res.12:1185–1189. suggests a minimal intron size. Proc. Natl. Acad. Sci. USA83: Zhou, Z., M. J. Luo, K. Straesser, J. Katahira, E. Hurtet al., 2000
2325–2329. The protein Aly links pre-messenger-RNA splicing to nuclear
Urrutia, A. O., andL. D. Hurst, 2001 Codon usage bias covaries export in metazoans. Nature407:401–405.
with expression breadth and the rate of synonymous evolution Zoubak, S., O. ClayandG. Bernardi, 1996 The gene distribution in humans, but this is not evidence for selection. Genetics159: of the human genome. Gene174:95–102.
1191–1199.