R E G U L A R P A P E R
Query quality refinement in singular value decomposition
to improve genetic algorithms for multimedia data retrieval
Wilson Cheruiyot• Guan-Zheng Tan•
Felix Musau• Joseph Cosmas Mushi
Received: 9 March 2010 / Accepted: 16 March 2011 / Published online: 3 April 2011 ÓSpringer-Verlag 2011
Abstract With the development of internet and
availabil-ity of multimedia data capturing devices, the size of Multimedia Digital Database (MDD) collection is increasing rapidly. The complex data presented by such systems do not have the total ordering property presented by the traditional data handled by Database Management Sys-tems (DBMSs). The quality of the search experience in such systems is also normally a big challenge since users from various domains require efficient data searching, browsing and retrieval tools. This has triggered an important research topic in Multimedia information retrieval concerning effi-cient and effective image similarity search. Modern search algorithms are fast and effective on a wide range of prob-lems, but on MDD with a large number of parameters and observations, manipulations of large matrices, storage and retrieval of large amounts of information may render an otherwise useful method slow or inoperable. The focus of this work is the application of image enhancement technique, using histogram equalization, to the images retrieved using
singular value decomposition (SVD). SVD is a linear algebra technique used for discovering correlations within data. The approach, herein referred to as query quality refinement (QQR) technique, improves the image similarity search result, and when incorporated with genetic algorithms fur-ther optimizes the search. These beneficial applications can be extended to other different types of multimedia data in various areas such as the P2P and WiMAX networks.
Keywords Multimedia Digital DatabaseSingular value
decomposition Genetic algorithmsMultimedia information retrievalQuery quality refinement
1 Introduction
The development of Database Management Systems (DBMS) was guided by the principle of retrieving the exact answer for every query posed over the database. Getting the exact answer is a fundamental requirement for the traditional applications of DBMS, based mainly on num-bers and small character strings. However, new DBMS are being increasingly required to support more complex data types such as images, videos, audio, time series and DNA sequences, among others [1]. This type of data manage-ment systems approach has given rise to Multimedia Dig-ital Databases (MDD). MDD are currently prevalent in many scientific applications ranging from entertainment, magnetic resonance, imaging to learning management systems. The information in such databases is supposed to be practically accessible to everyone who wishes to use it for varied applications. Images are one form of data found in MDD. Image collection is semi-structured, non-homo-geneous, and massive in volume, and is usually stored in large disk arrays. Efficient image searching, browsing and Communicated by Balakrishnan Prabhakaran.
F. Musau
Trusted Computing Institute,
Central South University, Changsha 410083, People’s Republic of China
e-mail: [email protected]
W. Cheruiyot (&)G.-Z. TanJ. C. Mushi School of Information Science and Engineering, Central South University, Changsha 410083, People’s Republic of China
e-mail: [email protected]
G.-Z. Tan
e-mail: [email protected]
J. C. Mushi
retrieval tools are required for such databases by users from various domains, including remote sensing, fashion, crime prevention, publishing, medicine, architecture, etc. [2]. Though modern search algorithms are fast and effective on a wide range of problems, on MDD with normally large number of parameters and a large number of observations, the search might not be as effective. MDD requires manipulations of large matrices, storage requirements and retrieval of large amounts of information, which may render an otherwise useful method slow or inoperable. The objects in the multimedia domain are treated as objects in a metric space, which can be compared with a metric func-tion appropriately defined. The search technique in this case is then an optimization problem for finding closest points of the features in the metric spaces. These closest points between a query vector and retrieved image gives rise to similarity data retrieval. Similarity search tech-niques in the large sets of complex MDD depend on good search algorithms and indexing structures. The problem is, given a setS of points in a metric space M and a query pointq [M, find the closest point inStoq. In many cases, M is taken to be d-dimensional Euclidean space and dis-tance is measured by Euclidean disdis-tance or Manhattan distance. A wide range of methods that have been proposed for the similarity search in MDD are often based on tech-niques largely foreign to the IR field, with most common ones being those that transforms image features into dis-crete elements or terms. These data transformations per-formed by the feature extraction algorithms correspond to a dimensionality reduction, which leads to lose of details and imposes errors in the process, reducing the worthiness to execute exact answer algorithms when dealing with com-plex data [1]. To circumvent this difficulty, similarity search using singular value decomposition (SVD) is used in our work for retrieval process and to provide users with the desired objects if the underlying similarity model reflects their sense of similarity. SVD is a linear algebra decom-position technique applied for calculating singular values, pseudo-inverse and rank of a matrix. It has been shown experimentally and probabilistically that SVD should be able to expose the most striking similarities between a given vector and another set of vectors [2]. To further refine the query results obtained from the SVD similarity search, an enhancement technique using histogram equal-ization (HE) is applied. Finally, genetic algorithms (GAs) are applied. Genetic algorithms allows for the performance of elegant and robust searches and optimization, which are specially useful for finding answers in complex or poorly understood search spaces.
Many researches have been done, using GA, to address the issue of effectively refining and improving image similarity search results. Despite the successes, little use has been made to enhance the retrieved image results from
the various similarity search techniques and then used in GA query optimization. Jacob G. Martin and Khaled Rasheed, in [2] investigated the impact of the SVD on GAs, by exposing the most striking similarities between a given individual and a strategically chosen population of individuals. Enhancement techniques were, however, not applied to the retrieved image.
This work presents a new technique of enhancing retrieved image results from an SVD similarity search by HE enhancement process. These similarities are then used to influence the direction of the GA’s search process by qualifying candidate individuals for reinsertion into the next generation based on their proximity to other individ-uals, whose fitness have already been computed [2].
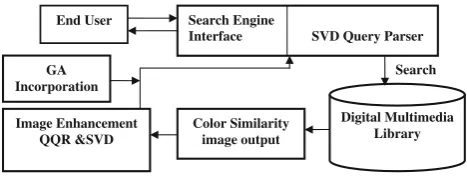
The framework of our proposed MIR system is as shown in Fig.1. A user submits an image-based query to the system. The system may avail a set of sample images to choose from or can ask from a user a text description of the required image. It then searches for similar matches in the document database and retrieves similar image results corresponding to those queries. The user evaluates the results based on the relevance [3]. To refine the search, the retrieved image results are HE enhanced, and finally GAs are applied to optimize the information retrieval efficiency. The similarity between the query and retrieved docu-ments is measured by different retrieval strategies that are based on the more frequent terms found in both the doc-ument and the query. The more relevant docdoc-ument is deemed to be the feedback to the query request. The retrieval effectiveness of the system is measured using two experiments based on: Euclidean distance content simi-larity measure and precision and recall, which measure, respectively, the percentage of the retrieved documents that are relevant, and the percentage of the relevant documents that are retrieved [3].
The remainder of this paper is structured as follows: Sect. 2 briefly introduces GAs and their application to image optimization retrieval. Section3 discusses the Multimedia information retrieval (MIR) Using SVD simi-larities search by colors while the image enhancement procedure QQR is mentioned in detail in Sect.4. Section5
looks at the QQR enhancement experimental results and in Sect.6, Image quality analysis is carried out to evaluate its
End User Search Engine
Interface SVD Query Parser
Color Similarity image output
Digital Multimedia Library Image Enhancement
QQR &SVD
Search GA
Incorporation
overall enhancement effect on the image. Section7 pre-sents the incorporation of QQR results into GA for the final purpose of image optimization retrieval. Section8presents some chosen GA retrieval experiments plus evaluation, and Sect.9 gives a conclusion of our proposal.
2 Genetic algorithms background
The growth in the number of documents in MIR has made it necessary to use the best knowledge or methods, espe-cially those of GAs, in retrieving the most similar and relevant documents to the user query. Genetic algorithms are search and optimization methods that mimic natural selection and biological evolution to solve optimization and decision problems [2].
According to Holland, 1975, GAs are search algorithms based on the mechanics of the natural selection process (biological evolution). The most basic concept is that the strong tend to adapt and survive while the weak tend to die out. The optimization process is based on evolution, and the ‘‘Survival of the fittest’’ concept. GAs have the ability to create an initial population of feasible solutions, and then recombine them in a way to guide their search to the most promising areas of the state space. Each feasible solution is encoded as a chromosome, also called a geno-type, and each chromosome is given a measure of fitness via a fitness (evaluation or objective) function. The chro-mosomes are either generated at random or, if one has some knowledge can be used to create part of the initial set of potential solutions. The fitness of a chromosome deter-mines its ability to survive and produce offsprings. GAs are being more and more employed to solve problems involving search and optimization operations, mainly due to the robustness and simplicity they offer [4]. The GA have been applied to various kinds of domains such as autonomous robotics, knowledge discovery, power sys-tem, bankruptcy predictions, and computational economics [5].
Genetic algorithms (GAs) are not new to information retrieval [6]. They have been used to allow for the per-formance of elegant and robust searches and optimization, which are specially useful for finding answers in complex or poorly understood search spaces. Boughanem et al. [7], Horng and Yeh [8], and Vrajitoru [9], examine GAs for information retrieval and they suggested new crossover and mutation operators. Vrajitoru [9] examined the effect of population size on learning ability, concluding that a large population size is important. In nature, the selective pres-sure is exerted by the ambient. In a computational context, it is simulated by the application of an objective function that evaluates each individual’s fitness. Usually, GAs have two problem-dependent components: how to encode the
solution space as chromosomes, and how to define the objective function [10].
3 Multimedia information retrieval and use of singular value decomposition
3.1 Decomposition for similarity retrieval
implies that multimedia objects cannot be meaningfully queried in the classical sense (exact search). Instead, the objects in the multimedia domain are treated as objects in a metric space, which can be compared with a metric function appropriately defined. A query in a multimedia database system usually requests the most similar objects to a given query object or a manually entered query specification. In response to this demand, a wide range of methods for MIR have been produced, often based on techniques largely foreign to the IR field. Some popular techniques transform image features into discrete elements or terms. These so-called ‘‘visual terms’’ are elegant because they enable image content to be described in much the same way as a text document. Techniques for creating visual terms from fea-tures almost always revolve around the idea of using linear algebra techniques to decompose the original image matrix into a set of reduced rank approximation that exposes the most striking similarities while preserving most of the rel-evant information. From the viewpoint of linear algebra, we can observe that a discrete MIR image that we are limiting our scope to is an array of non-negative scalar entries which may be regarded as a matrix. Let such an image be desig-nated as an image matrix X. Without the loss of generality, we assume in the subsequent discussions that X is a MIR square image.
Given a multimedia query object, the search for an exact match in a database requires the development of efficient and effective similarity search technique for the image matrixX. The technique described and applied in this paper for the retrieving similar operators for multimedia docu-ments makes use of a mathematical factorization called the SVD. Briefly, SVD is used to decompose an image matrix X into the product of three separate matrices.
3.2 The basic idea of singular value decomposition technique in MIR
Decomposition technique is an essential step for MIR data. The general criterion for decomposing the dimension is the desire to preserve most of the relevant information of the original MIR data according to some optimality criteria. SVD has been used in our work since it provided a method for decomposition and discovering correlations within the data. SVD is used to expose the most striking similarities between
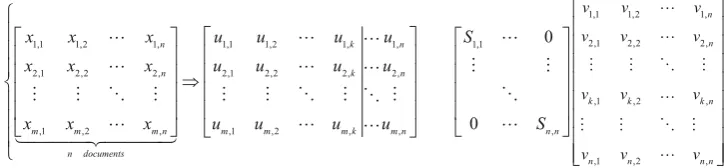
a given individual and a strategically chosen population of individuals [2]. It decomposes the large data matrix into a set ofkorthogonal factors. The less important dimensions cor-responding to ‘‘noise’’ due to word-choice variability are ignored. A reduced rank approximation to the original matrix is constructed by dropping these noisy dimensions [14]. In our proposal, SVD is used to deal with solving the difficult linear_least squares color problems terms in documents case. The first task is to represent the MIR image data as a term document matrixX(mxn) of rank rwhose rows represent genes and columns represent individuals. The SVD expres-sesXas the product of three matrices:
X¼URVT ð1Þ
The columns of the U matrix are made up of the orthonormal eigenvectors that span the space corresponding to the gene–gene auto-correlation matrix XXT and termed the left eigenvectors. Likewise V is a matrix whose columns consist of the orthonormal eigenvectors, termed right eigenvectors, that span space corresponding to the individual–individual auto-correlation matrix XTX. The middle matrix denoted by R is a diagonal matrix with
Rij=0 fori=jand Rii=SiC0C0 forVi. TheSi’sare
arranged in descending order withS1CS2CCSn. TheSi’s
are called the singular values ofX, which indicates the weight, or importance, of a dimension [3]. VT is the transpose of
V. The SVD ofXcan also be represented as shown in Fig.2. From the view of Fig.2, the dimensions of each center can be reduced from n tok(k\n).So the less important dimensions, from k to n, corresponding to ‘‘noise’’ are ignored. The reduced rank approximation to the original representation is constructed by dropping these noisy dimensions.
3.3 SVD solution applied to multimedia data similarity search by colors
Color is mostly a combination of frequencies and is one of the most widely used visual features for content-based image retrieval. It is relatively robust and simple to rep-resent. Various studies of color perception and color spaces have been proposed [15,16]. Color has proven to be a very discriminant feature for object recognition and image similarity search on photographic images. Often, color
histograms are used to describe the dominant colors of an image [17]. The color content of an image can be charac-terized by color histogram h(I, N, P), giving the frequency of occurrence, normalized with respect to the overall image pixel number P, each of the N colors quantizing the image color space. Besides being effective for characterizing the global color properties of an image, the color histogram representation is also useful to define a measure of simi-larity between two images [18] in a MDD. Even though they are simple, color histograms are very practical in many applications due to their computational efficiency. Color histograms, do not capture the spatial correlations but the instead color characteristic are maintained. They are authentic to different views of objects and are chosen as they are not dependent on excessive computational resources to be processed. Examples of their use in mul-timedia applications include scene break detection and querying a database of images [19]. A color histogram based on the full range of color values for the RGB model that uses 24 bits represents an equivalently large color vector, (224&16M, representing a histogram which is often called the 16M color histogram). The color histogram is the most commonly used representation technique, sta-tistically describing the combined probabilistic property of the three color channels [20]. Similarity search using color vector requires searching for similar vectors in a high dimensional space. At run-time, a current MDDs’ tech-nology of similarity search cannot afford this high dimensional space cost. Due to this reason, some dimen-sionality reduction is needed.
To provide for effective dimensionality reduction to the problem, we have used SVD approach. Since most simi-larity search in MDD is performed by looking at the sim-ilarity of images using color properties, the SVD solution to the problem is applied by envisioning building a matrix
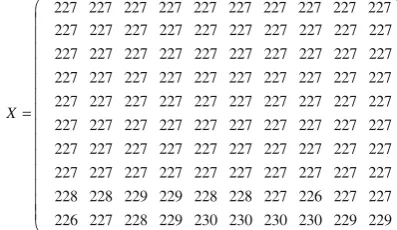
Xcorresponding to the 16M color histogram of a stack of images from which we intend to do image color similarity comparison. A matrix example for the sample image from our multimedia database, together with the left eigenvector, singular values and the right eigenvector are shown in Figs.3,4,5 and6.
The decomposition of the matrixXinto the left eigen-vector U, the right eigeneigen-vectorVTplus the singular (middle) vectorR, is observed to be sparse, showing that the SVD process is useful and a practical empirical type of model.
The nonzero elements of R are always on its main diagonal, with the same dimension as X, and the non-nonnegative diagonal elements in decreasing order.
To decompose the MatrixX, we used the SVD package, SVDPACK, from the NetLib repository. The decomposi-tion was performed using the C version iterative las 2 method from SVDPACK for computing the SVD of large sparse real matrices for multimedia image data, available
at: http://www.netlib.org/svdpack/. We carried out the experiments using a stack of several jpeg images (133 9100 pixels), and constructed 16M (RGB color model) color histograms to build the X matrix: columns
227 227 227 227 227 227 227 227 227 227 227 227 227 227 227 227 227 227 227 227 227 227 227 227 227 227 227 227 227 227 227 227 227
X=
227 227 227 227 227 227 227 227 227 227 227 227 227 227 227 227 227 227 227 227 227 227 227 227 227 227 227 227 227 227 227 227 227 227 227 227 227 227 227 227 227 227 227 227 227 227 227 228 228 229 229 228 228 227 226 227 227 226 227 228 229 230 230 230 230 229 229
⎛ ⎞ ⎟ ⎜ ⎟ ⎜ ⎟ ⎜ ⎟ ⎜ ⎟ ⎜ ⎟ ⎜ ⎟ ⎜ ⎟ ⎜ ⎟ ⎜ ⎟ ⎜ ⎟ ⎜ ⎟ ⎜ ⎟ ⎜ ⎟ ⎜ ⎠ ⎝
Fig. 3 Multimedia image matrix representation
Fig. 4 The left eigenvector
1.0e+003 *
2.2725 0 0 0 0 0 0 0 0 0 0 0.0043 0 0 0 0 0 0
Σ =
0 0 0 0 0.0023 0 0 0 0 0 0 0 0 0 0 0.0000 0 0 0 0 0 0 0 0 0 0 0.0000 0 0 0 0 0 0 0 0 0 0 0.0000 0 0 0 0 0 0 0 0 0 0 0.0000 0 0 0 0 0 0 0 0 0 0 0.0000 0 0 0 0 0 0 0 0 0 0 0.0000 0 0 0 0 0 0 0 0 0 0 0.0000
⎛ ⎞ ⎜ ⎟ ⎜ ⎟ ⎜ ⎟ ⎜ ⎟ ⎜ ⎟ ⎜ ⎟ ⎜ ⎟ ⎜ ⎟ ⎜ ⎟ ⎜ ⎟ ⎜ ⎟ ⎜ ⎟ ⎜ ⎟ ⎜ ⎟ ⎜ ⎟ ⎜ ⎟ ⎜ ⎟ ⎝ ⎠
Fig. 5 The singular values ofX
identify image through a suitable ID while rows describe a color index C (combination of R, G, B values giving one of 16M colors values) [9]. We also reduced the effective number of colors in the histogram as per [21] and ran our SVD package on intelÒPentium(R) Dual CPU T3200 with 2.00 HZ, and 1.00 GHZ SDRAM. The N largest values retained as much information about the original histograms of the stack of images. The SVD of the JPEG images yielded a new matrix containing the left and singular matrices corresponding to theNlargest singular values of
X [21] as shown in Fig.7. For our SVD solution imple-mentation and experiments, we adopted much of the methods used in [21]. The results shows that the values that show the most variability are the retained relevant eigen-values for the problem.
Comparing the similarity of the images on simple color bins histogram verses SVD reduced histogram shows that SVD process is an efficient empirical method to reduce the size of any function describing image properties for simi-larity purpose, and the final sparse formatted matrix used lesser memory of about 50 Mb.
4 Image query quality refinement using histogram equalization
The next step is to refine the image results of the query obtained from the SVD similarity search of Sect.3.3. In our proposal, this is done by enhancement through HE. Image enhancement is one of the most important issues in image processing technology. Its main purpose is to improve the
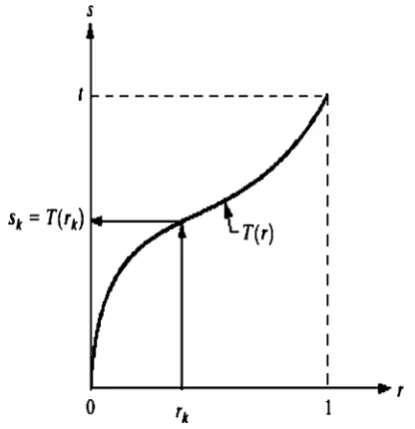
quality of an image from the human visual perspective. It does so by enlarging the intensity difference among objects and background [22]. Image features such as edges, boundaries, and contrast are sharpened in a way that their dynamic range is increased without any change in the information content inherent in the data [23]. There are several techniques that have been developed for image enhancement, amongst them include contrast manipulation, noise reduction, HE, edge crispening and sharpening, fil-tering, pseudocoloring, image interpolation and magnifi-cation. HE is the simplest and most commonly used technique to enhance gray-level images. It is one of the most commonly used methods for image contrast enhancement. It is a technique by which the dynamic range of the histogram of an image is increased by assigning the intensity values of pixels in the input image such that the output image contains a uniform distribution of intensities. The main idea behind HE-based methods then is to re-assign the intensity values of pixels to make the intensity distribution uniform to utmost extent [22]. Each pixel is assigned a new intensity value based on its previous intensity level. Thus, when used for gray scale images, HE attempts to uniformly distribute the pixels of an image or just part of an image [24] to all the available gray levels L (e.g. L =256, when 8 bits are used to represent each gray level). The assumption made by HE is that the pixel gray levels are independent identically distributed random variables (rvs) and the image is a realization of an ergodic random field. As a consequence, an image is considered to be more informative, when its histogram resembles the uniform distribution. From this point of view, grayscale HE exploits the theory of functions of the rv that uses the cumulative distribution function (CDF) of pixel intensity in order to transform the pixel intensity to a uniformly dis-tributed rv. However, due to the discrete nature of digital images, the histogram of the equalized image can be made approximately uniform [25]. We suppose the gray levelris a continuous quantity and normalized in the range [0, 1], with r=0 representing black and r=1 representing white. Consider the enhancement transform function to be given as s=T(r). Assume that the transformation function T(r) satisfies the following two conditions:
1. T(r) is a single-valued and monotonically increasing for r in the interval [0, 1],
2. 0r1 for 0TðrÞ 1:
Condition (1) is needed to guarantee that the inverse transformation will exist, and the monotonicity condition preserves the increasing order from black to white in the output image. A transformation function that is not monotonically increasing could result in at least a section of the intensity range being inverted, thus producing some inverted gray levels in the output image. Condition (2) is
0 200 400 600
2000 4000 6000 8000 1 -104
Las2 Run
EIGENVALUE NUMBER
EIGENVALUE MAGNITUDE
needed to guarantee that the output gray levels will be in the same range as the input levels. Figure8shows a gray-level transformation function that is both single-valued and monotonically increasing, as adopted from [13].
LetPr(r) andPs(s) be two different functions that denote
the probability density functions of rvsrands, respectively [13], in a gray level image. Given thatPr(r) and T(r)are
known and satisfies condition (1), then the probability density functionPs(s) of the transformed variablescan be
obtained by setting
S¼TðrÞ ¼ Zr
0
PrðwÞdw;0r1;
Sods
dr¼PrðrÞ *PsðsÞ ¼ PrðrÞ dr ds
ð2Þ
) PsðsÞ ¼ PrðrÞ
1 PrðrÞ
r¼T1ðsÞ
: ð3Þ
This shows that the probability density function of the transformed variableSis determined by the gray-level PDF of the input image and by the chosen transformation function. A transformation function of particular importance in image processing has the form:
S¼TðrÞ ¼ Zr
0
PrðwÞdw;0r1 ð4Þ
wherewis a dummy variable of integration. The right side of the equation is recognized as the CDF of rvs r. Since probability density functions are always positive, and recalling that the integral of a function is the area under the function, it follows that this transformation function is
single valued and monotonically increasing, and, therefore, satisfies condition (1). Similarly, the integral of a probability density function for a variable in the range [0, 1] also is in the range [0, 1], so condition (2) is satisfied as well. For discrete values, the probability of occurrence of gray levelrkin an image is approximated by:
PrðrÞ ¼
nk
n;0rk1;and k¼0;1;. . .;L1 ð5Þ Sk¼TðrkÞ ¼
Xk
j¼0
nj
n ¼
Xk
j¼0
PrðrjÞ;0r1 and k ¼0;1;. . .;L1 ð6Þ
wherenis the total number of pixels in the image,nkis the
number of pixels that have gray levelrk; andLis the total
number of possible gray levels in the image. Thus, a pro-cessed (output) image is obtained by mapping each pixel with levelrkin the input image into a corresponding pixel
with level Sk in the output image via Eq. (6). The
trans-formation (mapping) given in Eq. (6) is what is referred to as the HE. So given an image retrieved by SVD application to similarity search by colors, the process of enhancing the same for purposes of use in the retrieval of a refined and more similar image from the Multimedia Databases implies simply implementing Eq. (6). This procedure re-assigns the intensity values of the pixels and make their distribution uniform. The obtained results can further be enhanced using GAs. GAs are used to enhance image contrast [26]. Though we did not implement it in our proposal; we hereby just mention one procedure through which this can be achieved.
One method of doing this is by mapping the intensity of image values according to the predefined range for the gray-level image values. Each intensity value Iis mapped to a new value B [27]. In this case, each chromosomexof the image is represented by an integer byte, where each byte (gene) encodes the differenceb(j-1) between values of transformed curveB(j) andB(j-1),Fig.9, wherejis a byte position in chromosome.
The value of curveB(j) is represented by: BðjÞ ¼ 0 J¼0;
Bðj1Þ þbðj1Þ; 1jImaxImin;
ð7Þ
where Imax and Imin represent maximum and minimum intensity values.
The fitness of each individual is measured by calculating the sum of edge intensities, which are produced by Prewitt transform of enhanced image [28]. The most fit individual is considered to be the one, which creates most intense edges. The least fit individuals are extinguished and their place is taken by newly created offsprings. Thus, offsprings form a new generation which replaces the old one [28]. Such evolution process can be terminated using various
conditions, for example, when fitness reaches a predefined threshold, evolution takes certain number of generations or fitness converges to a specific value [29]. The output of the enhanced image results using the HE procedure in this section is referred to as the QQR procedure. Output image forms the refined updated status of the query to be used in the next SVD similarity search experience of Sect.3.3.
5 QQR enhancement experimental results
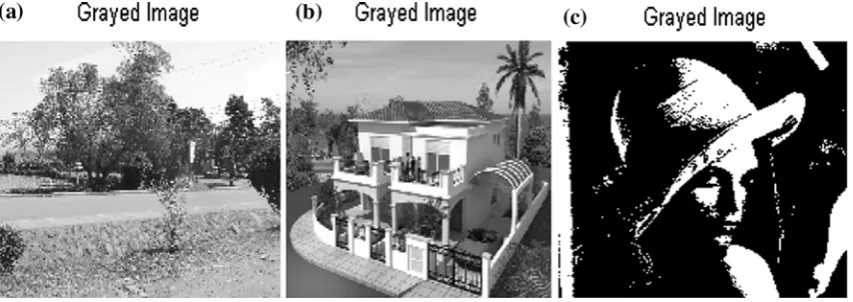
In our experiments, the range of the gray-level values of the images is [0, 255]. We have tested our results on 2569256 images retrieved from Sect.3.3. The image size is 2569256. Figure10a–c shows some of the original retrieved SVD RBG images.
The respective histogram results are shown in Fig.11. The histogram results confirm what we see if the MIR images are retrieved basically using SVD only. The resulting image has a poor dynamic range and when used as a query image, gives rise to a broad search space. In order to improve the contrast of this image, without affecting the structure (i.e. geometry) of the information contained therein, we applied the HE operator. The histogram results
obtained from the experiments in Figs.10 and 11 were reused to produce the final HE results shown in Figs.12,13. As a result, each pixel was assigned a new intensity value based on the previous intensity levels, giving the desired enhanced image results.
Several images were enhanced by the implementation of the proposed HE approach. It is observed that histograms of the equalized images are uniform, spanning a fuller range of the gray scale without the need for further parameter specifications, leading to a conclusion that Image enhancement has as its main task to improve the visual quality of an image from the human perspective [26]. The results demonstrated that the proposed approach enhances the images effectively. The enhanced image results produced in the QQR then become the refined adjusted status of the query to be used in the next iterative search with SVD, forming the QQR–SVD retrieval pro-cedure. The refined image results forms the ideal query image equivalent to that in the user’s mind, hence nar-rowing the search space by retrieving only those images that are very similar to those being requested by a user.
6 Image quality analysis
The goal of evaluating the image quality at this stage is to identify the degree of deviation from the ideal situation. This evaluation is appropriate for predicting user accep-tance of a retrieved image and at the same time for systems optimization. In general, the quality of the image retrieved by SVD similarity search is compared to that retrieved through the enhanced method QQR–SVD. The comparative results are valuated using objective and subjective methods. Objective methods are those that are defined by mathe-matical definition, such as peak signal to noise ratio (PSNR), human visual system (HVS), etc. On the other hand, the subjective ones which are based on the human
Fig. 9 Brightness mapping curve
perception are specified by mean opinion score (MOS), which is a standard for evaluating image quality. Since human beings are the ultimate receivers in most multimedia applications, the most obviously reliable and commonly used assessment method of image quality is a subjective rating by human observers [26]. To obtain reliable quality rating, subjective viewing tests have to be performed on the post-processed images. Subjective rating methodologies are divided into two primary categories, rating scale methods and comparison methods. In the rating scale methods, the subject views a sequence of images under comfortable conditions and assigns each image to one of several given categories. In the comparison method, the scale is based on a comparison within a set of images [26]. To carry out a qualitative image analysis; a nonlinear mapping between the objective model outputs and subjective quality ratings was used. This is according to the Video Quality Experts Group (VQEG) Phase I testing and validation. The sub-jective model used the MOS [30] while the objective model was carried out using M-SVD. In our proposed work, the retrieved images using SVD similarity search and those retrieved by QQR procedure are saved in the JPEG format,
automatically compressing them in that format. MOS Data for the test images were then calculated using:
MOS¼1
N
XN
i¼1
scorei ð8Þ
High quality printouts of the two categories of images were subjectively evaluated by approximately 20 observers. The images were printed out using a high quality Hewlett-Packard printer. The 8-2/160098-2/1600 images were printed on 8.500 91100white paper with basis weight 20 lb and brightness 84. In the experiment, the observers were chosen among the undergraduate/graduate students and professors. About half of the observers were familiar with image processing, and the others only had computer science background. They were asked to rate the images using a 50-point scale within the two categories: those retrieved using SVD, and those retrieved as a result of QQR, QQR-SVD. For each test image, we displayed 50 retrieved images for each level against the original image, and asked the observers to rate them. As the proposed measure is not HVS based, no viewing distance was
Fig. 11 a–cSaturation histograms of the original RGB images of Fig.10
imposed on the observers in the experiment. Grade 1 was assigned to the best image while grade 50 was assigned to the worst image. To evaluate distorted image sequence for the two levels of retrieved images, an objective model was carried out using a quality measure. This quality measure, called measurement SVD (M-SVD) [31], is given by: M-SVD¼
Pðk=nÞXðk=nÞ
i¼1 jDiDmidj
k=n
ð ÞXðk=nÞ ð9Þ
where Di represents a bivariate graphical measure, Dmid
represents the mid point of the sortedDi’s, k is the image
size, and n is the block size. The graphical measure Di
computes the distance between the singular values of the original image block and the singular values of the retrieved image block, and is given by:
Di¼Sqrt Xn
i¼1
ðXiXÞ 2
!
" #
; ð10Þ
whereXiare the singular values of the original block,Xiare
the singular values of the distorted block, andnis the block size. The block size used in our experiments is 898 for the main reasons that it is a common block size in JPEG image
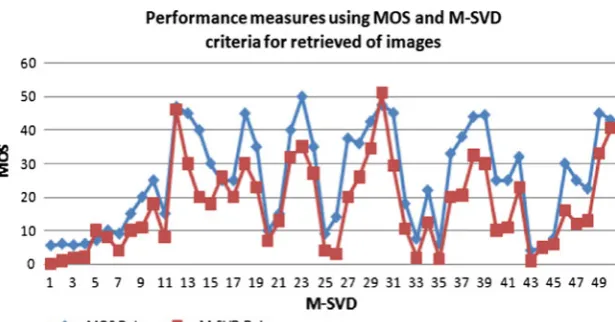
processing applications. The numerical measure is a deriva-tion from the graphical measure. The graphical measure consistently displays the type and amount of distortion as well as the distribution of error in all the images [31] for the two given levels of retrieval. The performance of the two mea-sures and evaluated results are demonstrated using Fig.14.
For M-SVD, we considered the image block size, and noted that the smaller the size of the retrieved image block results in more detailed deviation leading to a higher cor-relation with the subjective evaluation, and vice versa. As for the subjective MOS measure, the effect was that for SVD, the average rating was fair while for QQR–SVD was given a rating of good. The evaluation shows the perfor-mance of QQR–SVD search positively influences the sim-ilarity search results of image retrieval. The graphical results of Fig. 14demonstrate the two performance measures.
7 Incorporation of QQR results into genetic algorithm for image similarity retrieval efficiency
Although HE can scale the histogram linearly and smoothly and do it automatically, the results of the processed image
Fig. 13 Histograms of the equalized Image results (a–c)
which forms a set of possible solutions might not satisfy the retrieval needs of a user. The retrieval process, for a given query image, finishes at a point when the user is satisfied with the retrieved images [32]. Our final goal is to have our retrieval process formalized as an optimized similarity retrieval search process. The GA, initially published by John Holland [4], is used in our proposal to introduce a stochastic optimization and global approach for the image similarity search problems. The basic idea behind solving optimization problems, with few cost function evaluations, is to keep good solutions through a process of evolutionary competitions [4]. Our proposal to incorporate QQR–SVD results into GAs is to optimize our method so that the ‘‘best solutions’’ can be preserved during the evolutions such that the search can gradually approach the desired similarity results. GAs have been proven to be the most powerful optimization techniques in a large solution space [32]. This explains the increasing popularity of GAs applications in image processing. There are several possible approaches of incorporating QQR–SVD results into GAs, but the one considered and evaluated here is based on qualifying can-didate individuals for reinsertion [2]. Candidate images that are retrieved during QQR stage are qualified for reinsertion into the next generation process. QQR–SVD exposes the most striking similarities between a given vector and another set of vectors, improving the visual quality of the image from the human perspective. The final results are then used to influence the direction of the GA’s search process. One benefit of this approach is that the fitness function need not be computed in order to determine that an individual closely resembles another individual whose fit-ness is already known. Starting with a population of ran-domly created and enhanced QQR–SVD individuals, our GA progressively breeds a population of the individuals over a series of generations using natural selection, cross-over (recombination), mutation, and other genetic opera-tions. This means then that solving a problem using GA requires specification of the following: (1) chromosome representation (population encoding), (2) fitness measure, (3) selection and, (4) GA operators.
7.1 Population encoding
Since a matrix data representation can be viewed simply as a generalization of a vector, Multimedia Digital Data retrieval is based on the vector space model. To implement a GA to perform similarity query, each possible solution from the QQR–SVD image set must be encoded as a chromosome. The core idea of population encoding is to treat the data representation of the image as a bulk of genes. Each gene is represented by an integer that indicates the number of pixels with similar characteristic color property in the image [33]. Our GA receives an initial population consisting of
chromosomes corresponding to the relevant and the irrele-vant documents, and the supposedly optimized query from QQR to SVD process. The vectors corresponding to the documents provided as feedback at the end of QQR–SVD procedure are subjected to a conversion process [34] to transform them into the chromosomes corresponding to the relevant documents and the irrelevant documents that our GA will work with. These chromosomes will have the same number of genes (components) as the query and the feed-back documents have terms with non-zero weights. First, the set of terms contained in those documents and the query is calculated, and the size of the chromosomes will be equal to the number of terms of that set [34]. Each chromosome has a corresponding point in the search space. The algorithm starts with the initial solutions that are selected from a set of configurations in the search space using randomly generated solutions. Each of the initial solutions (called an initial population) is evaluated using a user-defined fitness func-tion. A fitness function exists to numerically encode the performance of the chromosome [33].
7.2 Fitness function
Each chromosome solution is evaluated by a predefined objective function. The value, derived from the objective function, is the fitness value, which represents the strength, or quality, of a solution. According to the fitness value, GA’s can choose ‘‘better genes’’ to form offspring [33]. Choosing an appropriate fitness function is very important [35]. Fitness function for our work was considered as the functions for precision and recall of the corresponding query. Retrieved images were ranked according to the similarity score. Precision and recall fitness function work well with ranked documents, where all assignments of the initial population are ordered according to their similarity score and the best are chosen to survive. The shortcoming of using recall and precision as fitness functions is that if no relevant documents are retrieved by a chromosome, then its fitness is zero. This will lead to loss of all genes for this chromosome [36]. Our fitness functions were based on the average of the best individual, for each generation. It was considered with the following set of parameters: proba-bility of crossover (Pc=0.8), and probability of mutation (Pm=0.7). The objects that survived at the next genera-tion were chosen with probability proporgenera-tional to their rank. Fitness values were computed for the two generated new offsprings, and after that the best chromosomes sur-vives for the next generation.
7.3 Selection stage
reproduce multiple copies in the next generation for reproduction. As the selection mechanism, the GA used ‘‘simple random sampling’’ [4]. The well-known roulette wheel selection strategy was employed as the selection mechanism in our model. This consisted in constructing roulette with the same number of slots as there were individuals in the population, and in which the size of each slot is directly related to the individual’s fitness value. Hence, the best chromosomes on average achieved more copies, and the worst fewer copies [1]. ‘The Elitist tion’ strategy was also used as a compliment to the selec-tion mechanism, whereby the most fit members of each generation are guaranteed to be selected [37], ensuring that the best individual was copied and not lost in the sub-sequent generations. If, after generating the new popula-tion, the best chromosome of the preceding generation is by chance absent, the worst individual of the new popu-lation is withdrawn and replaced by that chromosome [38]. A set of individuals that have high scores in the fitness function were selected to reproduce itself. Such a selective process results in the best-performing chromosomes in the population to occupy an increasingly larger proportion of the population over time. Processing the GA operators was done in each generation over the best two chromosomes. From the population of chromosomes, the best two chro-mosomes depending on the highest fitness values for pre-cision or recall measures were selected. These two chromosomes were called parent 1 and parent 2. The two parents were then used to produce two new offsprings [36]. 7.4 Operators
Crossover operator is the genetic operator that mixes two chromosomes together to form new offspring. Crossover occurs only with crossover probability Pc. Chromosomes that are not subjected to crossover remain unmodified [38]. The crossover operator creates new individuals by recom-bining genetic characteristics from its parents. Crossover operates by swapping corresponding segments of a string representation of a couple of chromosomes (called ‘‘par-ents’’) to produce two chromosomes (called ‘‘children’’). In generating two new offsprings from the existing popula-tion, offsprings must have some inheritance from the two parents [36]. Our algorithm uses the simple one-point crossover: a cutting site is chosen at random and the chil-dren are obtained by each taking the first part from one parent and the second part from the other parent.
Mutation is the second operator used in our proposed system. Mutation involves the modification of the gene values of a solution with some probabilityPm[38]. This operator guarantees the entire state-space is searched, given enough time. It restores lost information or adds informa-tion to the populainforma-tion. Mutainforma-tion operates on a single
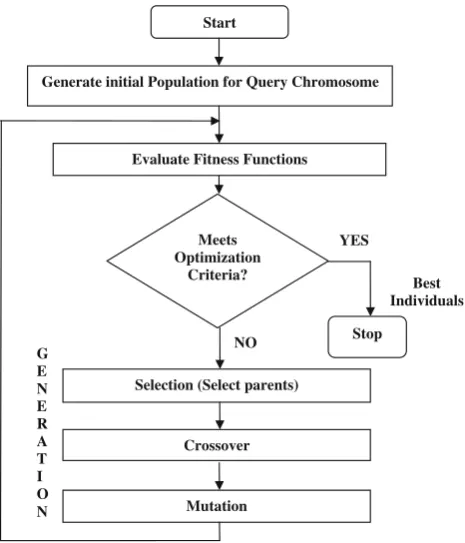
chromosome: one element is chosen at random from the chain of symbols, and the bit string representation is changed with another one. When a mutation happens, a gene is randomly modified in the individual’s chromosome. Mutations prevent search stagnation, enabling the explo-ration of search space’s areas that could not be reached with crossover operator, depending on the initial popula-tion. After executing the three genetic operators, a new population was generated, and a new cycle began. The GA was executed until the maximum amount of time that was set to execute was satisfied. This was repeated until the best solution was arrived at [36]. Figure15presents an outline of execution cycle of the developed GAs.
8 GA retrieval experiments and evaluation
There are several experiments that can be implemented and used to evaluate the quality of an information retrieval system. In such experiments, some of the quality aspects often measured include system efficiency, effectiveness and other subjective aspects related to the user satisfaction. In this paper, we considered images in a MDD with over 6,000 images. The images were from various categories, including airplanes, animals, buildings, vehicles, furniture, human beings, environment, and text. Query images were selected at random and used in the SVD–GA and QQR– SVD–GA retrieval process. The efficiency of the proposed
Start
Generate initial Population for Query Chromosome
Evaluate Fitness Functions
Selection (Select parents)
Crossover
Mutation Meets Optimization
Criteria?
Stop G
E N E R A T I O N
YES
Best Individuals
NO
system was then evaluated by computing the quality of responses using precision and recall, computing the Euclidean distances and by measuring the CPU time taken to retrieve a given image. In IRS, recall and precision are the two most widely used measures of retrieval perfor-mance [39]. We evaluated the results of the retrieval via these two classical measures, which formed the fitness function for our work. Recall and precision are often per-ceived as being inversely related, i.e., complementary and competitive [16]. Precision,P, is defined as the number of relevant documents retrieved divided by the total number of documents retrieved. Recall,R, is defined as the number of relevant documents retrieved divided by the total num-ber of relevant documents in the index. Their mathematical expression is shown as follows:
P¼ P
drd:fd P
dfd ;R¼
P drd:fd P
drd
ð11Þ
withrd[{0, 1} being the relevance of documentdfor the
user andfd={0, 1} being the retrieval of documentd in
the processing of the current query. Both measures are defined in the range [0, 1]. The experiment was performed on several queries tested at crossover probabilityPc=0.8 and mutation ratePm=0.7 for the two GAs (Basic SVD– GA and QQR SVD–GA). The mean precision values at given recall intervals for the algorithm were implemented. The results of the experiment are as shown in Fig.16.
The second evaluation technique uses the Euclidean distance, given by:
ffiffiffiffiffiffiffiffiffiffiffiffiffiffiffiffiffiffiffiffiffiffiffiffiffiffiffiffiffiffiffiffiffiffiffiffiffiffiffiffiffiffiffiffi
a1b1
ð Þ2þða2b2Þ2 q
ð12Þ
This measures the image content similarity. Image distance results between the two sets of retrieved images
using the two named techniques, SVD–GA and QQR–SVD in relation to the query image. Results were obtained and their Euclidean distance computed. Then the graphical results are plotted and shown in Fig.17.
Another comparison measure that was used to evaluate our proposal efficiency is CPU time that was required to process the retrieval executions for the two techniques.
We observe as shown in Fig.18that the performance of QQR–SVD–GA search considerably gives an improvement to the similarity search capability with a better cpu pro-cessing time than when basic SVD–GA search. This is attributed to the fact that the enhancement process refines the query image, narrowing the search space and hence retrieving only those images that are very similar to those being requested by a user.
Fig. 16 Precision-recall experimental results
Fig. 17 Comparison of SVD–GA and QQR–GA retrieval performances
9 Conclusion
In this study, we presented a method for improving the quality of image similarity search results from a MMD that addresses the quality of the search experience over complex data. SVD technique is applied in the paper to effectively provide dimensionality reduction of the MMD and perform simple similarity search from the database using color properties. QQR of the query results was enabled by image enhancement of the retrieved image results. The final QQR– SVD results are incorporated into GAs, based on qualifying candidate individuals for reinsertion into the next genera-tion process. Results from several applicagenera-tion domains show that using the technique greatly influence the amount of performance improvement of the multimedia image similarity data retrieval. Further testing and development on several different types of problems and parameter strate-gies, like the input/output time will be required in order to go beyond these attempts of exploiting the SVD in such a way as to exhibit positive phenomena in GAs.
References
1. Lopez-Pujalte, C., Guerrero-Bote, V.P., de Moya-Anegon, F.: Genetic algorithms in relavance feedback: a second test and new contributions. Inf. Process. Manag.39, 669–687 (2003) 2. Martin, J.G., Rasheed, K.: Using singular value decomposition to
improve a genetic algorithm’s performance. In: Proceedings of the 2003 Congress on Evolutionary Computation CEC2003, pp. 1612–1617, Canberra, 8–12 Dec 2003 IEEE Press
3. Liu, Y., et al.: A survey of content-based image retrieval with high-level semantics, 2006 Pattern Recognition Society, Elsevier. Pattern Recogn.40, 262–282 (2007)
4. Holland, J.H.: Adaptation in Natural and Artificial Systems. University of Michigan Press, Ann Arbor (1975)
5. Huang, M.-J., Hwa-Shan, H., Chen, M.-Y.: Constructing a per-sonalized e-learning system based on genetic algorithm and case-based reasoning approach. Expert Syst. Appl. 33(3), 551–564 (2007)
6. Ahmed, A. A., Radwan et al.: Using genetic algorithm to improve information retrieval systems, World Academy of Science, Engineering and Technology, vol. 17 (2006)
7. Boughanem, M., Chrisment, C., Tamine, L.: On using genetic algorithms for multimodal relevance optimization in information retrieval. J. Am. Soc. Inf. Sci. Technol.53(11), 934–942 (2002) 8. Horng, J.T., Yeh C.C.: Applying genetic algorithms to query optimization in document retrieval. Inf. Process. Manag. 36(5), 200, pp. 737–759
9. Vrajitoru, D.: Crossover improvement for the genetic algorithm information retrieval. Inf. Process. Manag.34(4), 405–415 (1998) 10. Bueno, R., Traina, A.J.M., Traina Jr, C.: Genetic algorithms for approximate similarity querries. Data Knowl. Eng. 62(3), 459–482 (2007)
11. Carlo, M., Fabrizio, S., Umberto, S.: A model of multimedia information retrieval. J ACM48(5), 909–970 (2001)
12. Magalha˜es, J.: Statistical models for semantic-multimedia infor-mation retrieval. PhD thesis, University of London, Imperial College of Science, Technology and Medicine, 2008
13. Lew, M.S.: Content-based multimedia retrieval: state of the art and challenges, ACM transactions on multimedia computing. Commun. Appl.2(1), 1–19 (2006)
14. Song, W., Park, S.C.: An efficient method of genetic algorithm for text clustering based on singular value decomposition. Sev-enth International Conference on Computer and Information Technology, IEEE (2007)
15. Smeulders, A., Worring, M., Santini, S., Gupta, A., Jain, R.: Content based image retrieval at the end of the early years. IEEE Trans. PAMI22(12), 1349–1379 (2000)
16. Rui, Y., Huang, T.S., Chang, S.F.: Image retrieval: past, present and future. J. Vis. Commun. Image Represent.10, 1–23 (1999) 17. Saxer, S.A.: Region based image similarity search, Diploma
Thesis (2002)
18. Colombo, C., Del Bimbo, A., Genovesi, I.: Interactive image retrieval by color distribution content, Integrated Computer-Aided engineering, vol. 7, no. 1 (2000)
19. Pass, G., Zabir, R.: Histogram refinement for content-based retrieval, IEEE Workshop on Applications of Computer Vision, Citeseer (1996)
20. Li, Q., et al.: Linguistic expression based image description framework and its application to image retrieval. StudFuzz210, 97–120 (2007)
21. Guillon, F., Murray, D.J.C., DesAutels, P.: Singular value decomposition to simplify features recognition analysis in very large collection of images, ACAT workshop (2000)
22. Cheng, H.D., Shi, X.J.: A simple and effective histogram equalization approach to image enhancement. Digit. Signal Pro-cess.14, 158–170 (2004)
23. Jain, A.K.: Fundalementals of digital image processing. Prentice-Hall, Engelwood Cliffs (1986)
24. Bassiou, N., Kotropoulos, C.: Color histogram equalization using probability smoothing, 14th European Signal Processing Con-ference (EUSIPCO 2006), Florence, Italy, 4–8 september (2006) 25. Bassiu, N., Kotropoulos, C.: Color image equalization by abso-lute discounting back-off. Comput. Vis. Image Underst.
107(1–2), 108–122 (2007)
26. Winkler, S., Mohandas, P.: The evolution of video quality mea-surement from PNSR to hybrid metrics. IEEE Trans. Broad-casting, vol. 54, no. 3 (2008)
27. Paulinas, M., Usˇinskas, A.: A survey of genetic algorithms applications for image enhancement and segmentation. Inf. Technol. Control,36(3) ISSN 1392-14X (2007)
28. Saitoh, F.: Image contrast enhancement using genetic algorithm. IEEE International Conference on Systems, Man, and Cyber-netics, IEEE SMC’99, vol. 4, pp. 899–904 (1999)
29. Owais, S., Kromer, P., Snasel, V.: Computer Engineering and Systems (2006)
30. Silva, E.A., Panetta, K., Agaian, S.S.: Quantifying image simi-larity using measure of enhancement by entropy. In: Proceedings on Mobile Multimedia/Image Processing, Citeseer (2007) 31. Shnayderman, A., Gusev, A., Eskicioglu, A.M.: An SVD-based
grayscale image quality measure for local and global assessment. IEEE Trans. Image Process.15(2), 422–429 (2006)
32. Stejic, Z., Takama, Y., Hirota, K.: Genetic algorithm-based rel-evance feedback for image retrieval using local similarity pat-terns. Inf. Process. Manag.39(1), 1–2 (2003)
33. Huan, Y.-P. et al.: Improving image retrieval efficiency using a fuzzy inference model and genetic algorithm, Fuzzy Information Processing Society, 2005. Annual Meeting of the North Ameri-can, pp. 361–366, NAFIPS (2005)
34. Lo0 pez-Pujalte, C., Guerrero-Bote, V.P.: Order-based fitness functions for genetic algorithms applied in relevance feedback. J. Am. Soc. Inf. Sci. Technol.54(2), 152–160 (2003)
Proceedings of the 33rd Hawaii International Conference on System Sciences (2000)
36. Richta, K., Sna´sˇel, V., Porkorny, J (eds.): Query Optimization by Genetic Algorithms, Dateso 2005, pp. 125–137. ISBN 80-01-03204-3
37. Adam M.: Genetic Algorithms and Evolutionary Computation (2004)
38. Aly, A.A.: Applying genetic Algorithm in Query improvement problem. Int. J. Inf. Technol. Knowl.1, 309–316 (2007) 39. Vizinel, A.L., Leandro, N., Gudwin, R.: An evolutionary