ISSN 2348 – 7968
480
Improvement of Voltage Stability in Power System by Using
SVC and STATCOM
Sarita Bhole1, Prateek Nigam 2
1 Department of EE, RGPV University/RKDF Institute of science and Technology,
Bhopal, Madhyapradesh, India
2 Department of EEE, RGPV University/RKDF Institute of science and Technology,
Bhopal, Madhyapradesh, India
Abstract
The increase in power demand has forced the power system to operate closer to its stability limit. Voltage instability and line overloading have become challenging problems due to the strengthening of power system by various means. The nature of voltage stability can be analyzed by the production, transmission and consumption of reactive power. One of the major causes of voltage instability is the reactive power unbalancing which occurs in stressed condition of power system. Flexible AC transmission system (FACTS) devices play an important role in improving the performance of a power system, but these devices are very costly and hence need to be placed optimally in power system. In this paper, a method based on line stability index, real power performance index and reduction of total system VAR power losses has been proposed to decide the optimal location of TCSC.
Now a day, Voltage Stability has become a major concern in power systems planning and operation. This problem has become very complex due to the continuous growing on system interconnections and demand for electricity and also due to economical and environmental constraints to properly expand the system.
Keywords: Flexible AC Transmission System (FACTS), Static Var Compensator (SVC), Power System Analytical Toolbox (PSAT), Voltage Stability, Voltage Stability Index (VSI)
1. Introduction
Most of the large power system blackouts, which occurred worldwide over the last twenty years, which are caused by heavily stressed system with large amount of real and reactive power demand and low voltage condition. When the voltages at power system buses are low, the losses will also to be increased. This study is devoted to develop a technique for improving the voltage and eliminate voltage instability in a power system. Application of Flexible AC Transmission System (FACTS) devices are currently pursued very intensively to achieve better control over the transmission lines for manipulating power flows. They can provide direct and flexible control of power transfer and are very helpful in the operation of power network. The power system performance and the
power system stability can be enhanced by using FACTS device [1].
FACTS devices, which are power electronic based devices can change parameters like impedance, voltage and phase angle. They also helps to reduce flows in heavily loaded lines, resulting in an increased loadability, low system loss, improved stability of the network, reduced cost of production and fulfilled contractual requirement by controlling the power flows in the network. They provide control facilities, both in steady state power flow control and dynamic stability control [2]. The possibility of controlling Power flow in an electrical power system without generation rescheduling or topological changes can improve the performance considerably. Static Var Compensator (SVC) is one of the most effective device for enhancing the power stability and power transfer capability of transmission network, for this the SVC should be properly installed in the system with appropriate parameter setting. The some factors considering for optimal installation and the optimal parameter of SVC , which are the stability margin improvement, power loss reduction, power blackout prevention and the power transmission capacity enhancement [3].
This paper presents the method of the optimal location of SVC for enhancing the voltage stability of the power system using VSI. The SVC has been tested on the 9-Bus test System and the solution for optimal location of this device will obtain and discuss in this section.
2. Mathematical Model of SVC
In this paper steady state model of FACTS devices are developed for power flow studies. SVC modelled is incorporated into the bus as shunt element of transmission line. Mathematical model for SVC is implemented by MATLAB programming language.
ISSN 2348 – 7968
481
Static VAR compensator (SVC)
The SVC uses conventional thyristors to achieve fast control of shunt-connected capacitors and reactors. The configuration of the SVC is shown in Fig.1, which basically consists of a fixed capacitor (C) and a thyristor controlled reactor (L). The firing angle control of the thyristor banks determines the equivalent shunt admittance presented to the power system.
A shunt connected static var generator or absorber whose output is adjusted to exchange capacitive or inductive current so as to maintain or control bus voltage of the electrical power system. Variable shunt susceptance model of SVC [2] is shown in Fig.1
Fig 1: Variable shunt susceptance model
As far as steady state analysis is concerned, both configurations can modeled along similar lines, The SVC structure shown in Fig. 1 is used to derive a SVC model that considers the Thyristor Controlled Reactor (TCR) firing angle as state variable. This is a new and more advanced SVC representation than those currently available. The SVC is treated as a generator behind an inductive reactance when the SVC is operating within the limits. The reactance represents the SVC voltage regulation characteristic. The reason for including the SVC voltage current slope in power flow studies is compelling. The slope can be represented by connecting the SVC models to an auxiliary bus coupled to the high voltage bus by an inductive reactance consisting of the transformer reactance and the SVC slope, in per unit (p.u) on the SVC base. A simpler representation assumes that the SVC slope, accounting for voltage regulation is zero. This assumption may be acceptable as long as the SVC is operating within the limits, but may lead to gross errors if the SVC is operating close to its reactive limits [3]. The current drawn by the SVC is,
I
SVC
jB
SVCV
K The reactive power drawn by SVC, which is also the reactive power injected at bus k is,.
2SVC K K
SVC
Q
V
B
Q
Where, VK – voltage at bus k
SVCB
Susceptance
SVCQ
Reactive power drawn by SVC.Major headings are to be column centered in a bold font without underline. They need be numbered. "2. Headings and Footnotes" at the top of this paragraph is a major heading.
3. Optimal Location Of FACTS Devices
To improve the voltage profile and voltage stability of a power system an alternative solution is to locate an appropriate Flexible AC transmission system (FACTS) device [2]. FACTS devices are the solid state converters having capability of improving power transmission capacity, improving voltage profile, enhancing power system stability, minimizing transmission losses etc. In order to optimize and to obtain the maximum benefits from their use, the main issues to be considered are the type of FACTS devices, the settings of FACTS devices and optimal location of FACTS devices.
The optimal location of SVC has been selected on the basis of voltage stability index (VSI) for improvement of voltage stability of power system [6,7]. Voltage stability index can be used for determining the weakest line in a power system. This voltage stability index considers both active and reactive powers to evaluate voltage stability, which provides information about the stability condition of the lines and also determines the weakest line in the system.
4. Voltage Stability Index
Voltage stability is becoming an increasing source of concern in secure operating of present-day power systems. The problem of voltage instability is mainly considered as the inability of the network to meet the load demand imposed in terms of inadequate reactive power support or active power transmission capability or both. It is mainly concerned with the analysis and the enhancement of steady state voltage stability based on index. This L-Index [3] determines how any system is close to its instability limit.
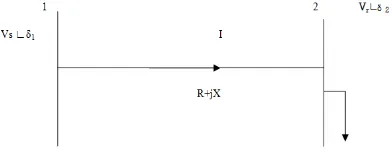
Consider, a simple system consisting of sending and receiving end buses as shown,
ISSN 2348 – 7968
482 Where: VS, VR = sending and receiving voltages at system
buses
δ1, δ2 = sending and receiving voltages angle at system
bus 1 and 2
P, Q = real and reactive power at buses R+ JX = line impedance between bus 1 and 2.
Current flowing through the branch,
jX R
V V I S r
1
2PjQVr*I
jX R jQ
P V sV r V r
1 2 2
V
V
V s r r
jX R jQ
P )( ) 1 2 2
(
The real term of above equation is,
... . 1cos 2
2
1
V
RP XQV
V
s r
r And imaginary part is,
... ...
2sin 1 2 XP RQ
V
V S S
Squaring and adding the above two terms, we get
2 2 2 2 2 2 2 0
2
4
V V P Q R X
V r r RP XQ S
The above equation is a quadratic equation of
V
r 2
0 4
2
ac
b
, i.e.
2
2 4 2 2 2 2 02
XQ V P Q R X
RP S
After simplifying the above equation, we get the equation for the stability index can be written as,
2 2 2 ) . ( 4 S S U P V XQ RP V RQ PX L
Where L = stability index. For stable system, L< 1.
It can be seen that when a load bus approaches a steady state voltage collapse situation, the L-index approaches the numerical value 1.0. Hence for an overall system voltage stability condition, the index evaluated at any of the buses must be less than unity. Thus the index value L gives an indication of how far the system is from voltage collapse [6].
5. Result and Discussion
For the validation of the proposed FACT’s devices, SVC have been tested on the WSCC 9-Bus test System. A MATLAB code for both techniques was developed for simulation purpose.
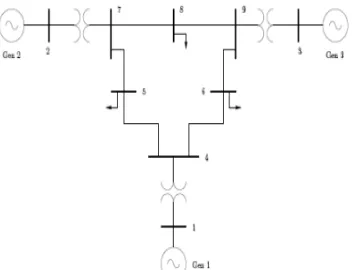
An WSCC 9 bus test system and this test system including 9 buses ,3 generators ,6 lines ,3 transformers and 3 loads is simulated using PSAT .and used to try models and control strategies is presented. The generators are modelled as standard PV buses with both P and Q limits; loads are represented as constant PQ loads. The P and Q
load powers are not voltage dependent and are assumed to change as follows
P
01P
L L
1
0
Q
Q
L LWhere PLo and QLo are the active and reactive base loads.
Whereas PL and QL are active and reactive loads at bus L
for the current operating point as defined by λ.
Fig 3: WSCC 9 bus test system
Line Data
Line R (p.u.) X (p.u.) B (p.u.)
9-8 0.0119 0.1008 0.2090
7-8 0.0085 0.0720 0.1490
9-6 0.0390 0.1700 0.3580
7-5 0.0320 0.1610 0.3060
5-4 0.0100 0.0850 0.1760
6-4 0.0170 0.0920 0.1580
2-7 0.000 0.0625 0.0000
3-9 0.000 0.0586 0.0000
1-4 0.000 0.0576 0.0000
Table 1: Line data for 9-bus system
Line P (p.u.) Q (p.u.) L-Index
9-8 0.24183 0.0312 0.02463
7-8 0.7638 -0.00797 0.03353
9-6 0.60817 -0.18075 0.01660
7-5 0.8662 -0.08381 0.12752
5-4 -0.4068 -0.38687 -0.1452
6-4 -0.3053 -0.16543 -0.0771
2-7 1.63 0.06654 0.0534
3-9 0.85 -0.1086 -0.0152
1-4 0.7164 0.27046 0.0634
ISSN 2348 – 7968
483
Location of SVC
Voltage stability indices are calculated for the WSCC 9 bus system without SVC as shown in table 2. By considering the Voltage stability index (L-Index) value, it is observed that line 7-5 is more sensitive towards system security. Therefore it is more suitable location for SVC to improve power system security/stability. After placement of SVC voltage stability is improved, the analyses of voltage magnitudes for WSCC 9 bus test system without and with SVC as shown in table 3.
Table 3: Analysis of Voltage magnitudes for 9 bus test system without and with SVC
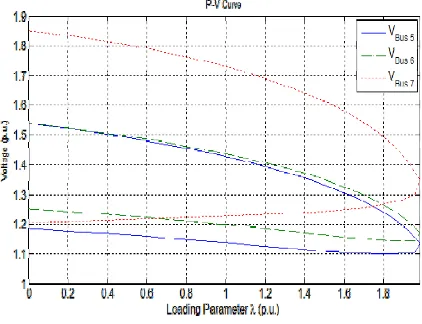
6. Simulation Results
Base case
The continuation power flow analysis using PSAT [12] is run for the test system and the voltage profile without SVC is obtained. The voltage profile and PV curve for the bus 5, bus 6and bus7. It can be seen from the figure that the maximum loading parameter
1.8708 p.u for the base case.Fig 4: (a) Voltage profile for the base case without SVC
Fig 4: (b) P-V Curve without SVC
With SVC
It is seen from Fig. 4(b) that the voltage collapse occurs at the maximum loading of
8708
.
1
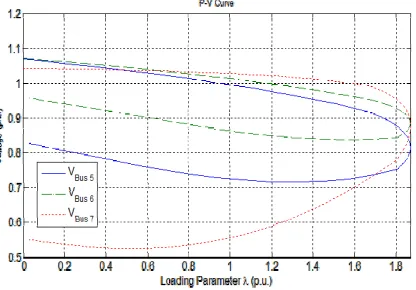
and line 7-5 is the best location forshunt compensation. As described in the earlier section, the SVC was placed in the weakest bus lines one at a time and it was found that for this system bus line 7-5 shunt compensation has better results. Fig.5 (a) gives the voltage profile for the system with SVC. It is seen that the maximum loading factor
1
.
9815
has increases when compared to the base case.Fig 5: (a) Voltage profile with SVC
Bus Before Placement of
SVC After Placement of SVC
VM (p.u.) VM (p.u.)
1 1.038 1.040
2 0.858 1.025
3 0.960 1.025
4 0.924 1.026
5 0.789 0.997
6 0.862 1.014
7 0.825 1.029
8 0.819 1.025
ISSN 2348 – 7968
484 Fig 5: (b) P-V curve with SVC
7. Conclusion
In this paper, a new method for optimal placement and parameters settings of SVC has been proposed for improving voltage profile in a power system. The proposed approach has been implemented on WSCC 9-bus system. The criterion for selection of optimal placement of SVC was to maintain the voltage profile, minimize the voltage deviations and to reduce the power losses using VSI. Simulations performed on the test system shows that the optimally placed SVC maintains the voltage profile, improve the stability and effectively increases the efficiency of power system.
References
[1] P. Kundur, Power System Stability and Control, McGraw-Hill Inc., 1994.
[2] N. G. Hingorani and L. Gyugyi, “Understanding FACTS-concepts and technology of flexible AC transmission systems,” IEEE press, First Indian Edition, 2001.
[3] K. Kuthadi, N. Suresh, “Enhancement of Voltage Stability through Optimal Placement of Facts Controllers in Power Systems” American Journal of Sustainable Cities and Society, vol. 1,July 2012. [4] R. A. Schlueter, “A Voltage Stability Security
Assessment Method,” IEEE Trans. On Power Systems, Vol.13, No.4, Nov.1998, pp. 1423-1434.
[5] F. A. Althowibi and M.W.Mustafa, “Voltage Stability Calculations in Power Transmission Lines: Indications and Allocations,” IEEE International Conference on Power and Energy, Nov.2010, pp. 390-395.
[6] Shravana Musunuri, G.Dehnavi, “Comparison STATCOM, SVC, SSSC and TCSC devices for
voltage stability improvement.”North American Power Symposium (NAPS-2010), 26-28 Sept 2010
[7] Bhavin. M.Patel, “Enhancement of steady state voltage stability using SVC and TCSC” National Conference on Recent Trends in Engineering and Technology, BVM Engineering College, Gujarat, India,13-14 May 2011.
[8] C. A. Canlzares, Z. T. Faur, "Analysis SVC and TCSC Controllers in Voltage Collapse," IEEE Trans. Power Systems, Vol. 14, No. I, February 1999, pp. 158-165.
[9] P.Kessel and H.Glavitsch, “Estimating the Voltage Stability of a Power System” IEEE Transactions on Power Delivery, Vol. 1, No. 3, pp. 346–354, 1986 [10]Mehrdad Ahmad, Mostafa Alinezhad, “Comparison
of SVC and STATCOM in static voltage stability margin enhancement”, Proceedings of World Academy of Science, Engineering and Technology, Vol. 38, Feb. 2009.