MEMS for Glaucoma
Thesis by Jeffrey Chun-Hui Lin
In Partial Fulfillment of the Requirements for the degree of
Doctor of Philosophy
CALIFORNIA INSTITUTE OF TECHNOLOGY Pasadena, California
2012
© 2012
ACKNOWLEDGEMENTS
First, I would faithfully express my gratitude to my advisor, Prof. Yu-Chong Tai, who admitted me in 2005 to this fantastic Micromachining group at Caltech. Since I was a new Ph.D. graduate student at Caltech, Prof. Tai was an extremely good advisor to me during my years in the group. Prof. Tai is so knowledgeable that he could always foresee what I could not see in terms of the research, and therefore guide me on the right path to success. Every time when I felt frustrated about the experiments, he opened my eyes to the issues when I spoke to him, and I could always overcome the problems by incorporating his excellent ideas or advice. I always feel his enthusiasm about the research, and his optimistism and confidence encouraged me to complete every tough experiment repeatedly. Under Prof. Tai’s strict and complete trainings about the research, I started to understand something about this amazing MEMS world and make some working devices.
As I was a new international student, Dr. Tai became one of my best friends during my years at Caltech. In addition to academic research, Dr. Tai taught me a lot of important attitudes and necessary characteristics for me to lead a successful life in this new environment. I believe all the philosophy I have learned from him is as precious as the research results in the lab. It will accompany me and be my Holy Grail guiding me to success in my future life.
I would show my greatest appreciation to all my defense committee members, Prof. Joel Burdick, Prof. Changhui Yang, Prof. Azita Emami, and Prof. Hyuck Choo, for their instructive advice during my defense. I would especially like to thank Prof. Mark Humayun at Doheny Eye Institute at USC for his leading this wonderful glaucoma-management project. I was always stunned by his amazing skill in implanting devices. His clinical experiences always inspired me to improve the device designs. As a member of both the National Academy of Engineering and the Institute of Medicine, Prof. Humayun is a prodigy of learning and is an inspiring example for young academic researchers. His profound knowledge can always arouse the inventionof new medical devices and therefore it makes me aspire to achieve the same level of expertise all the time. I would also specially thank my collaborative workers at USC, Dr. Rohit Varma and Dr. Saloomeh Saati, for their assistance in the devices’ animal trials and useful suggestions in terms of the device design.
the fears of those who think they have to cease research due to equipement troubles. I would like to give thanks to our group administer, Christine Garske, for her kindly many aspects of the group, particularly for her big help in in managing group’s purchasing orders. Christine always keeps track of every purchase order, ensuring that they are on schedule so that students have never to worry about the delay of getting the materials. She is very thoughtful to every group member. As a result, everything is well-ordered and goes smoothly under her organization. Besides, I very much appreciate our previous group administrator, Agnes Tong, for her help during my first few years in the group.
to have worked and learned in one of the best MEMS research group worldwide and am extremely proud to be one of the group members among them.
I would like to express my great appreciation to my guitar teacher, Dr. Matthew Elgart, for instructing me in playing the classical guitar over the past few years. In addition to being a great performer, Matthew is also a very good teacher who has taught me from the start until now, and I can already perform some ensemble pieces. Matthew has always showed a lot of patience in explaining the music to me and helping me to choose the proper way to interpret it. It takes a lot of effort and different thoughts to crack every music piece and therefore playing a musical instrument actually helps me cultivate my concentration on lab work and perseverance on doing the research. Playing classical guitar enriches my life as a graduate student at Caltech and it is really a good stress reliever for the busy research life. Most importantly, Matthew’s instruction satisfies my desire for understanding the classical guitar and even classical music. Thank Matthew for taking me into such a beautiful and amazing classical guitar world. I believe the classical guitar will be one of my best companions in my life.
as Chinese New Year, Dragon Boat Festival, and Mid-Autumn Festival, etc. Those events always made me feel warm during these holidays and not alone outside Taiwan.
I am grateful to my parents for their constant support of my decisions, and always encouraging me to pursue the best during my student’s life. Their educating me as a person of integrity by setting themselves as examples, financially supporting me through my studies, and helping me make decisions all determine who I am now. I also feel so blessed for my parents-in-law’s kindness, particularly for their unreserved support for my marriage with their daughter. Finally, I owe my dear wife, Yi-Ying Tang, for her continuous support and encouragement to me through several years. Although separated by a long distance for many years, Yi-Ying’s tolerance and understanding has always been my firmest backbone giving me faith to proceed on and eventually fulfill the Ph.D. degree.
Finally yet importantly, I would like to thank my sweet Little-Turkey princess, Sharon Lin, who was born during my final last months of thesis writing period. My daughter’s coming to the world makes me feel the miracle of life. Sharon’s smile always cheers me up when I feel frustrated, and boosts me to work on my thesis and defense full steam ahead again.
ABSTRACT
MEMS for Glaucoma
Thesis by Jeffrey Chun-Hui Lin
Doctor of Philosophy in Electrical Engineering California Institute of Technology
Glaucoma is an eye disease that gradually steals vision. Open angle glaucoma is one of the most common glaucoma forms, in which eye fluid (aqueous humor) produced by the ciliary body cannot be drained away normally by patients’ eyes. The accumulated eye fluid inside the anterior chamber causes high intraocular pressure (IOP), which is transmitted onto the retina in the back of the eyeball (globe), continuously suppressing and damaging the patient’s optic nerves; this may lead to total blindness if not treated properly.
In this work, we have developed a telemetric IOP sensor that is capable of monitoring IOP wirelessly and continuously. As the quality factor drops when a telemetric IOP sensor is implanted in the anterior chamber, due to the high loss tangent of the saline-based aqueous humor (~ 0.2) compared to air (0.0), a modified IOP sensor is developed to monitor IOP with sensing coil that is left exposed after implantation in order to avoid interruption from the eye fluid. Another approach is also proposed and tested to demonstrate that the quality factor can also be recovered by covering the sensing coil with low loss tangent materials.
can be controlled by mechanical stretching or thermal annealing. The protecting mechanism preventing the unwanted drainage when the eyes experience sudden unpredicted high IOP is achieved by utilizing a normally open (NO) check-valve. A “minimally invasive implantation” procedure is proposed in the thesis to implant the GDD subconjunctivally. The small size of the device allows its insertion using a #19-gauge needle.
TABLE OF CONTENTS
ACKNOWLEDGEMENTS ... v
ABSTRACT ... xi
TABLE OF CONTENTS ... xv
LIST OF FIGURES ... xxiii
LIST OF TABLES ... xxxix
CHAPTER 1 INTRODUCTION ... 1
1.1INTRODUCTION TO GLAUCOMA ... 1
1.2CURRENT TREATMENT OF PRIMARY OPEN ANGLE GLAUCOMA ... 2
1.2.1 Medications for glaucoma... 2
1.2.2 Glaucoma filtration surgery ... 4
1.3GLAUCOMA DRAINAGE DEVICE ... 4
1.3.1 Active glaucoma drainage device ... 4
1.3.2 Passive glaucoma drainage device ... 5
1.3.2.1 History of the development of glaucoma drainage devices 6 1.3.2.2 Contemporary passive glaucoma drainage device ... 9
1.3.2.3 Glaucoma drainage devices with no resistance ... 10
1.3.2.4 Glaucoma drainage devices with resistance ... 12
1.3.2.5 Comparison of current “tube-and-plate”-type glaucoma drainage devices ... 13
1.3.2.7 Long-term failure of the GDD: Bleb fibrosis ... 17
1.3.3 Proposed glaucoma drainage device design ... 18
1.4INTRAOCULAR PRESSURE MONITORING ... 20
1.4.1 Current clinical IOP monitoring approaches ... 20
1.4.2 Wireless telemetric sensing technology ... 21
1.5BIOCOMPATIBLE MATERIAL,PARYLENE-C,USAGE ... 23
1.6CHARACTERISTICS OF PARYLENE-C ... 24
1.7SUMMARY ... 26
CHAPTER 2 PASSIVE NORAMLLY CLOSED MICRO CHECK-VALVES ... 29
2.1OVERVIEW ... 29
2.2THEORETICAL ANALYSIS OF NCMICRO CHECK-VALVES ... 32
2.2.1 Thin-film-flow theory of the check-valve... 32
2.2.2 Calculation of the necessary pre-stress force ... 35
2.3PRE-STRESSED SLANTED TETHER MICRO CHECK-VALVES ... 36
2.3.1 Slanted tether NC check-valve configuration ... 36
2.3.2 Thermal annealing pre-stressed NC check-valves ... 37
2.3.3 Sloped photoresist ... 38
2.3.3.1 One-time-exposure gray-scale photo-mask ... 38
2.3.3.2 Linearization of the sloped sacrificial photoresist ... 39
2.3.4 Fabrication ... 41
2.3.5 Device testing and discussion ... 44
2.4.1 Electrical-equivalent diode model ... 48
2.4.2 Multiple check-valve integration ... 48
2.4.3 Characterization results and discussion ... 51
2.5POP-UP MICRO CHECK-VALVE ... 52
2.5.1 Pop-up micro check-valve device design ... 53
2.5.2 Device fabrication ... 54
2.5.3 Device characterization setup ... 58
2.5.4 Device characterization results ... 60
2.6SELF-STICTION-BONDING MICRO NCCHECK-VALVES ... 62
2.6.1 Design concept of the self-stiction-bonding NC check-valve ... 62
2.6.2 Fabrication of the self-stiction-bonding NC check-valve ... 64
2.6.3 Characterization of the self-stiction-bonding NC check-valve ... 66
2.7BLISTER TEST OF STICTION OF PARYLENE-CFILM ... 68
2.7.1 Experimental approaches ... 69
2.7.2 Theory of blister test ... 71
2.7.3 Blister test experimental setup ... 72
2.7.4 Testing results and discussion ... 74
2.7.5 Summary ... 78
2.8SUMMARY AND CONCLUSION ... 79
2.8.1 Comparison of different types of micro check-valves ... 79
CHAPTER 3 INTEGRATION AND APPLICATIONS OF MICRO
CHECK-VALVES FOR GLAUCOMA TREATMENT ... 83
3.1CONFIGURATION OF THE “BAND PASS”FLOW-RATE PROFILE DUAL-VALVE GDDSYSTEM ... 85
3.1.1 Dual back-to-back valves design ... 86
3.1.2 Numerical simulation of the glaucoma drainage device ... 87
3.2DESIGN,FABRICATION, AND TEST OF THE NORMALLY OPEN VALVE... 88
3.2.1 Design of the NO valve... 88
3.2.2 Fabrication of the NO valve ... 90
3.2.3 Characterization of NO valve ... 91
3.3SUTURELESS,MINIMALLY INVASIVE IMPLANTATION OF THE DUAL-VALVED GDD ... 93
3.3.1 Dual-valved GDD out-shape... 94
3.3.2 Dual back-to-back valve configuration ... 94
3.3.3 Parylene-C protective tube carrier ... 95
3.3.4 Design and fabrication of the rollable/foldable parylene-C fixation anchors ... 96
3.3.5 Dual-valved glaucoma drainage device packaging ... 98
3.4VALVE-POSITION-ADJUSTABLE DUAL-VALVED GDD ... 99
3.4.1 Configuration of the valve-position-adjustable dual-valved GDD 101 3.4.2 Grooved check-valves ... 102
3.4.3 Grooved check-valve fabrication procedures ... 103
3.5BENCH-TOP GDDCHARACTERIZATION ... 106
3.5.1 Bench-Top GDD characterization setup ... 106
3.5.2 Bench-Top GDD characterization results ... 107
3.6GDDEX VIVO TEST AND DISCUSSION ... 109
3.6.1 GDD ex vivo implantation ... 110
3.6.2 Tapered hollow parylene-C protective tube mockup ex vivo implantation ... 111
3.7SUMMARY AND CONCLUSION ... 114
CHAPTER 4 HIGH-QUALITY-FACTOR PARYLENE-C-BASED INTRAOCULAR PRESSURE SENSOR ... 117
4.1OVERVIEW ... 117
4.2SENSING THEORY AND THE DEVICE DESIGN ... 125
4.2.1 Sensing scheme ... 125
4.2.2 Electrical and mechanical design of the device ... 126
4.3DEVICE FABRICATION AND CHARACTERIZATION ... 128
4.3.1 Device fabrication ... 128
4.3.2 Device characterization ... 129
4.4CHARACTERIZATION RESULTS AND DISCUSSIONS ... 131
4.5QUALITY FACTOR RECOVERY STUDY ... 134
4.5.1 Overview ... 134
4.5.2 Q factor recovery by passivation layers of different materials ... 135
4.5.3 Q factor recovery by parylene-C passivation layers ... 138
4.6SUMMARY AND CONCLUSION ... 142
CHAPTER 5 CHARACTERISTICS OF PARYLENE-C FILM ... 145
5.1OVERVIEW ... 145
5.2INTRODUCTION TO PARYLENE-CPOLYMERIZATION ... 146
5.3DENSIFICATION ... 147
5.3.1 Thickness-change measurement ... 149
5.3.2 In situ length-change measurement during thermal annealing ... 150
5.3.2.1 Length change under long-time thermal annealing process at 100°C ... 150
5.3.2.2 One cycle thermal annealing treatment ... 154
5.3.2.3 Cyclic thermal annealing treatment up to 120°C ... 155
5.3.3 Summary ... 158
5.4OXIDATION ... 159
5.4.1 XPS ... 160
5.4.2 FTIR ... 163
5.4.3 Summary and discussion... 167
5.5CRYSTALLIZATION ... 169
5.5.1 X-ray diffraction method ... 171
5.5.1.1 In situ consecutive XRD scanning at 100°C ... 171
5.5.1.2 In situ temperature ramping annealing study ... 177
5.5.2 Time constant of parylene-C annealed at 100°C ... 180
5.5.3 Effect of deposition pressure difference ... 182
5.6GLASS TRANSITION TEMPERATURE ... 186
5.6.1 Identification of glass transition temperature ... 188
5.6.1.1 Reported glass transition temperature of parylene-C... 188
5.6.1.2 Ramping-temperature-dependent modulus experiment .. 189
5.6.1.3 Dynamic mechanical analysis ... 193
5.6.2 Measuring results and discussion... 197
5.6.3 Summary ... 207
5.7UNIAXIAL TENSILE TEST ... 208
5.7.1 As-deposited parylene-C film ... 211
5.7.2 Deposition pressure influence ... 213
5.7.3 Oxidation effect ... 215
5.7.4 Annealing temperature and time influence ... 218
5.7.5 Effect of testing environmental temperature... 221
5.7.6 Summary ... 225
5.8RHEOLOGICAL PROPERTIES OF PARYLENE-CFILM ... 226
5.8.1 Creep of parylene-C ... 228
5.8.1.1 Creep overview ... 228
5.8.1.2 Introduction of the Burger’s model ... 229
5.8.1.3 Primary and secondary creep of parylene-C ... 232
5.8.1.4 Summary ... 256
5.8.2 As-deposited parylene-C creep study under a step temperature profile ... 258
LIST OF FIGURES
Figure 1-1: Molecular structure of parylene-C ... 23 Figure 2-1: Concept of the normally closed (NC) check-valve: (a) The check-valve is
closed when the applied pressure P is lower than the cracking pressure Pc; (b)
the check-valve is open when the applied pressure P is higher than the cracking pressure Pc. ... 30
Figure 2-2: Check-valve model for unsteady flow analysis: (a) side view, and (b) top view ... 32 Figure 2-3: Schematic of cracking-pressure-controlled parylene-C check-valve using the
residual tensile stress in parylene-C after thermal annealing ... 36 Figure 2-4: A closer view of designed gray-scale photo-mask for the creation of sloped
photoresist. The right pattern magnifies part of the pixel structure of the ring. ... 38 Figure 2-5: One-time-exposure gray-scale sacrificial photoresist profile: (a) before
linearization, and (b) after linearization ... 41 Figure 2-6: Fabrication procedures. Slanted sacrificial photoresist is achieved using a
one-time-exposure gray-scale photo-mask photolithography approach. ... 42 Figure 2-7: SEM pictures of fabricated check-valves: (a) check-valves before photoresist
Figure 2-8: Testing setup for MEMS micro check-valves ... 44 Figure 2-9: Parylene-C tether width effect of the characterization results of thermally pre-stressed slanted tether micro check-valves: different tether widths but with the same annealing temperature at 100°C ... 45 Figure 2-10: Temperature effect of the characterization results of thermally pre-stressed
slanted tether micro check-valves: different annealing temperatures but with the same tether widths of 50 µm ... 46 Figure 2-11: Equivalent electrical circuit component model of check-valves: (a) one-diode model of one check-valve. k and dz are the spring constant of the tethers and the covering plate displacement, respectively. (b) In-series diodes model of in-series check-valves ... 49 Figure 2-12: Valve packaging: (a) A single valve packaged in capillary tubes and (b) four
individual modules integrated using coupling tubes ... 50 Figure 2-13: (a) Modified device testing setup, (b) the characterization of single valve,
and (c) the characterization of four check-valves in series ... 50 Figure 2-14: (a) Flow characteristics of a single valve, (b) micrograph of a check-valve in
tube after testing, (c) flow characteristics of a four-check-valve assembly .. 52 Figure 2-15: The configuration of a pop-up check-valve. A close-up of the undercut
parylene-C foot is shown in the circular area. ... 54 Figure 2-16: Fabrication procedures of (a) the pop-up micro check-valve, and (b) the
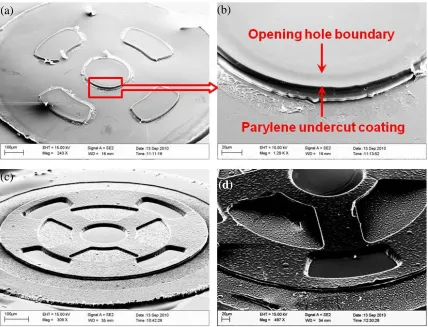
Figure 2-17: Micrograph of (a) 10 µm undercut of the LOR30B, (b) top view of the NC check-valve, (c) top view of the outlet orifice, and (d) final device appearance ... 57 Figure 2-18: SEM pictures of (a) undercut parylene-C foot coating (back side view), (b)
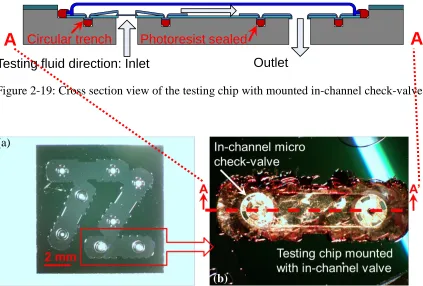
close view of undercut parylene-C foot coating, (d) normally closed check-valve, and (d) covering plate after pop-up ... 58 Figure 2-19: Cross section view of the testing chip with mounted in-channel check-valve ... 59 Figure 2-20: (a) Top view of the fabricated testing chip. (b) A close view of mounted
device on top of the testing chip, sealed with dried photoresist ... 59 Figure 2-21: Captured pictures of normally closed pop-up check-valve during popping-up
process (shown in arrow): (a) right before pop-up, (b) during pop-up, and (d) after pop-up. (Top parylene-C membrane is peeled off for clarity.) ... 61 Figure 2-22: Testing result of the pop-up check-valve ... 61 Figure 2-23: Schematics of the self-stiction-bonding NC check-valve ... 64 Figure 2-24: Fabrication procedures of the self-stiction-anchoring NC check-valve ... 65 Figure 2-25: Fabrication results of the self-stiction-anchoring NC check-valves: (a) SEM
Figure 2-27: Top view of finished parylene-C check-valves fabricated for blister test ... 69 Figure 2-28: Fabrication procedures for circular parylene-C check-valve with different
valve-seat surface treatments ... 70 Figure 2-29: Theoretical blister formation during experimentation: (a) The applied
pressure is less than or equal to the critical debonding pressure, Pc. (b) The applied pressure is higher than the critical debonding pressure, Pc; the parylene-C film starts to propagate. ... 71 Figure 2-30: Experimental setup of the blister test: (a) the cross-section view of the test
jig, and (b) schematic diagram of the testing setup ... 73 Figure 2-31: A typical curve of the blister test. The parylene-C film starts to debond
when the applied pressure is higher than the critical debonding pressure. .... 74 Figure 2-32: Stiction of parylene-C with different substrate surfaces after three kinds of
releasing processes. Blue: acetone soak followed by IPA and water soak. Green: acetone soak followed by HF dip and water rinse. Red: soaking in mixture of acetone and silicone oil followed by direct air drying ... 75 Figure 2-33: Hydrogen bonding that occurs between water molecules and the passivated
silicon surface. As the device dries, decreasing water content between the parylene-C film and the silicon pulls the two surfaces together through hydrogen bonding. ... 76 Figure 2-34: Stiction between parylene-C and various surfaces after releasing in a
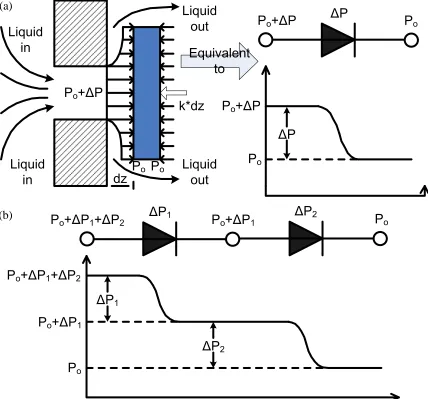
Figure 2-35: Stiction between the parylene-C and the silicon surface is reduced due to the silicone oil layer, which reduces surface passivation and the proximity between surfaces. ... 77 Figure 3-1: Concept of the “band pass” flow-rate profile of the proposed GDD system
comprising (a) an NC check-valve, and (b) an NO valve to achieve (c) a band pass flow-rate profile ... 85 Figure 3-2: The cross section of a normally open check-valve ... 88 Figure 3-3: COMSOL Multiphysics™ simulation of the dual-valved GDD system: (a)
deflection simulation of the NC check-valve, (b) flow-rate simulation results of the NC check-valve, (c) deflection simulation of the NO valve, (c) flow-rate simulation results of the NC check-valve, (e) flow-flow-rate simulation of the dual-valved GDD system, (f) flow-rate simulation results of the dual-valved GDD system ... 89 Figure 3-4: Fabrication procedures of the NO valve ... 90 Figure 3-5: Fabrication results of the NO valve: (a) top view of the NO valve, and (b)
SEM picture of the NO valve ... 91 Figure 3-6: Pressure/flow-rate profile characterization results of the NO valve ... 92 Figure 3-7: Concept of the minimally invasive implantation: (a) Subconjunctival
Figure 3-8: (a) Fabrication procedures of the parylene-C protective tube carrier, (b) coated 40 µm parylene-C on the sacrificial capillary glass tubing, (c) slanted and completed parylene-C protective tube carrier ... 95 Figure 3-9: Fabrication procedures of the parylene-C fixation anchors ... 98 Figure 3-10: Packaging procedures of the dual-valved GDD system: (a) NC check-valve;
(b) NO valve; (c) NC check-valve with stiction bonding enhanced by epoxy; (d) hollow parylene-C protective tube carrier; (e) one NC and one NO valve sealed in the parylene-C protective tube carrier (transparent glass tube used here for clarity); (f) anchors with trenches of 300 µm in radius, different anchor shapes designed to facilitate the surgical convenience, and future GDD fixation (left: ragged anchor; middle: foldable anchor; right: rollable squeeze-tail anchor); (g) completed assembled GDD in top view; (h) anchors can be rolled/folded for testing and implantation convenience. Check-valves are first sealed in the carrier, which is then assembled onto anchors. ... 100 Figure 3-11: Schematics of valve-in-tube system: (a) Combination of one NC valve and
one NO valve with a coupling tube to form the micro-flow regulating assembly. (b) Final finished valve-in-tube system ... 102 Figure 3-12: Cross section of the grooved self-stiction-bonding NC check-valve design ... 103 Figure 3-13: Modification of step 4 of the fabrication procedures of (a) NC check-valve
Figure 3-14: Micrographs of: (a) the fabrication result of an NC check-valve, (b) the top view of a NC check-valve packaged inside a coupling tube, (c) packaging results of the micro-flow regulating assembly, (d) the micro-flow regulating assembly packaged inside a tapered parylene-C protective tube carrier 610 µm in diameter, suitable for a #19-gauge hypodermic needle ... 104 Figure 3-15: The packaging procedures: (a) one check-valve attached to one end of the
coupling tube, (b) complete micro-flow regulating assembly, (c) final valve-in-tube system ... 105 Figure 3-16: Testing setup of the GDD: Photoresist is painted in the gap between GDD
and Teflon tubing for sealing. ... 107 Figure 3-17: Dual-valved GDD characterization results: The fluid starts to flow after 0.33
psi (~ 17 mmHg) and closes at 1.1 psi (~ 57 mmHg). Water was chosen as the working fluid. ... 108 Figure 3-18: Testing setup of GDD ex vivo implantation test ... 110 Figure 3-19: (a) The plunger in the needle introducer, (b) a GDD with folded zigzag type
parylene-C fixation anchor inserted into a #19-gauge hypodermic needle, (c) a hollow parylene-C tube subconjunctivally implanted into an enucleated porcine eye, (d) testing dye shunted into the hollow tube. The drained-out testing dye is visible. ... 111 Figure 3-20: Ex vivo implantation results of: (a) GDD 1 and (b) GDD 2. The testing dye
Figure 3-21: Inspection of the NC check-valve after ex vivo implantation: (a) right after the implantation, and (b) after one week of soaking in DI water ... 114 Figure 4-1: (a) Wireless sensing concept of implantable IOP sensor in the anterior
chamber, (b) the glass reader paradigm, (c) a real IOP sensor in vivo tested in a rabbit eye ... 120 Figure 4-2: The concept of the wireless inductive coupling link: The frequency shift is
registered through an external oil reader. ... 121 Figure 4-3: Resonant frequency shift corresponds to the applied pressure: (a) Frequency
decreases as the capacitance increases; (b) No frequency shift is observed when no pressure difference exists; (c) Frequency increases as the capacitance decreases. ... 122 Figure 4-4: The new IOP sensor design: (a) Top view of the sensing part, (b) AA’ cross-section view of the IOP sensor ... 122 Figure 4-5: The newly designed IOP sensor is implanted at the pars plana with the
implantation tube going through the choroid, while the sensing part still remains outside the choroid, but under the conjunctiva of the eye. ... 124 Figure 4-6: Fabrication procedures of the sensing part of the IOP sensor... 128 Figure 4-7: IOP sensor fabrication and assembling results: (a) Completed sensing part,
Figure 4-8: IOP sensor characterization setup: a 1.5-mm-diameter hand-wound coil served as the reader coil and a HP4195A network/spectrum analyzer was used to register the frequency shift of the phase dip. ... 131 Figure 4-9: Bench-top characterization results of the IOP sensor: the resonant frequency
was 379 MHz when the applied pressure difference was 0 mmHg, and shifted to higher frequency when the pressure difference increased. ... 132 Figure 4-10: Sensitivity analysis of the IOP sensor ... 133 Figure 4-11: The idea of covering the device with different passivation layers: glass cover
slip, photoresist, or epoxy. The IOP sensor is shown in gray in the figure. 135 Figure 4-12: IOP sensors covered by two different materials with low loss tangent: (a)
photoresist and (b) epoxy ... 136 Figure 4-13: The idea of covering the device with several layers of parylene-C sheets.
The IOP sensor is shown in gray in the figure. ... 139 Figure 4-14: Quality factor recovering results versus parylene-C thickness by covering
the IOP sensor with several parylene-C layers ... 140 Figure 4-15: Modified sensing coil fabrication procedures: After 30 µm parylene-C layer
is deposited on top of the capacitor metal plate, an extra oxygen plasma etching process is executed to thin down the central parylene-C to retain the capacitor sensitivity. ... 142 Figure 5-1: Measured thickness of 20 µm parylene-C film annealed at 100°C in the
Figure 5-2: (a) Obtained length change of the parylene-C film annealed at 100°C in air for 8 hours, and (b) a closer view of the length change during the first 2.5 minutes ... 152 Figure 5-3: Length change of the parylene-C film which was annealed at 100°C in air for
8 hours in the previous test. The sample was annealed again at 100°C for another 2 hours. ... 153 Figure 5-4: Length change of parylene-C film annealed under the temperature ramping
rate at 3.33°C/min and its hypothesized phenomenon interpretation by dominant effect ... 155 Figure 5-5: Six cycles of thermal annealing of parylene-C film up to 120°C: The length
of the film never goes back to its original length after the first-time thermal annealing. ... 157 Figure 5-6: The parylene-C film behaves differently after the first-time thermal
annealing. ... 157 Figure 5-7: The oxidative species of parylene-C proposed by Nowlin [189] ... 160 Figure 5-8: Typical XPS results of parylene-C samples. Top left: A closer view of the
peak of 531.6 eV representing the content of oxygen ... 161 Figure 5-9: Comparison of two XPS results of parylene-C annealed at 200°C for two
Figure 5-12: Comparison of the FTIR results of parylene-C annealed at 200°C in air and vacuum, all for two days ... 167 Figure 5-13: Typical XRD scanning results showing curve from 10°–30°C ... 172 Figure 5-14: XRD results of in situ XRD measurement of parylene-C consecutively
annealed at 100°C in helium ... 174 Figure 5-15: Crystallite size growing history of parylene-C annealed at 100°C in helium ... 176 Figure 5-16: XRD results of parylene-C annealed at 30°, 37°, 40°, and 50°C ... 178 Figure 5-17: XRD results of in situ XRD measurement of parylene-C consecutively
annealed at different temperatures in helium. Temperature ramping rate = 3°C/min. ... 179 Figure 5-18: Crystallite size growing history of parylene-C annealed at different
temperatures in helium ... 180 Figure 5-19: The crystallite size versus the annealing time ... 181 Figure 5-20: Comparison of the results of XRD measurement of parylene-C deposited at
22 mT and 35 mT ... 184 Figure 5-21: Elastic modulus response versus temperature change ... 186 Figure 5-22: Concept of the ramping-temperature-dependent modulus experiment. Every
peak represents one uniaxial tensile test. ... 190 Figure 5-23: Elastic (Young’s) modulus versus temperature curve. The transition region
Figure 5-24: The concept of dynamic analytical analysis. (a) A sinusoidal oscillatory stress is applied and the material’s sinusoidal strain response with a phase delay (viscoelastic materials) is measured. (b) The relationship of complex modulus (E*), the storage modulus (E’), and the loss modulus (E”) ... 194 Figure 5-25: A typical DMA testing curve showing the results of storage modulus, loss
modulus, and tan delta. Every curve has its corresponding definition to identify Tg. ... 195 Figure 5-26: A comparison of the results of the ramping-temperature-dependent modulus
experiment and the DMA test. Parylene-C sample was annealed at 100°C for one day in vacuum. Tg is found at the inflection point of each glass transition region. ... 197 Figure 5-27: Measured Tg of four parylene-C annealed in different conditions: 3 samples
at 100°C, with as-deposited parylene-C as a comparison ... 201 Figure 5-28: Measured Tg of parylene-C samples all annealed in 100°C but for different
times: 30 sec, 1 min, 3 min, and 30 min ... 202 Figure 5-29: Measured Tg of four parylene-C samples annealed in different temperatures ... 202 Figure 5-30: Measured Tg of seven parylene-C samples annealed in different
temperatures. Samples were annealed in the DMA Q800 chamber for 30 min prior to the Tg test. ... 203 Figure 5-31: Typical as-deposited parylene-C film uniaxial tensile test results obtained by
final correct calculated parameters. All terminologies follow the definition of the ASTM standard D882-09 and D638-08 [233, 234]. ... 210 Figure 5-32: Comparison of parylene-C film deposited at different pressures. (a) Two
stress-strain curves. (b) A closer view of elastic modulus and yield point . 215 Figure 5-33: Comparison of uniaxial tensile test results of parylene-C film with three
different treatments: as-deposited, 1 day annealed at 100°C in air, and 1 day annealed in vacuum ... 216 Figure 5-34: Comparison of uniaxial tensile test results of parylene-C film with six
different treatments ... 218 Figure 5-35: A closer view of Figure 5-34 (strain lower than 10%) ... 219 Figure 5-36: A series of uniaxial tensile tests of parylene-C performed at different
environmental temperatures ... 223 Figure 5-37: A closer view of Figure 5-36 (strain lower than 5%) ... 223 Figure 5-38: A comparison of elastic modulus measured by DMA (as-deposited curve in
Figure 5-27 in 5.6) and obtained from Table 5-13 ... 224 Figure 5-39: Creep behavior of polymers: (a) constant applied stress during creep test at
a constant temperature; (b) total strain versus time; (c) removal of the stress at the beginning of the creep recovery test; (d) recovery strain curve ... 229 Figure 5-40: Schematic diagram of the Burger’s model ... 230 Figure 5-41 (a): Creep results of the as-deposited parylene-C deposited at 22 mTorr
Figure 5-42 (a): Creep results of the as-deposited parylene-C deposited at 35 mTorr (Tg=55.1°C); (b): Stress relaxation results of the as-deposited parylene-C deposited at 35 mTorr (Tg=55.1°C) ... 242 Figure 5-43 (a): Creep results of the parylene-C annealed at 100°C for 30 minutes in the
convection oven (Tg=108.2°C); (b): Stress relaxation results of the parylene-C annealed at 100°C for 30 minutes in the convection oven (Tg=108.2°C) 244 Figure 5-44 (a): Creep results of the parylene-C annealed at 100°C for 1 day in the
convection oven (Tg=111.8°C); (b): Stress relaxation results of the parylene-C annealed at 100°C for 1 day in the convection oven (Tg=111.8°C) ... 246 Figure 5-45 (a): Creep results of the parylene-C annealed at 100°C for 1 day in the
vacuum oven (Tg=113.1°C); (b): Stress relaxation results of the parylene-C annealed at 100°C for 1 day in the vacuum oven (Tg=113.1°C) ... 248 Figure 5-46 (a): Creep results of the parylene-C annealed at 100°C for 2 days in the
vacuum oven (Tg=115.2°C); (b): Stress relaxation results of the parylene-C annealed at 100°C for 2 days in the vacuum oven (Tg=115.2°C) ... 250 Figure 5-47 (a): Creep results of the parylene-C annealed at 200°C for 1 day in the
vacuum oven (Tg>200°C); (b): Stress relaxation results of the parylene-C annealed at 200°C for 1 day in the vacuum oven (Tg>200°C) ... 252 Figure 5-48 (a): Creep results of the parylene-C annealed at 200°C for 2 days in the
Figure 5-49: The testing setup of parylene-C creep with Heaviside temperature profile: (a) convection oven setup with a video recording apparatus, (b) parylene-C sample mounting configuration in the convection oven ... 258 Figure 5-50: Typical capture photos of the parylene-C creep test (as-deposited parylene-C
tested at 120°C) after (a) 20 sec, (b) 60 sec, (c) 5 minutes, and (d) 60 minutes. (Numbers shown on the measuring ruler represent centimeters.) ... 259 Figure 5-51: Creep results of as-deposited parylene-C performed at 80ºC, 100ºC, 120ºC,
and 150ºC with a Heaviside temperature profile ... 261 Figure 5-52: Creep results of parylene-C pre-annealed at 100ºC in the air, performed at
80ºC, 100ºC, 120ºC, and 150ºC with a Heaviside temperature profile ... 263 Figure 5-53: Creep results of parylene-C pre-annealed at 100ºC in the vacuum, performed
at 80ºC, 100ºC, 120ºC, and 150ºC with a Heaviside temperature profile ... 264 Figure 5-54: The stress relaxation test of polymers: (a) constant applied strain during the
stress relaxation test at a constant temperature, (b) the corresponding stress output versus time ... 265 Figure 5-55: The results of constant strain-rate tests ... 277 Figure 5-56: The results of cyclic loading/unloading tests ... 278 Figure 5-57: The results from the abrupt strain-rate change tests ... 278 Figure 5-58: The results of creep tests of parylene-C film under different loading stresses:
Theoretical Burger’s model shows good fitting for the applied stress less than 30 MPa. ... 279 Figure 5-59: The results of stress relaxation tests. Stress relaxation is observed for all the
LIST OF TABLES
Table 1-1: Some current typical glaucoma medications and their corresponding possible side effects ... 3 Table 1-2: History of glaucoma drainage device development [12] ... 8 Table 1-3: Contemporary glaucoma drainage devices (GDDs) [12, 20] ... 9 Table 1-4: A comparison of some of current commercially available “tube-and-plate”-type glaucoma drainage devices (GDDs) [12, 20] ... 14 Table 1-5: Literature review of glaucoma drainage devices (GDDs) (1969–2002) [19, 20,
73, 74] ... 16 Table 2-1: Measured cracking pressures of four single check-valves and the assemblies of
multiple check-valves ... 51 Table 2-2: Cracking pressure of parylene check-valves under different releasing
procedures: (1) acetone and IPA soak followed by air drying, (2) HF dip, water rinse, followed by air drying, (3) soak in a mixture of acetone and silicone oil before air drying. Zero stiction means that the stiction is too small to be measured effectively. ... 76 Table 2-3: Comparison of different slanted tether parylene-C NC check-valves introduced
in this chapter. Water was used as the working fluid. ... 80 Table 3-1: Cracking pressures of two GDD systems obtained from in vitro and ex vivo
Table 5-1: Table of thermal coefficients of expansions obtained in different states of the parylene-C film. The literature values are also listed for comparison. ... 153 Table 5-2: Derived TCEs from six cycles shown in Figure 5-5 and Figure 5-6 ... 158 Table 5-3: Measured atom percentage of chlorine, carbon, and oxygen for different
oxidative parylene-C films ... 162 Table 5-4: Measured initial (after 1 hour oxidation) oxygen uptake rate for parylene-C by
Nowlin [189] ... 168 Table 5-5: A list of calculated parameters using the in situ XRD measurement results of
parylene-C consecutively annealed at 100°C in helium ... 176 Table 5-6: A list of calculated parameters based on the in situ XRD measurement of
parylene-C consecutively annealed at different temperatures in helium ... 179 Table 5-7: The lists of the parameters of the crystallization of parylene-C individually
annealed at 100°C for different annealing times ... 182 Table 5-8: XRD results of two as-deposited parylene-C films deposited at 22 mTorr and
35 mTorr, respectively ... 183 Table 5-9: Some of the previous published parylene-C Tg characterizing results ... 189 Table 5-10: Measured elastic modulus and temperature range of glassy, transition, and
Table 5-14: Burger’s model curve fitting results of the creep and stress relaxation behaviors of as-deposited parylene-C deposited at 22 mTorr (Tg=53.4°C) 241 Table 5-15: Burger’s model curve fitting results of the creep and stress relaxation
behaviors of as-deposited parylene-C deposited at 35 mTorr (Tg=55.1°C) 243 Table 5-16: Burger’s model curve fitting results of the creep and stress relaxation
behaviors of parylene-C annealed at 100°C for 30 minutes in the convection oven (Tg=108.2°C) ... 245 Table 5-17: Burger’s model curve fitting results of the creep and stress relaxation
behaviors of the parylene-C annealed at 100°C for 1 day in the convection oven (Tg=111.8°C) ... 247 Table 5-18: Burger’s model curve fitting results of the creep and stress relaxation
behaviors of the parylene-C annealed at 100°C for 1 day in the vacuum oven (Tg=113.1°C) ... 249 Table 5-19: Burger’s model curve fitting results of the creep and stress relaxation
behaviors of the parylene-C annealed at 100°C for 2 days in the vacuum oven (Tg=115.2°C) ... 251 Table 5-20: Burger’s model curve fitting results of the creep and stress relaxation
behaviors of the parylene-C annealed at 200°C for 1 day in the vacuum oven (Tg>200°C) ... 253 Table 5-21: Burger’s model curve fitting results of the creep and stress relaxation
Table 5-22: Time constant of as-deposited parylene-C samples tested at different temperatures ... 262 Table 5-23: Parameters of Burger’s model for creep. At 40 MPa, the sample breaks and
CHAPTER 1
INTRODUCTION
1.1
Introduction to Glaucoma
Aqueous humor is the fluid that is generated by eye’s ciliary body. The production rate of the aqueous humor is about 2–3 µL/min and has a turnover time of 1.5–2 hours [1]. The aqueous humor consists of 99.1% water [2]. The generated aqueous humor flows from the posterior chamber, through the pupil, and then goes into the anterior chamber. It is believed that the function of the aqueous humor is to nourish the eye tissues around the anterior chamber. The aqueous humor is drained out from the trabecular meshwork into the channel of Schlemm, and eventually leads the fluid through the sclera into the venous system. As the aqueous humor stays in the anterior chamber for 1.5–2 hours, it manifests the normal average intraocular pressure (IOP) as 16 mmHg above the atmosphere pressure with standard deviation of 2.5 mmHg [1].
damage the patient’s optic nerves—causing visual field loss and eventual blindness if not treated sufficiently.
It is estimated that 60.5 million people worldwide have glaucoma in 2010, most of which is associated with abnormally high intraocular pressure [4], and the number may increase to almost 80 million by 2020 [5]. Statistics show that glaucoma is the second leading cause of blindness in the world (World Health Organization [6]). In the United States, it is also estimated that 2.2 million Americans have glaucoma but only half of them are aware of it, because glaucoma has virtually no symptoms. Glaucoma causes blindness in approximately 120,000 Americans, accounting for 9%–12% of all blindness in the United States. Glaucoma is five times more common in people of African-American descent than in Caucasians, and is the leading cause of blindness among African Americans. Unfortunately, 10% of glaucoma patients who receive proper treatment still experience loss of vision [6].
1.2
Current Treatment of Primary Open Angle Glaucoma
Current major clinical treatment of glaucoma includes traditional medication and glaucoma filtration surgery (GFS).
1.2.1 Medications for glaucoma
treatment may also come with compliance issues: this type of medication requires patients to take eye drops regularly (every morning and evening), making it inconvenient and easily forgotten over continuous treatment. In addition, the medication may gradually lose its effect over a period of time, and hence some glaucoma patients may become resistant to all medications, called “refractory glaucoma” [7]. Refractory glaucoma is more stubborn and difficult to treat, and therefore some alternate approaches which physically drain away the aqueous humor are considered to treat these patients. Apart from the reasons mentioned above causing refractory glaucoma, problems with inefficient dosage style or glaucoma patients’ allergic response to the drug composition also stimulate more research on alternative glaucoma treatments.
Table 1-1: Some current typical glaucoma medications and their corresponding possible side effects
Medication name Working mechanism Possible side effects
Timolol Reduces aqueous humor production rate
Cardiac arrhythmias; Bronchospasm[8] Travoprost
(Travatan Z)
A prostaglandin that increases aqueous humor outflow rate
Blurred vision; Eyelid redness[9] Latanoprost
(Xalatan)
A prostaglandin that increases aqueous humor outflow rate
Blurred vision; Eyelid redness[10]
Pilocarpine Increases aqueous humor outflow rate
1.2.2 Glaucoma filtration surgery
Glaucoma filtration surgery (GFS) is an alternative glaucoma treatment which has been shown more effective at preventing glaucoma progression than other primary treatments in open-angle glaucoma [12]. Trabeculectomy, one of the most commonly used GFS, removes part of a patient’s trabecular meshwork around the iris to create a pathway to improve the extraocular drainage of aqueous humor [2]. However, the biggest drawback of the surgery is that the incisions might heal after a period of time, and therefore repeated surgery is likely required. In addition, removing the trabecular meshwork leaves the IOP uncontrollable. The aqueous humor can flow away easily without any flow resistance and hence lead to hypotony—when IOP is lower than 5 mmHg. Ocular hypotony can lead to corneal decompensation or a flat anterior chamber with subsequent choroidal detachment or cataract formation [13].
1.3
Glaucoma Drainage Device
In order to have a reliable alternative in addressing those issues, a glaucoma drainage device (GDD)—with the intent of physically draining the excessive aqueous humor through the artificial drainage path so as to reduce the associated IOP—has been a persistent research goal. The drained-out excessive aqueous humor is redirected into a subconjunctival chamber, called a bleb [14]. The drained-out aqueous humor will be eventually absorbed by the human circulation system.
1.3.1 Active glaucoma drainage device
membrane micro valve actuated by electrolyzing the electrolyte underneath the micro valve. Besides the actuating system, the whole active eye-fluid regulating system also includes the pressure sensor, feedback control system, and an inductive coupling coil behaving as the power transmission system. In 2001, Bae also proposed another type of active glaucoma drainage device using a membrane micro valve similar to Neagu’s [15– 18]. Rather than being driven by electrochemical actuator, Bae’s membrane micro valve is driven by an electromagnetical actuator. Bae’s in vitro/vivo experiments demonstrated the device’s capability to regulate fluid pressure to the desired pressure settings with the help of a proper feedback control system.
The advantage of the active GDD system is that it can control the flow-rate and the IOP according to the requirements of different patients. However, there are many disadvantages to this device. For example, power transmission is always one of the main concerns of the active devices. In addition, the necessity and the combination of actuating system, feedback control system, and the power transmission system makes the active GDD system much more complicated than passive GDD to fabricate, integrate, and implant. The conducting metal and the actuator used in the GDD usually come with a biocompatibility issue. Therefore, a passivation layer is normally needed to cover active devices, and the influence of those embedded electronic circuits on the human body is still unknown.
1.3.2 Passive glaucoma drainage device
regulate the IOP within a normal pressure range (1020 mmHg), responding to different IOP situations. The material used must be biocompatible, to reduce the inflammatory response and prevent rejection of the device. The proposed GDD must also be easy to manufacture and surgically implant into the eye. The history and the development of the passive GDD will first be introduced in the following few sections.
1.3.2.1History of the development of glaucoma drainage devices
The history of the development of the glaucoma drainage devices until 1997 is shown in Table 1-2. The earliest attempt at implanting a GDD can be dated back to 1907. Rollet first proposed the idea of implanting a horse-hair thread connecting anterior chamber to the subconjuctival space, trying to drain out the excess eye fluid [12, 19, 20]. Subsequently, other people tried many different kinds of materials, such as silk [21], gold [22], tantalum [23], glass rod [24], platinum [25], and polythene tube [26]. These previous hollow tubes were not successful because of bio-incompatibility and migration of the implants. In addition, the hollow tube, with neither threshold pressure constraint nor high-pressure protecting mechanism, causes excess fluid to leak out of the eye and leads to hypotony.
Molteno proposed a revised version of his previous GDD by placing the thin plate farther from the cornea with a longer acrylic tube to gain a higher success rate [29]. Although the Molteno GDD has no resistance valve embedded, the Molteno GDD utilized the deflection of the conjunctival layer to control the aqueous flow-rate and the final IOP.
With the higher success rate of the Molteno GDD, the tube-and-plate structure had become one of the benchmarks of GDD design. Since then, two major concepts have also been adopted for the GDD developments:
1. Built-in resistance, usually fulfilled by introducing a valve within the GDD, is introduced to GDD design to reduce postoperative hypotony. For example, in 1976, Krupin introduced the GDD with a slit valve to prevent early, postoperative hypotony [30]. The slit valve was designed to open at a pressure of 11 mmHg and close at a pressure of 9 mmHg. In 1993, Ahmed introduced a GDD with a valve utilizing Venturi’s effect to reduce the friction within the valve system and help drain away the aqueous humor [31–34]. The Ahmed glaucoma valve (AGV) is designed to open at a pressure of 8 mmHg.
Table 1-2: History of glaucoma drainage device development [12]
Year Investigator Type Material Method Flow control Drainage site
1907 Rollet [43] seton Horse hair Paracentesis None Anterior subconjunctival 1912 Zorab [21] seton Silk thread Translimbal None Anterior subconjunctival 1925 Stefansson [22] seton/tube Gold Translimbal None Anterior subconjunctival 1934 Row [44] seton Platinum Cyclodialysis None Suprachoroidal
1940 Troncoso [23, 45]
seton Magnesium Cyclodialysis None Suprachoroidal
1942 Gibson [46] tube Lacrimal canaliculus
Transcleral None Anterior subconjunctival
1949 Bick [47] seton/tube Tantalum Cyclodialysis None Suprachoroidal
1951 Muldoon [25] seton Platinum Translimbal None Anterior subconjunctival 1952 Losche [48] tube Supramid Cyclodialysis None Suprachoroidal
1955 Bietti [49] tube Polyethylene Cyclodialysis None Suprachoroidal
1958 La Rocca [50] Polyvinyl Translimbal None Anterior subconjunctival 1960 Ellis [51] tube Silicone Translimbal None Anterior subconjunctival 1967 Mascati [52] tube Plastic Translimbal None Lacrimal sac
1969 Molteno [27] tube-and-plate Acrylic Translimbal None Anterior subconjunctival 1974 Lee [53] tube Collagen Translimbal None Vortex vein
1976 Krupin [30] tube Silicone and supramid
Translimbal Slit valve Anterior subconjunctival
1979 Honrubia [54] tube Silicone Translimbal None Anterior subconjunctival 1982 Schocket [55] tube and band Silicone Translimbal None Posterior subconjunctival 1985 White [56] tube-and-plate Silicone Silicone Valve and
pump
Posterior subconjunctival
1986 Joseph [57] tube and band Silicone Translimbal Slit valve Posterior subconjunctival 1990 Krupin [58] tube-and-plate Silicone Translimbal Slit valve Posterior subconjunctival 1990 Baerveldt [59] tube-and-plate Silicone Translimbal None Posterior subconjunctival 1993 Ahmed [32] tube-and-plate Silicone and
polypropylene
Translimbal Venturi valve Posterior subconjunctival
1995 OptiMed [60] tube-and-plate Silicone and PMMA
Translimbal Microtubules Posterior subconjunctival
1995 Smith [61] seton Hydrogel Translimbal None Intrascleral 1996 Pandya [62] tube-and-plate Silicone and
hydroxylapatite
Translimbal None Posterior subconjunctival
1997 Glovinsky and Belkin [63]
tube Stainless steel Translimbal None Anterior subconjunctival
1997 Helies [64] artificial meshwork
1.3.2.2Contemporary passive glaucoma drainage device
Table 1-3 summarizes some of the current glaucoma drainage devices. The first category shows the commonly used tube-and-plate GDD design, which has dominated the GDD market since 1969. This type has an end plate located underneath the conjunctiva layer acting as the base for the bleb to form.
Table 1-3: Contemporary glaucoma drainage devices (GDDs) [12, 20]
Design Drainage location Commercial available examples Tube-and-plate GDD 7–10 mm from limbus Molteno, Baerveldt, Ahmed,
Krupin, Optimed Translimbal GDD At the limbus Ex-PRESS shunt Trabecular bypass devices Channel of Schlemm GMP Eye pass,
Glaukos trabecular bypass shunt Trabecular bypass devices Suprachoroidal space SOLX system
The second type is translimbally implanted and drains the aqueous humor to the subconjunctiva. The most recently introduced GDD is EX-PRESS, made of stainless steel. The implantation concept of this type GDD resembles the concept of trabeculectomy surgery.
The third type involves implanting the GDD in such a way as to mimic the function of the trabecular meshwork, which helps drain away the aqueous humor through the channel of Schlemm. The GMP eye pass and Glaukos trabecular bypass shunt are examples of this type of GDD.
1.3.2.3Glaucoma drainage devices with no resistance
Seen in Table 1-3, Molteno and Baerveldt are tube-and-plate GDDs with no resistance designed. This type of GDD has an end plate implanted underneath the conjunctival layer, which turns into the controlling membrane of the implants.
As for the translimbal GDD, Ex-PRESS shunt has no resistance designed as well. However, the small diameter (50 µm [20]) makes it still possible to have a pressure drop of 4.78 mmHg within in the tube while draining out the aqueous humor.
For the trabecular bypass type GDD, GMP Eye pass, and Glaukos trabecular bypass shunt are designed with no resistance incorporated. The main reason is likely due to the fact that their small tube sizes have already provided a certain amount of pressure resistance for the drainage devices. Because a proper flow resistance designed in the GDD system is required to prevent postoperative hypotony, the contemporary GDD usually comes with a mechanism designed to regulate the flow-rate and the IOP. To estimate the required flow resistance of the entire GDD, the flow resistance of a hollow tube is introduced in the following section.
1.3.2.3.1Flow resistance of a hollow tube
The flow resistance is defined according to the relationship between the pressure drops versus the flow-rate. Assume that the volume flow-rate, Φ, is proportional to the pressure difference, Δp, then the relation can be expressed in a simple form as [65]:
∆𝑝=𝑅 ∙ Φ, (1-1)
∆𝑝=128𝜋𝑑𝜇𝑙4 Φ, (1-2)
where μ is the viscosity of the fluid, l is the tube length, d is the tube diameter.
Therefore, the flow resistance of a circular hollow tube can be found as:
𝑅 =128𝜋𝑑𝜇𝑙4 . (1-3)
The Reynolds number, Re, is used to identify whether the flow is a laminar flow. For a laminar flow, Re must be less than 2300. The Reynolds number is represented as:
𝑅𝑒 =𝜌𝑣̅𝑑𝜇 , (1-4)
where ρ is the fluid density, and 𝑣̅ is the average velocity of the fluid, which can be calculated by
𝑣̅=𝜋𝑑4Φ2. (1-5)
pressure drop of the Ex-PRESS shunt. Because the length of the Ex-PRESS shunt is reported as 2.96x10⁻³ m [20], the pressure drop can be found as 636.77 Pa = 4.78 mmHg.
If the inner diameter of the Baerveldt and Molteno GDD shown in Table 1-4 as 0.635x10⁻³ m is considered, the length of the silicone tube is taken as 1x10⁻² m, as shown in Table 1-3, the Reynolds number is obtained as 0.066, and the pressure drop is calculated as 0.0827 Pa=6.2x10⁻⁴ mmHg, which is relatively too small for practical GDD to use.
1.3.2.4Glaucoma drainage devices with resistance
1.3.2.5Comparison of current “tube-and-plate”-type glaucoma drainage devices
As the current dominant benchmark in the GDD development market, tube-and-plate structure are explored more and discussed at length in this section.
1.3.2.5.1End plate size comparison
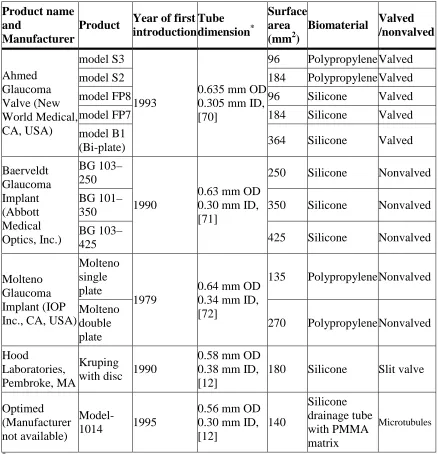
Table 1-4 shows the comparison of some geometry factors of the tube-and-plate. The GDD developers had been focusing on increasing the size of the end plates, as larger end plate size was believed to have more effective IOP regulating capabilities. However, the long-term implantation follow-up shows that there is no statistical difference between the surface areas ranging from 130 mm2 (Molteno single plate) to 350 mm2 (Baerveldt) among all different GDDs [19, 68, 69].
IOP regulating capabilities to a certain point. However, the effect is not linear proportional and also not the overall success rate of the operation.
Table 1-4: A comparison of some of current commercially available “tube-and-plate”-type glaucoma drainage devices (GDDs) [12, 20]
Product name and
Manufacturer
Product Year of first introduction
model S2 184 Polypropylene Valved
model FP8 96 Silicone Valved
model FP7 184 Silicone Valved
model B1
(Bi-plate) 364 Silicone Valved
Baerveldt
250 Silicone Nonvalved BG 101–
1.3.2.5.2Results of clinic trials comparison
Table 1-5 lists the results of five different GDDs’ clinical trials summarizing from systematic literature reviews. The Pearson chi-square test was used to compare the incidence of surgical outcomes and complications among the GDDs. P value shown in Table 1-5 represents the paired t-test, which indicates how significantly different within a variable among the five GDDs. A two-tailed p < 0.05 was considered with statistically significant difference. As can be seen from the table, there is no statistically significant difference in the postoperative follow-up time among the five GDDs. The pre-op IOP shows a statistically significant difference as the pre-op IOP of Molteno with no modification shows a higher value. The post-op IOP and % change in IOP, which both can be deemed as the regulating capabilities of the GDD, show no statistically significant differences and therefore it implies that these five GDDs have very similar regulating capabilities. This is verified by the p-value of the surgical success as 0.94. As shown, all five GDD can lower IOP within the normal pressure range with successful rate between 72–79%.
Table 1-5: Literature review of glaucoma drainage devices (GDDs) (1969–2002) [19, 20,
Mean follow-up (Months) 23.1±10.8 27.1±14.2 18.6±7.8 16.0±7.5 21.3±11.2 0.72 Pre-op IOP, mmHg 42.1±2.1 34.1±4.8 30.8±4.2 33.9±4.5 36.3±1.5 0.02*
Pre-op IOP was significantly higher in “Molteno with no modification” group **
Diplopia rate was significantly higher in Baerveldt group compared to Molteno and Ahmed glaucoma valve groups.
1.3.2.6Postoperative complications of current glaucoma drainage devices
Table 1-5 reveals that these five GDDs can all successfully regulate the IOP and possibly treat the refractory glaucoma. However, several complications are generally found with GDDs.
1.3.2.6.1Hypotony
of these two GDDs does not show any impressive hypotony improvement as claimed by the manufacturers. It is likely due to the insertion site of the GDD’s silicone tube that aqueous humor might leak through before the incision heals, causing the early hypotony. As for the nonvalved Molteno GDD, it clearly shows that the modified Molteno GDD has a better performance in terms of the early transient hypotony.
1.3.2.6.2Diplopia
It is found from Table 1-5 that the occurrence of diplopia of Baerveldt is higher than the rest four GDDs. It is likely due to its special design that the device is implanted underneath the recti muscles. It is suggested that diplopia may be related to the height of the bleb or due to the adhesions to the recti muscles as the Baerveldt end plate is inserted under the muscle belly [40]. The problem is suggested to be solved by modifying the end plate such as fenestrating the end plate. However, the there is still no quantitative reports regarding this improvement yet [75].
In addition, it is also reported that up to 30% of the patients receiving GDD implantation surgery might have corneal decompensation [19]. The complexity of these complications proves the difficulties of developing a final successful glaucoma drainage device.
1.3.2.7Long-term failure of the GDD: Bleb fibrosis
The fibrosis is believed to happen due to the introduction of outside biomaterials such as the end plate of the GDD which could cause a fibrovascular response in the subconjunctival space [19]. In addition, the introduction of the aqueous humor into the subconjunctival space can stimulate fibrovascular proliferation in the episcleral tissue as well [26]. The intensity of the fibrous reaction may vary with respect to several factors such as the biomaterial, size, and/or design of the end plate and the individual patient’s immune reaction to the operation, the GDD itself, and the presence of aqueous humor in the subconjunctival space, and also some factors that have not been understood.
Several suggestions are proposed to overcome the fibrosis problem. First of all, GDD made of more biocompatible material to reduce inflammation around the end plate, resulting in less scar tissue formation and promote longer GDD lifetime. The inert biomaterial should not attract fibroblast or protein deposits as well, which in turn could lead to cytokine release, chronic low-grade inflammation, and bleb failure [19]. The rigidity, flexibility, and shape design of the end plate is also believed to influence the fibrosis occurrence. The rigid plates might exhibit less to-and-fro micro motion with ocular movement leading to less chronic inflammation.
It is reported that the bleb fibrosis following the trebeculectomy operation can be successfully alleviated by medications such as mitomycin C and 5-fluorouracil. However, the effect of these medications on GDD implantation is still under debate and more clinical trials need to be done to get a clear picture.
1.3.3 Proposed glaucoma drainage device design
1. There must be a micro valve designed in the GDD to provide the necessary resistance to regulate the IOP in a proper range. It is desirable to have a device to regulate the IOP to be in the range of 10–20 mmHg.
2. The biomaterial of the GDD must be totally inert so as to reduce the occurrence of the inflammation and the fibrosis reactions.
3. The GDD needs to have a reliable fixation anchor to prevent it from dislocation after it is implanted.
4. The previously developed GDD focused only on how to drain out the excessive aqueous humor to lower the IOP to a proper range. However, when at a sudden eye pressure increase such as bumping or rubbing the eyes, those GDDs cannot prevent the unwanted aqueous humor drainage. Therefore, an ideal GDD should have a protecting mechanism to prevent hypotony in the case of transient unexpectedly high eye pressure (e.g., > 50 mmHg).
5. An easy implantation procedure is needed to implant the GDD within 10 minutes, without cutting the conjunctival layers. Therefore, a translimbal type of GDD without an end plate is chosen.
In our newly developed GDD, the key component of the GDD is one normally closed (NC) check-valve designed to open at 10–20 mmHg. The NC check-valve allows extraneous aqueous humor to flow out of anterior chamber when the IOP is higher than the designed cracking pressure. On the other hand, the NC check-valve remains closed as long as eye pressure is lower than the designed cracking pressure. It restricts eye fluid from leaking out of the anterior chamber to prevent hypotony. The NC check-valve will be introduced in chapter 2. To fulfill the concept that the GDD closes at a sudden unexpected high IOP, one normally open (NO) check-valve is also developed. This NO check-valve opens during the normal operation, but closes when it encounters a sudden high IOP. The NO check-valve will be introduced in Section 3.2. In addition, the development of the fixation anchors, the integration, in vitro characterization, and ex vivo experiments of the whole GDD system will all be introduced in chapter 3.
1.4
Intraocular Pressure Monitoring
Because there could be no symptoms of pain in open angle glaucoma and the human eye tends to compensate a small peripheral vision loss, open angle glaucoma patients are usually diagnosed in the late stage of the disease. Thus an early stage diagnostic becomes also important in glaucoma management.
1.4.1 Current clinical IOP monitoring approaches
Goldmann applanation tonometry (GAT) and tono-pen (Reichert, Inc., Depew, NY) are two examples utilizing this contact approach to measure the IOP. The noncontact approaches such as pneumotonometry (i.e., air-puff tonometry) [79, 80], however, are currently more popular. The pneumotonometry blows an air-puff, which serves the applanation force in this case, onto the eye to flatten the corneal surface. The deformation of the corneal surface is measured by optical approach. Similar to the contact tonometry approach, the applanation force is balanced with IOP and the corneal surface, and therefore the IOP can be calculated given the measured flattened corneal surface and the applied force. Compared to contact tonometry, the pneumotonometry provides more accurate readouts as it has less refractory responses from the targets during the measurement.
1.4.2 Wireless telemetric sensing technology
Even though the applanation tonometry can provide quite useful information of patients’ IOP, the readout, however, can be seriously affected by many unpredicted parameters such as the cornea thickness, the orientation of the instruments during the measurment, or variation in the corneal mechanical properties’ from person to person [81–83]. Besides, the applanation tonometry requires skillful operation, which can only be performed by well-trained professionals such as ophthalmologists, making continuous IOP monitoring impractical.
a wireless IOP sensing technique is required to accomplish a direct, convenient and reliable continuous IOP sensing technology.
The concept of utilizing passive telemetric sensing technique to monitor IOP has been developed yearly to achieve the ideal sensors capable of noncontact and continuous in situ IOP measurement [87, 88]. A transensor is the key component of this technique that is implanted into the anterior chamber. The IOP signal is wirelessly obtained by an external coil reader which wirelessly interrogating the implanted sensor. Although the active devices were developed to demonstrate its capability of monitoring the IOP, its size and the power transfer are always the concerns and restrict them from practical usage [87, 89]. On the other hand, passive devices shows a more compact and flexible design which is more suitable for anterior chamber implantation [90].
completed transensor is small enough for minimally invasive implantation into the anterior chamber.
Although Chen’s IOP sensor has demonstrated its successful monitoring the IOP wirelessly, the quality factor reduces after the sensor implantation. This is attributed to the high loss tangent of the aqueous humor surrounding the device. The low quality factor degrades the performance of Chen’s sensor, decreasing the sensing distance. In the thesis, two solutions are proposed to solve the problem. One is attaching a capillary tube on the bottom of the device serving as the pressure transducer connecting the anterior chamber and the variable capacitor. The other approach is to protect the sensing coil by covering protective materials with lower loss tangent than aqueous humor. These two new concepts provide new possibilities to skip or isolate the aqueous humor to preserve the quality factor of the sensor, and therefore make the passive IOP sensor implantation practical.
1.5
Biocompatible Material, Parylene-C, Usage
Parylene-C, poly(chloro-para-xylylene) is chosen to fabricate all the devices developed in this thesis. The molecular structure of parylene-C is shown in Figure 1-1. Parylene-C has been proved by Food and Drug Administration (FDA) to be the biocompatible material and complies with United States Pharmacopeia’s (USP’s) class VI plastics requirements, meaning it is totally implantable in the human body [99].
CH2
Cl
CH2
Parylene-C is prepared by the vapor phase deposition at room temperature. To prepare the parylene-C film, the parylene-C dimer is first vaporized at 150°C to the gaseous dimer, and then pyrolyzed at 690°C, turning into the monomer gas. The monomer gas goes into the deposition chamber, conformally coating onto the targets. The deposition temperature is normally kept as room temperature (20°C), and the deposition pressure is in the range of 20–100 mTorr, which is unlike the metallic deposition chamber with deposition pressure as ~ 10-5 torr. In the pressure range of 20– 100 mTorr, the mean free path is about 1 mm and therefore the monomer gas can uniformly distributed in the chamber and conformally coats the targets.
Parylene-C is a very good dielectric material with dielectric strength of 5600 V/mil and dielectric constant of about 3 [100]. Parylene-C has very low moisture permeability, and very inert to chemicals. In addition, parylene-C can be easily prepared in the clean room and can be patterned by normal oxygen plasma. Therefore, parylene-C fabrication is very compatible with CMOS/MEMS processes and has been widely used in BioMEMS research in recent days.
1.6
Characteristics of Parylene-C
Most of the properties’ numbers were measured at parylene-C film as-deposited state, which means the parylene-C was never treated thermally, mechanically, or any other kinds of treatments, before it was tested. In our fabrication experiences, however, it showed that the mechanical property is seriously affected by its processing histories. For example, after a series of fabrication processes in the clean room, Young’s modulus was obtained as 4.75 GPa as compared to 2.78 GPa provided by the vendor of parylene-C dimer [103]. Therefore, it is necessary to understand the final influences that every fabrication process could cause during the device manufacturing.
More specifically, parylene-C is one type of thermal plastic polymer and temperature is a key controlling parameters of its properties. Therefore parylene-C properties are different between room temperature and the human body temperature; i.e., 37°C. The current available parameters cannot ideally represent the behavior of parylene-C in human bodies and need
![Table 1-2: History of glaucoma drainage device development [12]](https://thumb-us.123doks.com/thumbv2/123dok_us/780520.1091014/50.612.73.509.106.687/table-history-glaucoma-drainage-device-development.webp)