International Journal of Research in Advent Technology, Vol.2, No.5, May 2014
E-ISSN: 2321-9637
140
Image Enhancement Algorithm Using Color Stereopsis
Mr. P. J. Sonawane
1, Prof. A. H. Karode
2, Prof. U. S. Bhadade
3 E & TC Department1, 2, 3, ME Scholarv1, Asst.Prof.2, H.O.D3Email:[email protected]1
Abstract- This paper propose a new image enhancement algorithm using color stereopsis between red and blue
colors and also shows it’s advantages over depth darkening algorithm. Color stereopsis is a phenomenon in the human visual system (HVS) in which a long wavelength color is perceived as being located closer than a short wavelength color. Although many psychophysical studies on color stereopsis have been carried out, its practical application is not fully investigated. First, the relationship of red and blue colors to the depth perception is analyzed. Then, a simple but practical image enhancement algorithm is presented based on the analysis result. The experimental results shows the effectiveness of the algorithm. This is a simple and efficient method to enhance the perceptual quality of images that contain depth information. Here it is demonstrated that a depth map can be used for enhancing the visual quality of an image by manipulating the lightness of the foreground or background of the scene.
Index Terms-Color stereopsis; depth map; human visual system; image enhancement.
1. INTRODUCTION
Due to the progress of stereo matching and depth acquisition techniques, a depth map, often called a depth image, is becoming more accurate and thus many depth map-based applications are receiving significant attention. To this end, interesting image enhancement approaches using depth maps have been introduced [1] [2] and [3]. In [1], the image is manually segmented into three layers, following which the lightness and chroma of each layer are adjusted based on experimental studies on color stereopsis. Color stereopsis is a phenomenon in the human visual system (HVS) in which a long wavelength, e.g. red, is perceived as being located closer than a short wavelength, e.g. blue [4] [5]. In [2], the lightness and chroma of an image is adjusted on the basis of selected reference artistic paintings. In particular, the adjustment is performed by manually segmenting the image into four depth layers and refining each layer separately. This phenomenon is usually explained by a color-based optical illusion, which results from the fact that colored lights refract differently and thus stimulate disparate points in the eye. A reversal phenomenon (a short wavelength is perceived as being located closer than a long wavelength) is also observed when the background lightness becomes close to white. The psychophysical reasoning for the reversal phenomenon can be found in literature [5] [6].
Although the previous studies have slightly different assumptions and consequences [4] [6] and [10], it is consistently found that the color stereopsis especially occurs between the red and blue colors. In [3], it is demonstrated that a depth map can be used for enhancing the visual quality of an image by manipulating the lightness of the foreground or background of the scene. Especially, darkening the background region, called depth darkening, effectively enhances the depth perception of an image
since depth darkening provides better separation among objects.
This paper provide a new image enhancement algorithm using the color stereopsis between the red and blue colors. Based on our experimental studies, the characteristics of the color stereopsis are investigated and the solution for enhancing depth perception of an image is presented. The algorithm differs from the conventional method [2], [3] in that manual depth map segmentation is not required and a weight map used for intensity modification is obtained by using the input color image and its corresponding depth map. Especially, weight values are first computed in the edge regions of depth map and then the computed weights are propagated using the joint trilateral filter (JTF). The algorithm modifies a color image in such a way that foreground objects can be perceived as being located closer than background objects for the depth perception enhancement.
This paper is organized as follows. In Section 2 steps of algorithm is explained. A new image enhancement algorithm is presented in Section 3. The effectiveness of the algorithm is evaluated in Section 4, and finally, conclude this paper in Section 5.
2. STEPS OF ALGORITHM
International Journal of Research in Advent Technology,
background regions. However, since the color information is not used and the foreground regions are left unchanged, the image enhancement ca
restricted. But the algorithm can effectively adjust the intensity of the foreground and background regions of the image because in this algorithm co
is used.
For increasing the clarity of the image it is necessary to use image enhancement process. The aim of the image enhancement is to improve the interpretability or perception of information in images for human viewers, or to provide `
other automated image processing techniques. For enhancing the image different image enhancement algorithms are available. The clarity of the image is depends on the different factors. The depth of the image is one of the factor on which
image is depend. Depth of the image contains information relating to the distance of the surfaces of the scene objects from a view point. By increasing the depth perception of the image we can identify differences between foreground and back things. In this algorithm depth map information of color image is used along with the color blue and red color information. Depth map is an image that contains the information relating to the distance of the surfaces of scene objects from a view poi
gray scale image that describes the distance of the objects in the image.
2.1. Sobel Edge Detection
The Sobel operator is used in particularly within edge detection Technically, it is a discrete differentiation computing an approximation of the
image intensity function. At each point in the image, the result of the Sobel operator is either the corresponding gradient vector or the norm of this vector. The Sobel operator is based on convolving the image with a small, separable, and integer valued filter in horizontal and vertical direction and is therefore relatively inexpensive in terms of computations. On the other hand, the gradient approximation that it produces is relatively crude, in particular for high frequency variations in the image. The Kayyali operator for edge detection is another operator generated from Sobel operator.
The operator uses two 3×3 kernels which are convolved with the original image to calculate approximations of the derivatives -
changes, and one for vertical. Since the intensity function of a digital image is only known at discrete points, derivatives of this function cannot be defined unless we assume that there is an underlying continuous intensity function which has been sampled at the image points. With some additional
International Journal of Research in Advent Technology, Vol.2, No.2, February 2014
E-ISSN: 2321-9637
background regions. However, since the color information is not used and the foreground regions are left unchanged, the image enhancement capability is algorithm can effectively adjust the intensity of the foreground and background regions of the image because in this algorithm color information
For increasing the clarity of the image it is necessary to use image enhancement process. The aim is to improve the interpretability or perception of information in images for human viewers, or to provide `better' input for other automated image processing techniques. For enhancing the image different image enhancement algorithms are available. The clarity of the image is depends on the different factors. The depth of the image is one of the factor on which clarity of the image is depend. Depth of the image contains information relating to the distance of the surfaces of the scene objects from a view point. By increasing the depth perception of the image we can identify differences between foreground and background In this algorithm depth map information of color image is used along with the color blue and red color information. Depth map is an image that contains the information relating to the distance of the surfaces of scene objects from a view point. It is a gray scale image that describes the distance of the
image processing, detection algorithms. differentiation operator, computing an approximation of the gradient of the image intensity function. At each point in the image, the result of the Sobel operator is either the orresponding gradient vector or the norm of this vector. The Sobel operator is based on convolving the image with a small, separable, and integer valued filter in horizontal and vertical direction and is therefore relatively inexpensive in terms of tions. On the other hand, the gradient approximation that it produces is relatively crude, in particular for high frequency variations in the image. The Kayyali operator for edge detection is another operator generated from Sobel operator.
s two 3×3 kernels which with the original image to calculate one for horizontal changes, and one for vertical. Since the intensity ction of a digital image is only known at discrete points, derivatives of this function cannot be defined unless we assume that there is an underlying continuous intensity function which has been sampled at the image points. With some additional
assumptions, the derivative of the continuous intensity function can be computed as a function on the sampled intensity function, i.e. the digital image. It turns out that the derivatives at any particular point are functions of the intensity values at virtually all image points. However, approximations of these derivative functions can be defined at lesser or larger degrees of accuracy.
The Sobel operator represents a rather inaccurate approximation of the image gradient, but is still of sufficient quality to be of practical use in many applications. More precisely, it uses intensity values only in a 3×3 region around each image point to approximate the corresponding image gradient, and it uses only integer values for the coefficients which weight the image intensities to produce the gradient approximation. As a consequence of its definition, the Sobel operator can be implemented by simple means in both hardware and software: only eight image points around a point are needed to compute the corresponding result and only integer arithmetic is needed to compute the gradient vector approximation. In general, an algorithm of edge detection finds the sharp intensity variation of an image and in this way it obtains the edges of the objects contained on the image. There are various methods to detect the edges which use descrete gradients, laplacians, etc. The most common methods used in the detection of edges are Roberts, Sobel, Preview, Laplacian, Canny, etc. Their operators are masks of 3x3 windows (2x2 windows in the Roberts algorithm) which are convolved with the incoming image to assign each pixel a value of 0 or 255. To obtain better results each method applies between two and four masks to find edges in the image. This tutorial explains the implementation of one of the most commonly used methods for edge detection called Sobel edge detection algorithm. This algorithm uses 4 operators (also called masks or kernels) of 3x3 windows which measure the intensity variation of the image when they are convolved with it in 4
vertical, right diagonal and left diagonal. Now we describe the Sobel Edge Detection algorithm. Consider an input image of size M x N as shown i below fig. 1. :-
Fig. 1.Arrangement of pixels for an i
Since the masks are of dimension 3x3, it is necessary to select a 3x3 window of the image to
Vol.2, No.2, February 2014
141 s, the derivative of the continuous intensity function can be computed as a function on the sampled intensity function, i.e. the digital image. It turns out that the derivatives at any particular point are functions of the intensity values at virtually all image points. However, approximations of these derivative functions can be defined at lesser or larger
The Sobel operator represents a rather inaccurate approximation of the image gradient, but is still of o be of practical use in many applications. More precisely, it uses intensity values only in a 3×3 region around each image point to approximate the corresponding image gradient, and it uses only integer values for the coefficients which ntensities to produce the gradient approximation. As a consequence of its definition, the Sobel operator can be implemented by simple means in both hardware and software: only eight image points around a point are needed to compute the and only integer arithmetic is needed to compute the gradient vector approximation. In general, an algorithm of edge detection finds the sharp intensity variation of an image and in this way it obtains the edges of the objects contained on the e are various methods to detect the edges which use descrete gradients, laplacians, etc. The most common methods used in the detection of edges are Roberts, Sobel, Preview, Laplacian, Canny, etc. Their operators are masks of 3x3 windows (2x2 Roberts algorithm) which are convolved with the incoming image to assign each pixel a value of 0 or 255. To obtain better results each method applies between two and four masks to find edges in the image. This tutorial explains the f the most commonly used methods for edge detection called Sobel edge detection algorithm. This algorithm uses 4 operators (also called masks or kernels) of 3x3 windows which measure the intensity variation of the image when they are convolved with it in 4 directions: horizontal, vertical, right diagonal and left diagonal. Now we describe the Sobel Edge Detection algorithm. Consider an input image of size M x N as shown in
Arrangement of pixels for an image.
International Journal of Research in Advent Technology,
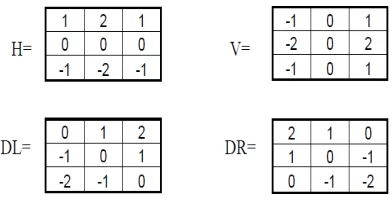
Fig.2. Sobel edge detection masks in four direction.
convolve it with each mask. To explain this process we select the first 3x3 window of the
in the shadowed part of the previous figure. This algorithm uses four masks as shown below, we can observe in the equations how this masks are applied to the original image.
To convolve the image with these masks, we have to solve some equations, which are described in the following paragraphs. Note that these equations are implemented in the package of image processing as functions which are specified for each equation.
Edr = (A(1,2) + 2A(1,1) + A(2,1)) –
2A(3,3) + A(3,2)) ...(1)
Eh = (A(1,1) + 2A(1,2) + A(1,3)) –
+ A(3,1)) ...(2)
Ev = (A(1,3) + 2A(2,3) + A(3,3)) –
+ A(3,1)) ...(3)
Edr = (A(1,2) + 2A(1,3) + A(2,3)) –
2A(3,1) + A(3,2)) ...(4)
After finding the values in each direction with each function, the gradient magnitude and the direction of the intensity variation must be computed. The formula that is used for this purpose is the following :-
Mag = max [│Eh│,│Ev│,│Edl│,│
[│E┴│]
In this equation, it can observed that we have to find the maximum value of intensity variation and add the value of E┴/8, where E┴ is the intensity variation in the direction that is perpendicular to the direction of the maximum intensity variation. To find the maximum value of intensity variation, the function compare must be used. This function receives the values of the intensity variation of each direction that were computed in the previous part and returns the maximum absolute value, the absolute value of E and a binary code indicating the direction of the edge of the figure. The codes for each edge direction are shown in table 1 :-
International Journal of Research in Advent Technology, Vol.2, No.2, February 2014
E-ISSN: 2321-9637
Fig.2. Sobel edge detection masks in four direction.
convolve it with each mask. To explain this process we select the first 3x3 window of the image as shown in the shadowed part of the previous figure. This algorithm uses four masks as shown below, we can observe in the equations how this masks are applied to
To convolve the image with these masks, we some equations, which are described in the following paragraphs. Note that these equations are implemented in the package of image processing as functions which are specified for each equation.
– (A(2,3) + ,3) + A(3,2)) ...(1)
(A(3,3) + 2A (3,2) + A(3,1)) ...(2)
(A(1,1) + 2A (2,1) + A(3,1)) ...(3)
– (A(2,1) + 2A(3,1) + A(3,2)) ...(4)
After finding the values in each direction with ch function, the gradient magnitude and the direction of the intensity variation must be computed. The formula that is used for this purpose is the
│ │,│Edr│] + 1/8 ...(5)
In this equation, it can observed that we have to find the maximum value of intensity variation and add is the intensity variation in the direction that is perpendicular to the direction of the maximum intensity variation. To find the maximum value of intensity variation, the function must be used. This function receives the variation of each direction that were computed in the previous part and returns the maximum absolute value, the absolute value of E┴ and a binary code indicating the direction of the edge of the figure. The codes for each edge direction are
Table1.Codes for Edge Directions.
DIRECTION
Positive Horizontal
Negative Horizontal
Positive Vertical
Negative Vertical
Positive Right Diagonal
Negative Right Diagonal
Positive Left Diagonal
Negative Left Diagonal
Finally, to decide which pixel is part of an edge or which is not, the magnitude value has to be compared with a signal of the edge detector code called threshold. This comparison is made in the edge detector code. If the magnitude is
threshold, the value 255 is assigned to the correspondent pixel establishing that it is an edge. Otherwise it is assigned a 0. This process is developed for all the pixels of the image. After applying a sobel edge detection method we get t
image as shown fig. 3:-
(a) Fig. 3.(a) Original Color Image.
Sobel Edge Detection.
2.2.Morphological Dilation Operation
Morphological operations are affecting the form, structure or shape of an object. Applied on binary images (black & white images
colors: black and white). They are used in pre or post processing (filtering, thinning, and pruning) or fo getting a representation or description of the shape of objects/regions (boundaries, skeletons convex hulls). The two principal morphological operations are dilation and erosion. Dilation allows objects to expand, thus potentially filling in smal
connecting disjoint objects. Erosion shrinks objects b
Vol.2, No.2, February 2014
142 Codes for Edge Directions.
CODE
000
001
010
011
100
101
110
111
Finally, to decide which pixel is part of an edge or which is not, the magnitude value has to be compared with a signal of the edge detector code . This comparison is made in the edge detector code. If the magnitude is greater than the threshold, the value 255 is assigned to the correspondent pixel establishing that it is an edge. Otherwise it is assigned a 0. This process is developed for all the pixels of the image. After applying a sobel edge detection method we get the edge map of an
(b)
Image. (b) Edge Map Using Sobel Edge Detection.
Morphological Dilation Operation
Morphological operations are affecting the form, structure or shape of an object. Applied on binary images (black & white images – images with only 2 ). They are used in pre or post processing (filtering, thinning, and pruning) or for getting a representation or description of the shape of objects/regions (boundaries, skeletons convex hulls).
[image:3.595.80.276.90.192.2] [image:3.595.297.529.105.306.2]International Journal of Research in Advent Technology, Vol.2, No.2, February 2014
E-ISSN: 2321-9637
143 Fig.4.Typical Shapes of the Structuring Elements (B)
(a) (b)
Fig.5.(a) Original Image. (b)Image After Applying Morphological Dilation.
etching away (eroding) their boundaries. These operations can be customized for an application by the proper selection of the structuring element, which determines exactly how the objects will be dilated or eroded.
The dilation process is performed by laying the structuring element B on the image A and sliding it across the image in a manner similar to convolution (will be presented in a next laboratory). The difference is in the operation performed. It is best described in a sequence of steps :-
1. If the origin of the structuring element coincides with a 'white' pixel in the image, there is no change; move to the next pixel.
2. If the origin of the structuring element coincides with a 'black' in the image, make black all pixels from the image covered by the structuring element.
Notation: A ⊕ B
The structuring element can have any shape. The gray scale image is as shown below in fig.5.(a) After applying Morphological Dilation operation we get the image shown in fig.5.(b). When we apply sobel edge detection method we do not get continuous edges. To get continuous edges we apply morphological dilation.
3. ALGORITHM
Let I denote the image consisting of R,G,B channels in the RGB color space, and H,S,I channels in the HSI color space, respectively, while D be the depth map corresponding to I. D(x,y) represents the horizontal disparity value at the (x,y) position, and thus closer objects have higher depth values. Since our image enhancement attempts to improve the depth perception of the image, we first detect the binary edge map of D by using the Sobel edge detector. Then, the morphological dilation operation is applied to the edge map by using a 5 × 5 square-shaped structural element. Let ED denote the dilated edge map
of D. The weight Wx,y used for modifying the intensity component at (x,y) is obtained if ED (x,y) =
1. The computed weights are then propagated to the region of ED (x,y) = 0 by using the JTF [8]. From
here, let (x,y) satisfy ED (x,y) = 1 , Nx,y and be the
spatial neighborhood of the size HN1 × WN1. Nx,y is
divided into the foreground and background regions by using the binary block truncation coding method [8] as follows :-
(i, j) ∈ Fx,y if D (i,j) ≥ Dmean (Nx,y) , Bx,y if D (i,j) < Dmean (Nx,y) ...(1)
where (i, j) ϵ Nx,y, Dmean (Nx,y) is the average depth value in Nx,y, Fx,y and Bx,y and are the set of foreground and background pixels in Nx,y, respectively. The average red values for the foreground and the background, rf and rb , are defined
as :-
rf = │ , │∑( , ) ∈ , ( , ),
rb =│ , │∑( , ) ∈ , ( , ). ...(2)
where │X│denotes the number of elements in the set X. The average blue values for the foreground and the background, bF and bB , are defined in a similar
manner.
Let dr, db, and dD represent the difference values
between the center position and the neighboring pixel in Nx,y for r, b and D, respectively, which are given as :-
dr = dr ( x, y ; i, j ) = r (x,y) – r (i,j) , ...(3)
db = db ( x, y ; i, j ) = b (x,y) – b (i,j) , ...(4)
dD = dD ( x, y ; i, j ) = D (x,y) – D (i,j) . ...(5)
Then, let Nx,y denote the set of pixels ( i, j ) ∈ Nx,y satisfying drdb < 0. Note that the pixels in can
International Journal of Research in Advent Technology, Vol.2, No.2, February 2014
E-ISSN: 2321-9637
144
Wi,j = α . dD + 1, (i,j) ∈ Nx,y ...(6)
Thus, the deviation of Wi,j from 1 linearly increases
with the Depth dD difference.
If dr > 0 and db < 0, the weighing factor α is obtained as :-
. bB if (x,y) ∈ Fx,y , (i, j) ∈ Bx,y ,
α = , if (x,y) ∈ Bx,y , (i, j) ∈ Fx,y ,
0 , otherwise
...(7)
Where Bx,y = Bx,y∩ Nx,y , Fx,y = Fx,y∩ Nx,y and αmax is
defined by :-
αmax = ( , )- ...(8)
In other words, if the center position (x,y) belongs to the foreground and its color is reddish compared to the background pixel (i,j), increases as bB increases.
Here αmax , is simply used for preventing the saturation
of the intensity value. On the other hand, if (x,y) belongs to the background and its color is reddish compared to (i,j), Wi,j is set to be independent to the
foreground blue value and 0 ≤ Wi,j≤ 1.
If db > 0 and dr < 0, the weighing factor α is obtained as :-
. (255 - rB) , if (x,y) ∈ Fx,y , (i, j) ∈ Bx,y ,
α = . (rc - rf) , if (x,y) ∈ Bx,y , (i, j) ∈ Fx,y ,
0, otherwise ...(9)
where rc is the red value in which the reversal
phenomenon of the color stereopsis occurs, which is empirically determined by 128. Here, if (x,y) belongs to the foreground and its color is bluish compared to (i,j), α decreases as rb increases. However, Wi,j is
always greater than 1 to increase the foreground intensity value. If (x,y) belongs to the background and its color is bluish compared to (i,j), α decreases as rf
increases. Note that Wi,j≥ 1 if rf≥ rc, otherwise Wi,j <
1. Finally, Wx,y is obtained by combining the weights
in Nx,y as follows :-
Wx,y =
∑( , ) ∈ ,! ,
│" , │ ...(10)
Until now, we have computed wx,y for the region of
ED (x,y) = 1. For the region of
ED (m,n) = 0 , the computed weights are propagated
using the JTF [3] as follows :-
Wm,n = #∑
Gσs 'x – m , y – n-Gσi / i (x, y)– i (m, n)0 Gσd (D (x, y) – D (m, n))
( , )∈" ,3, 45 ( , )6
.Wx,y
Fig.6. Art image . (a) Original color image. (b) Depth map. (c) Dilated edge map of (b). (d) Weight map
scaled by 128.
where Nm,n is the spatial neighborhood of the size HN2
× WN2 and C is a normalization factor Gσs , Gσi , and
Gσd are the zero-mean Gaussian kernels with the
standard deviations of σs, σi and σd , respectively.
The weight propagation is performed until the weight is assigned to every pixel. Fig.3.2.4.1(d) shows an example of the weight map in which the weights are scaled by 128 for visualization. The resultant per-pixel weight map is multiplied to the intensity channel i, and the enhanced image is obtained by transforming the color space back to the RGB space. The fig.6.(a) – 6.(d) shows an original image, depth map of an original image, edge map of an original image after applying sobel edge detection and morphological dilation operation and weight map of an original image respectively.
Note that the algorithm is strongly dependent on the results of our empirical study. In addition, only the intensity component of the image is considered and the saturation and hue components remain ignored. Thus, a more improved solution can be devised from better understanding of the color stereopsis. It is emphasized that the goal of this work is to develop an automatic image enhancement algorithm based on the color stereopsis using the color image and its corresponding depth map.
4. EXPERIMENTAL RESULT
International Journal of Research in Advent Technology, Vol.2, No.2, February 2014
E-ISSN: 2321-9637
145 compared with the depth darkening algorithm [9],
which also exploits the depth map to enhance the
Fig.7. Resultant Images Obtained by the Algorithm. (a) Art (463 × 370). (b) Books (463 × 370) (c) Laundry (447 × 370). (d) Reindeer (447 × 370)
image.The standard deviations are chosen according to [8]. The parameters related to the size of the spatial neighbourhood are determined by HN1 = HN2 = WN1 =
WN2. We found that the performance of the algorithm
is not strongly dependent on the size of the spatial neighborhood.
Fig.8.(a) Original image, (b) Resultant image obtained by depth darkening algorithm.(c) Resultant Image
obtained by the algorithm.
Fig.8. shows the results obtained by the algorithm. For the sake of visual quality comparison, the black boxed regions in Fig.7.(a)–8.(d) are magnified in Fig.8. As can be seen in Fig.8.(b), better object separation is achieved by darkening the background regions. However, since the color information is not used and the foreground regions are left unchanged, the image enhancement capability is restricted. The experimental results in Fig.8.(c) show that the
algorithm can effectively adjust the intensity of the foreground and background regions of the image. It should be noted that we assume that an accurate depth map is available before applying the algorithm. Therefore, if the quality of the depth map is not accurate enough, a preprocessing step for depth map enhancement is required.
5. CONCLUSION
In this paper we studied the Sobel edge detection method for edge detection. The Sobel edge detector uses a pair of 3X3 convolution masks, one estimating gradient in the x direction and the other estimating gradient in y–direction. It is easy to implement than the other operators. Transferring a 2-D pixel array into statistically uncorrelated data set enhances the removal of redundant data, as a result, reduction of the amount of data required to represent a digital image. Considering data communication especially the internet, massive data transfer causes serious problems for interactive network users. Edge detection helps in optimizing network bandwidth and it is needed to keep track of data flowing in and out of the network. It helps to extract useful features for pattern recognition. Although the Sobel operator is slower to compute, it’s larger convolution kernel smoothes the input image to a greater extent and so makes the operator less sensitive to noise. The larger the width of the mask, the lower its sensitivity to noise and the operator also produces considerably higher output values for similar edges. Sobel operator effectively highlights noise found in real world pictures as edges though, the detected edges could be thick. The Canny edge detector and similar algorithm solved these problems by first blurring the image slightly then applying an algorithm that effectively thins the edges to one-pixel. This may constitute a much slower process, hence, Sobel operator is highly recommended in massive data communication found in image data transfer.The Sobel operator is based on convolving the image with a small, separable, and integer valued filter in horizontal and vertical direction and is therefore relatively inexpensive in terms of computations. On the other hand, the gradient approximation which it produces is relatively crude, in particular for high frequency variations in the image.
International Journal of Research in Advent Technology, Vol.2, No.2, February 2014
E-ISSN: 2321-9637
146 experimental results demonstrated the effectiveness of
the algorithm.
REFERENCES
[1] Hong; J. Y.; Lee; H. Y.; Park; D. S.; Kim; C. Y. (2011). Depth perception enhancement based on chromosteropsis, Proc. SPIE 7865.
[2] Scharstein; D.; Szeliski R. [Online] Available:
http://vision.middlebury. edu/stereo.
[3] Yang; Q.; Yang R.; Davis; J.; Nister D. (2007). Spatial-depth super resolution for range images. Proc. IEEE Conf. Comput. Vis. and Pattern Recogn., pp. 1–8.
[4] Thompson; P.; May; K.; Stone; R. (1993): Chromostereopsis: a multicomponent depth effect. Displays, 14 (4), pp. 227–234.
[5] Zhang; X.; Constable; M.; Chan; K. L. (2011). Aesthetic enhancement of landscape photographs as informed by paintings across depth layers. IEEE Int. Conf. Image Process., pp. 1113–1116. [6] Delp; E. J.; Mitchell; O. R. (1979): Image
compression using block truncation coding. IEEE Trans. Commun., 27 (9), pp. 1335–1342.
[7] Guibal; C. R. C.; Dresp; B. (2004): Interaction of color and geometric cues in depth Perception. Psychol. Res., 69 (1-2), pp. 30–40.
[8] ISO/IEC JTC1/SC29/WG11. (2011): Multi-view depth processing using joint filtering for improved coding performance, Doc. M20070. [9] Luft; T.; Colditz; C.; Deussen; O. (2006): Image
enhancement by unsharp masking the depth buffer. ACM Trans. Graph, 25 (3), pp. 1206– 1213.