DOI: http://dx.doi.org/10.26483/ijarcs.v8i7.4219
Volume 8, No. 7, July – August 2017
International Journal of Advanced Research in Computer Science
RESEARCH PAPER
Available Online at www.ijarcs.info
ISSN No. 0976-5697 ISSN No. 0976-5697
CLASSIFICATION AND CLUSTERING IN YIELD PREDICTION BASED ON SOIL
PROPERTIES
Gurpinder Singh
Department of Computer Engineering Punjabi University
Patiala,India
Kanwalpreet Singh Atwal (Asst. Prof.)
Department of Computer EngineeringPunjabi University Patiala, India
Abstract: Data mining in agriculture is becoming a trending subject. Various applications like: pig disease prediction, yield prediction based on rainfall and temperature, assuring quality of apples etc. incorporate the techniques of data mining. Still there is a gap in study for the sole reason of predicting the most common but most important content for the farmer i.e Yield Prediction. Prediction of Yield can be influenced by various factors like: Soil properties, Climate, Seed used and Method of cultivation. In this paper prediction of yield is done by using only the Soil properties of the soil i.e data mining shows that there are surely some patterns in soil properties which constitute to increase or decrease of the production of wheat. The soil properties included for this research include Phosphorous, Potassium (K2O), Electrical conductivity, pH value, Organic carbon and Texture of soil. The Yield prediction was done in two phases. First the pH value was predicted based on the other soil categories and in Second phase Yield was predicted based on the soil properties including predicted pH. Techniques used are classification and clustering with some important algorithms.
Keywords: Agricultural Data Mining, Classification, Clustering, Dataset, Random Forest, K-NN, K means.
I. INTRODUCTION
Data Mining is a technique used from extracting useful information from a large dataset. Data Mining uses many techniques for evaluating different patterns from a large amount of data. Data Mining is considered to be a step in the larger process of Knowledge Discovery from Data (KDD). KDD is the process of discovering useful knowledge from data while data mining refers to a particular step in this process [2]. In data Mining large datasets relating to any subject/field are first collected and then all preprocessing is applied. Preprocessing is a process of transforming or making data appropriate for applying data mining techniques to it. Preprocessing may include: cleaning of data, summarization, transformation etc. Data is transformed into the format required for the analysis. Data Warehouses are the largest storage units of data. Historical data relating to any field can be found in the data warehouse. For example; a bank ABC has many branches but has one center or headquarter. Similarly, operational data is stored in each branch’s storage unit but historical data from each branch is collected and stored in one centralized unit called a data warehouse. So that in future any kind of data analysis can be applied to the data.
Data Mining incorporates many techniques like: clustering, classification, machine learning, Support Vector Machines, Regression, Association Rules etc. Further these techniques can be applied on the dataset by different algorithms. An overview of these different techniques is shown in the figure 1.1.
Data Mining in Agriculture is an emerging area and attracting many data analysts and data mining experts to focus their studies on it. Summary information about
[image:1.595.329.568.396.580.2]crop production can help the farmers identify the crop losses and prevent it in future [3].
Fig. 1.1 A schematic representation of the classification of the data mining techniques discussed.[1]
company to analyze both the sales data and data relating to the customer which helps them in making better business decisions. Data mining techniques bring out the customer behaviors and popular choices made by the customers from which the company can estimate that which product’s sales are better than the other. Telecommunication industry also uses data mining which has extended its application from providing telephone services to offer many add-] on services like fax, Internet and cellular phone [4]. Many scientific applications including Biological Data Analysis, Intrusion Detection and Agriculture Sector also demand the use of data mining techniques. Data mining in agriculture sector however is just started to give its services in solving various problems. This paper discusses various application of data mining in agriculture.
II. APPLICATIONS
Sally Jo Cunningham and Geoffrey Holmes have discussed about the innovative techniques used in agriculture for the purpose of grading the mushrooms [16]. DSSAT [17], CROPSYST [18], and GLEAMS [19] are some of the models developed for the purpose of simulating the soil dynamics.
In 2006 P.Tittonell, K.D Shepherd, B. Vanlauwe, K.E Giller studied the effects of crop and soil management on maize productivity by applying Classification and Regression Tree (CART) analysis [20].Support vector Machine is used to classify crops [21] and scenarios relating to changing weather are analyzed using SVM is well [22].
Some recent works include, for instance, the detection of cancers from proteomic profiles [23], the prediction of breast cancer survivability [24], the control of infections in hospitals [25] and the analysis of diseases such as bronchopulmonary dysplasia [26].
D Ramesh and B Vishnu Vardhan used Multiple Linear regression and K-means to predict the yield data [7]. Multiple Linear Regression showed 98% of the accuracy where as K-means showed 96%, so MLR turned out to be more beneficial for the prediction of yield based on the parameters; Year, Rainfall, Area of Sowing and production. ZeroR, Kmeans and Association rules were applied for classification, clustering and association [27] of the dataset. This research was conducted for the prediction of olive production in Thassos Island. Neural Networks are used to differentiate between bad and good apples, x-rays images of the apples were used to monitor the presence of water cores in Apples [28]. SVM incorporated sensors are used for smelling milk [29].
III. CLASSIFICATION
Classification is one of the major techniques used in data mining while other being the Clustering. Classification and prediction are sometimes used as synonyms but in actual there is difference between the two. Classification refers to prediction of categorical values however prediction models predict continuous values as well. In classification the class labels are already known [4]. For instance let us assume a problem which involves the prediction “whether to play or not to play” on the basis of
parameters like: Rain, time, homework, Play. Here Play is the class attribute which has two categories; Play, No Play. So here classification model or decision tree will generate a model which will predict whether to play or not based on the prior information of the class label. K-Nearest Neighbors [6] algorithm divides the data set into two portions which are called training set and test set. These sets are usually divided in the ration of 70:30, 70% being the training set and 30% being the test set. Then the algorithm uses the training set to train the model for accurate prediction. To check the accuracy of the developed model it is then applied to the test set and a confusion matrix is created which shows how many records belonging to a particular attribute/field have been correctly predicted.
Classification algorithms include: k-Nearest Neighbors, Naïve Bayes, ID.3, CART (Classification and Regression Tree), CHAID (Chi-Square Automatic Interaction Detector) and MARS which extends the decision trees in order to handle numerical data more precisely. K-nearest is however the most widely used classification algorithm which has its application in Concept Search and Recommender Systems [5].
Random Forest is a decision tree algorithm in classification which classifies the instances/records in the form of a tree. A large number of classification trees are made in random forest approach. By default the number of trees made by this algorithm is 500 but these can be increased or decreased as per requirements of the implementer. Every tree takes each of the instance/observation as input and then gives the output as leaf by going through the different rules made by the tree based on pre training. The most common outcome for each observation is used as the final output. A new observation is fed into all the trees and taking a majority vote for each classification model. An OOB error known as Out-of-Bag error is estimated for the cases which were not used prior in building the decision tree. OOB is estimated as percentage.
IV. CLUSTERING
In clustering there is no training set as the class labels are unknown [5]. For example: let us assume that we have a dataset of cows belonging to different breeds and it contains the following attributes/variables; Height, width, weight and color. But we don’t have the information about the breed of any of cow. So, on the basis of these four attributes we would make clusters (number of clusters can be selected with various methods) such that each cluster would contain only those records or objects which have more similarities with each other than those of other clusters. The principle which is used here is maximizing the intra-class similarity and minimizing the interclass similarity (Jiawei Han et al.).
K-means algorithm which comes in handy for agricultural data mining is discussed in this paper. K-means has been used in a research about agricultural yield data [7]. Another major application of clustering was encountered in the prediction of olive production in Thassos [4]. Focus of k-mean is to partition a dataset in which the data in a group is more similar to each other. K in k-means describes the number of clusters that should be made. Centers are marked for all the clusters in a way that they are as far from each other as possible because they can produce results if kept close. Some important applications which used k-means clustering include: Forecasting pollution in the atmosphere [8], Soil classifications using GPS-based technologies [9], Classification of plant, soil, and residue regions of interest by color images [10], Predicting wine fermentation problems [11], grading apples before marketing [12], Monitoring water quality changes [13], Detecting weeds in precision agriculture [14].
V. DATA SET OF SOIL PROPERTIES
A dataset is obtained from Department of agriculture, Patiala. This dataset has 150 instances of in 7 attributes. The head of the dataset is shown in the table I.
Table I: Originally Collected Data
TEXTURE OC P K2O Conducted
(EC)
pH Yield
LS 0.48 11 140 0.5 8.1 19
LS 0.3 12 120 0.6 8.2 18.8
SL 0.3 6.3 78 .38 6.9 22
L .23 4.3 65 .29 6.7 21
SL .1 9.1 49 .38 6.7 19
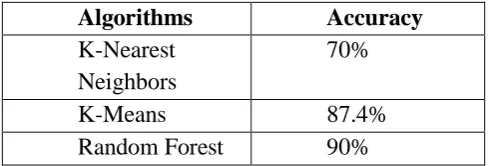
[image:3.595.322.567.106.189.2]The above table shows a few of the observations of the dataset. Texture is a factor attribute whereas all the other are numerical. This measurement is taken up per acre. The Soil laboratory of agriculture department Patiala manually recorded these attributes including the contact information of the farmer whose soil sample is tested. By contacting these 150 farmers, production of previous crop per acre is recorded. Therefore this dataset contains the latest reports on wheat production. For the purpose of applying algorithms like K-NN, we needed to convert the target attribute into a factor. Therefore on the basis of prior knowledge, pH was converted into three categorical values which are: Alkaline, Neutral and Acidic. And on the recommendation of the farmers the production falls under 3 categories which are High, Low and Medium. In this paper we will discuss the algorithm used for only yield prediction. Three algorithms were used which are: K-NN, K-means and Random Forest. Following table shows the accuracy given by these algorithms.
TABLE II: ALGORITHMS USED FOR YIELD PREDICTION AND THEIR ACCURACY
Algorithms
Accuracy
K-Nearest
Neighbors
70%
K-Means
87.4%
Random Forest
90%
Yield was converted into Factor form on the basis of farmer responses i.e the value under 19q/acre was considered to be in the “Low” production category. Value from 19-23 is considered to be in “Medium” category and anything above 23 is considered to be in “High” production category.
Figure 1.
VI. TOOLUSED
R-Studio was used for conducting various statistical analyses within R environment. R-studio is graphical user interface and more suitable to use for evaluation and analysis.
Only a little pre-processing was required because the size of the dataset is basically small and collected manually with caution. R-tool constitutes different packages which posses various techniques to be used. Packages like: Caret, ggplot2, random-forest etc. were installed to the R-environment.
R is an integrated suite of software facilities for data manipulation, calculation and graphical display. It includes [15]
• an effective data handling and storage facility,
• a suite of operators for calculations on arrays, in particular matrices,
• a large, coherent, integrated collection of intermediate tools for data analysis,
• graphical facilities for data analysis and display either on-screen or on hardcopy, and
• a well-developed, simple and effective
programming language which includes conditionals, loops, user-defined recursive functions and input and output facilities.
VII. RESULTSANDDISCUSSION
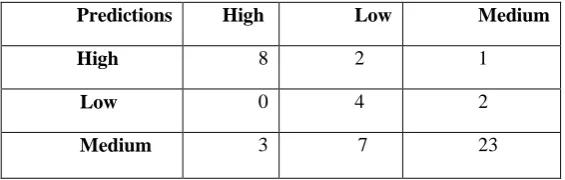
K-NN is used to predict the class of the crop production i.e whether it is High, Low or Medium. Instead of having the numerical values under the attribute “Yield”, now our dataset has the categorical values which are “High”, “Low” and “Medium”. Data was normalized before feeding to the k-NN algorithm. Normalization means that all the attributes were sorted to be in the same range of 0-1 excluding the attribute “Texture”. A Confusion matrix is made for showing the accuracy of the predictions.
TABLE III: CONFUSION MATRIX FOR K-NN
Predictions High Low Medium
High 8 2 1
Low 0 4 2
Medium 3 7 23
K-NN divides the dataset into two parts one is taken as Test set and other as Training set. A model is trained or developed based on the training set and then test set is fed to the model to check how well the trained model did. Since we have 150 instances/records, dataset is divided into two parts where training set has 100 instances and test set has 50. Confusion matrix shows the predictions done by model on the test set i.e on the 50 predictions. The Diagonal values shown in the table are the ones correctly predicted by the model and others are errors. Here 35 observations out of 50 are correctly classified giving the model an accuracy of 70%.
K-means clustering was used for predicting the classes based on the clusters. The number of clusters could be initialized basically by Forgy and random partition methods. However in our case we already knew the number of clusters/categories to which we want our instances to fall in, hence k=3. Three categories corresponding to three clusters are Low, Medium and high. K-means deals with only numerical attributes i.e only feature space is analyzed for any relationship or pattern among different attributes in order to make an instance fall into a certain cluster. There for all the factor attributes has to either be excluded for k-means implementation or they can be converted to numeric. Attributes used for k-means are: OC, P, conducted (EC), K2O and pH.
[image:4.595.30.313.208.298.2] [image:4.595.28.283.699.756.2]K-means is in the R-Library by default therefore we do not have to install any particular package. The target attribute which contain factor values is kept NULL.
Table IV: Confusion matrix for K-means.
Predictions 1 2 3
High 4 0 27
Low 27 1 0
Medium 11 77 3
It is observed from the confusion matrix that only 19 observations out of 150 are incorrectly predicted i.e predicted to be in the wrong cluster. Here High category corresponds to 3rd cluster. “Low” production category corresponds to 1st cluster and “Medium” to 2nd cluster. Hence 131 out of 150 instances are perfectly predicted. Unlike K-NN, k-means does not divide the dataset into two parts therefore the prediction was made by considering all the observations. It is clear from the confusion matrix that k-means did much better than that of k-NN.
In the end, a decision tree algorithm named Random Forest was also implemented hoping to get better results from the dataset. A large number of classification trees are made in random forest approach. By default the number of trees made by this algorithm is 500 but these can be increased or decreased as per requirements of the implementer. Every tree takes each of the instance/observation as input and then gives the output as leaf by going through the different rules made by the tree based on pre training. The dataset is divided into two parts which are training set and test set. Number of trees specified is 500. Model is trained based on the training set with 100 instances. OOB estimated is 10% which represents the model to be 90% accurate in case of classifying the instances.
Table IV: Confusion Matrix for Random Forest.
Predictions 1 2 3 Class Error
High 18 1 1 0.10000000
Low 2 18 1 0.14285714
Medium 3 2 54 0.08474576
Confusion matrix shows 10 instances to be incorrectly classified whereas 90 out 100 are perfectly classified into their respected categories. In High category there were 20 instances, random forest predicted 18 out of these to be in the same class whereas it predicted 1 to be in “low” and one to be “medium”. This makes the prediction of only “High” class to be 90% accurate.
On the other hand there are 21 records/instances which fall into the yield production category of “LOW” production. Out of these 21 instances random forest predicted 18 records which belong to the category “LOW” and 2 instances to falls in “high” and 1 in “Medium”. Hence the prediction rates for random forest in case of predicting a value to be in “LOW” production category are very good i.e nearly 86%.
algorithm to be 91.5% accurate when it comes to predict an observation in “Medium” category.
By looking at the performance of K-Nearest Neighbors algorithm, K-means algorithm and Rand Forest classification algorithm it is clear that Random Forest is much better in terms of accuracy.
VIII. CONCLUSION
This Analysis showed that the models made by Random forest and k-means can perform very well in case of soil data. There were many patterns developed by the algorithms which show the different relationships among different attributes of the dataset. For instance by exploring and plotting clusters against the attributes P and pH it shows that each P varies in patches for each category i.e when P is low, Yield is high. It also showed a strong bond between P and pH which explains the fact the wheat performs best between the pH of 6-7.
Our dataset in consideration is brief therefore it is open to further research and discussion that bigger soil datasets may change the patterns which were particularly formed by the techniques used for this analysis. For instance random forest, k-NN, k-means could show different results if we increase the no. of instances in the dataset. So this particular research and used techniques are not ideal for all the soil dataset but gives a theory that random forest might works better than NN and k-means.
However, various problems in agriculture not only relating to crop growth, quality assurance but also the condition of a farmer can be dealt using appropriate data mining techniques. Proper actions should be taken by the Governments in order to collect the appropriate agricultural data for the sole reason of applying data mining techniques on it. Agriculture field promises a great deal of work to be done and new applications to be developed in order to enhance the knowledge about certain behaviors of the crops, animal etc.
IX. REFERENCES
[1] Mucherino A., Papajorgji P.J and Pardalos P.M(2009). Data Mining in Agriculture. Springer.
[2] Kamber, J. H. (2000). Data Mining Concepts and Techniques. UrbanaChampaign: Morgan Kaufmann. [3] N. Gandhi and L. J. Armstrong, "A review of the
application of data mining techniques for decision making in agriculture," IEEE Conference Publications 2016- 2nd International Conference on Contemporary Computing and Informatics (IC3I), Greater Noida, India, 2016, pp. 1 6.
[4] Ramar, V. R. (2011). Classification Agricultural Land Soils: A Data Mining Approach. Agricultural Journal , 8286.
[5] A. Mucherino, P. P. (2009). A survey of Data Mining Techniques applied to Agriculture. SpringerVerlag. [6] Holmes, S. J. (1999). Developing Innovative Applications in Agriculture Using Data Mining.
[7] D Ramesh, B. V. (2013). Data Mining Techniques and Applications to Agricultural Yield Data. International Journal of Advanced Research in Computer and Communication Engineering , 34773480.
[8] H. Jorquera, R. Perez, A. Cipriano, and G. Acuna, Short
Term Forecasting of Air Pollution Episodes, In: Environmental Modeling 4, P. Zannetti (Ed.), WIT Press, UK, 2001.
[9] V.N. Vapnik, Statistical Learning Theory, JohnWiley & Sons, 1998.
[10] G. E. Meyer, J. C. Neto, D. D. Jones, T.W. Hindman, Intensified Fuzzy Clusters for Classifying Plant, Soil, and Residue Regions of Interest from Color Images, Computers and Electronics in Agriculture 42, 161–180, 2004.
[11] A. Urtubia, J. R. Perez-Correa, A. Soto, P.
Pszczolkowski, Using Data Mining Techniques to Predict
Industrial Wine Problem Fermentations, Food Control 18, 1512–1517, 2007.
[12] V. Leemans, M.F. Destain, A Real Time Grading Method
of Apples based on Features Extracted from Defects, Journal of Food Engineering 61, 83–89, 2004. [13] K.A. Klise and S.A. McKenna, Water Quality Change Detection: Multivariate Algorithms, Proceedings of SPIE 6203, Optics and Photonics in Global Homeland Security II, T.T. Saito, D. Lehrfeld (Eds.), 2006. [14] A. Tellaeche, X.-P. Burgos-Artizzu, G. Pajares and A. Ribeiro, A Vision-Based Hybrid Classifier for Weeds Detection in Precision Agriculture Through the
Bayesian
and Fuzzy k-Means Paradigms, Advances in Soft Computing 44, 72–79, 2008.
[15] “What is R?” R.N.p.,n,d Web. Jan. 2017. https://www.r- ptroject.org/about.html.
[16] Cunningham S.J, Holmes Geoffrey,(1999). Developing Innovative applications in Agriculture using Data Mining.New Zealand Foundation for Reseachr and technology.
[17] Jain Rajni, Minz, S., V. Rama Subramaniam. (2009). Machine learning for forewarning cropdiseases. J. Ind. Soc. Agri. Stat. 63(1): pp. 97-107.
[18] Meyer GE, Neto JC, Jones DD, Hindman TW, (2004), Intensified fuzzy clusters for classifying plant, soil, and residue regions of interest from color images.
Computer
Electronics Agric Vol. 42: pp. 161–180.
[19] Jones JW, Tsuji GY, Hoogenboom G, Hunt LA, Thornton
PK, Wilkens PW, Imamura DT, Bowen WT, Singh U., (1998), Decision support system for agrotechnology transfer: DSSAT v3. In: Tsuji GY, Hoogenboom G, Thornton PK (eds) , Understanding options for agricultural production. Kluwer Academic Publishers, Dordrecht, pp 157–177.
[20] P. Tittonell, K. S. (2006). Unravelling the effects of soil and crop management on maize productivity in smallholder agricultural systems of western Kenya—An application of classification and regression tree analysis. Agriculture, Ecosystems & Environment , 137150.
[21] CampsValls G, G.C. L.M. O. G. (2003). Support Vector Machine for crop classification using hyperspectral data. Lect Notes Comp Sci , 134141.
[22] Tripathi S, S. V. (2006). Support Vector Machine Approach to Downscale Precipitation in Climate
Change
Scenarios. J Hydrol , 621640.
[23] L. Li, D.M. Umbach, P. Terry and J.A. Taylor, Application of the GA/KNN Method to SELDI Proteomics,Data, Bioinformatics 20 (10), 1638–1640, 2004.
Assessment of the Compression Efficiency of the MPEG-4 AVC Specification, Proceedings of SPIE 5308,Visual Communications and Image Processing, 1082–1093, 2004.
[25] S.E. Brossette, and P.A. Hymel Jr., Data Mining and Infection Control, Clinics in Laboratory Medicine 28 (8), 119–126, 2008.
[26] M. Rova, R. Haataja, R. Marttila, V. Ollikainen, O. Tammela and M. Hallman, Data Mining and Multiparameter Analysis of Lung Surfactant Protein Genes in Bronchopulmonary Dysplasia, Human
Molecular Genetics 13 (11), 1095–1104, 2004.
[27] Theodosios Theodosiou, S. V. (n.d.). Application of Data Mining Techniques to Olea europaea var. media oblonga production from Thassos. 487497. [28] Shahin MA, T. E. (2001). Artificial Intelligence classifiers for sorting apples based on watercore. J Agric Eng , 265274.
![Fig. 1.1 A schematic representation of the classification of the data mining techniques discussed.[1]](https://thumb-us.123doks.com/thumbv2/123dok_us/683231.1075677/1.595.329.568.396.580/fig-schematic-representation-classification-data-mining-techniques-discussed.webp)