Volume 8, No. 5, May – June 2017
International Journal of Advanced Research in Computer Science RESEARCH PAPER
Available Online at www.ijarcs.info
ISSN No. 0976-5697
Density Based Spatial Clustering Deviations for Black Box Regression Testing in Large
Database
Ms. Gomathi.S
M. Sc (CT).,
Research Scholar, Department of Computer Science Kongunadu Arts and Science CollegeCoimbatore, Tamil Nadu, India
Dr. R. Beena
Associate Professor and Head Department of Computer Science Kongunadu Arts and Science CollegeCoimbatore, Tamil Nadu, India
Abstract: Ensuring the functional excellence of database applications is a most needed and important problem in software testing. Database applications are mostly adopted in many fields. For example in public administrations they need to process large amounts of transactions efficiently and need to store large amounts of data. Regression testing is used to check whether the new changes cause any errors in the existing software. Regression testing is one of the most useful software testing types during software maintenance. Clustering is a data mining technique used to discover patterns from the database. This research work incorporates soft clustering concept, which is the process of deriving the information based on the similarity of the unsupervised database. It can be considered the most important unsupervised learning technique and it deals with finding a structure in a collection of unlabeled data. Black-box Regression Testing approach focuses on regression testing and proactively exposes behavioral deviations by checking inside the black box instead of checking only black-box outputs. The proposed research work introduces a new approach called Expectation-Maximization (EM) with Density Based Spatial Clustering Algorithm to measure the dissimilarity of data elements in large database. This research work, presents an optimal perspective on the problem of EM Clustering Deviations for Black Box Regression Testing of Database Applications. The proposed method called Density based spatial clustering deviations for black box regression testing in large database which measures the correspondence between pairs of data points. The proposed method is to establish a unified framework on unsupervised data sets. To validate the proposed approach, a large scale Norwegian Tax Accounting System case study is considered, and the results show that clustering approach can indeed serve as an accurate strategy for grouping regression test deviations. The proposed analysis suggests that this approach can significantly reduce the effort spent by testers in analyzing regression test deviations, increase their level of confidence, and therefore make regression testing more scalable.
Keywords: Clustering, Regression Testing, Black-box Regression Testing, Density Based Spatial Clustering Algorithm (DBSCAN)
I.
I
NTRODUCTIONTesting software [1] is a most significant and challenging activity. Nearly half of the software production development cost is spent on testing [2] [3]. The main objective of software testing with clustering approach is to expel as many errors as possible to ensure that the tested software meets an acceptable level of quality. Clustering is a data mining technique of grouping set of data objects into multiple groups or clusters so that objects within the cluster have high similarity, but are very dissimilar to objects in the other clusters. Dissimilarities and similarities are assessed based on the attribute values describing the objects. Clustering algorithms [4] are used to organize data, categorize data, for data compression and model construction, for detection of outliers etc. Common approach for all clustering techniques is to find centre of the cluster that will represent each cluster. Cluster centre will represent with input vector can tell which cluster this vector belong to by measuring a similarity metric
between input vector and all cluster centre and determining which cluster is nearest or most similar one [5]. Representing data by fewer clusters necessarily loses certain fine details, but achieves simplification. Regression testing is a highly important but time consuming activity [6]. A great deal of work has been performed on devising and evaluating techniques for selecting, minimizing, and prioritizing regression test cases [7] [8] [9]. Such techniques are necessary, but unfortunately not sufficient to help scale regression testing to large, complex systems [10]. Regression testing is performed when changes are made to existing software [11].
The purpose of regression testing is to provide confidence that the newly introduced changes do not obstruct the behaviors of the existing, unchanged part of the software.
[image:1.595.318.543.633.730.2]Clustering is a division of data into groups of similar objects. Each group, called cluster, consists of objects that are similar between themselves and dissimilar to objects of other groups. Representing data by fewer clusters necessarily loses certain fine details, but achieves simplification. It represents many data objects by few clusters, and hence, it models data by its clusters. Data modeling puts clustering in a historical perspective rooted in mathematics, statistics, and numerical analysis. From a machine learning perspective clusters correspond to hidden patterns, the search for clusters is unsupervised learning, and the resulting system represents a data concept. Therefore, clustering is unsupervised learning of a hidden data concept and the fuzzy clustering is the most widely used technique for hidden data analysis.
Figure 1: Example for Clustering
[12]. In addition to providing a natural classification, clustering gives an insight into the underlying structure of the data. The goal is that the objects in each cluster are similar while the different clusters are dissimilar. To do this there is a need to define a proximity measure that quantifies what to mean by these terms. A proximity measure is either a similarity measure or a dissimilarity measure of Euclidean Distance Method [13] [14]. The different ways of defining proximity is part of the reason why many different clustering procedures have been developed, ranging from simple heuristics suitable for a particular type of dataset to general iterative schemes which seeks to optimize some associated optimality criterion. Ideally one should use a clustering approach that produce good results in a wide variety of situations, since the general assumption for clustering is that to know little or nothing about the data in advance. An example for clustering is shown in the figure 1.
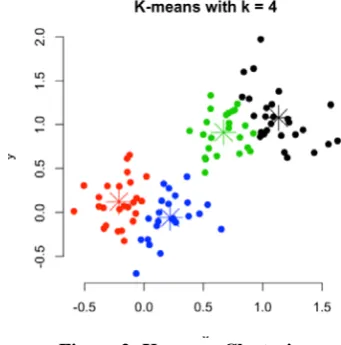
[image:2.595.69.240.339.512.2]A well known general clustering procedure is the k-means algorithm. This is most often implemented with the Euclidean distance. The k-means algorithm is optimal for clustering dense, spherically shaped and linearly separable clusters. Figure 2 shows an example of such a situation, and the k-means algorithm can be expected to give a good clustering results.
Figure 2: K-means Clustering
Spatial data clustering is not a new task. It is the same concept in classical data clustering. The only difference is the difference between the natures of input values. In classical data as it has been shown in figure 3, the values which can be shown in multi-dimensional vectors and therefore <x, y> represents two distinctive values in a 2-dimensional space. Spatial Clustering can be simplified as a vector with two values like x y but this time instead of values x and y, the longitude and latitude object can be replaced. With this assumption the spatial clustering problem is exactly like clustering of 2-dimensional vectors.
Figure 3 Simplified classical data in 2-D space
This clustering also can be done through distance-based methods or density-based methods. Distance-based methods have two weakness which leads to be not suitable for spatial data clustering. First there is a need for a number of clusters as an input and second they allocate all objects to the clusters and never identify noises. There are some related works which firstly transform spatial or spatio-temporal data to same length multi-dimensional vectors and then apply a generic clustering algorithm like k-mean on the data. Density-based clustering of spatial data mostly is based on two well-known density-based algorithms DBSCAN (Density-Based Spatial Clustering of Applications with Noise) and OPTICS (Ordering Points to Identify the Clustering Structure). These algorithms contain a density function which computes the distance of objects in order to allocate them into the clusters. Two input parameters of these algorithms are distance threshold and minimum number of neighbors which makes an object as a member of cluster or a noise. The important property of density function is flexibility which distinguishes it from other algorithms. Black box testing does not explicitly use knowledge of the internal structure or code. The test engineer need not know the internal working of the Black box or application. Main focus in black box testing is on functionality of the system as a whole. The term behavioral testing is also used for black box testing. The white box testing is also sometimes called structural testing. Behavioral test design is slightly different from black-box test design because the use of internal knowledge is not strictly forbidden, but it is still discouraged. Each testing method has its own advantages and disadvantages. There are some bugs [15] [16] that cannot be found using only black box or only white box. Majority of the application are tested by black box testing method. Need to cover majority of test cases so that most of the bugs will get discovered by black box testing. Black box testing occurs throughout the software development [17] and testing life cycle i.e., in Unit, Integration, System, Acceptance and regression testing stages. Regression test-selection techniques decrease the cost of regression testing by choosing a separation of an existing test suite to use in retesting a customized program [18].
II.
P
ROBLEMF
ORMULATIONIII.
R
ELATED WORKS. Yoo, M. HarmanIn [7] discussed a survey about Regression testing activity that is performed to provide confidence that changes do not harm the existing behavior of the software. A number of different approaches have been studied to maximize the value of the accrued test suite: minimization, selection and prioritization. Regression testing is performed between two different versions of software in order to provide confidence that the newly introduced features of the System under Test (SUT) do not interfere with the existing features. While the exact details of the modifications made to SUT will often be available, they may not be easily available in some cases. The authors analyzed of trends reported in the paper revealed some interesting properties. There is evidence to suggest that the topic of test case prioritization is of increasing importance, judging by the shift in emphasis towards it that is evident in the literature.
E. Rogstad, L. Briand, E. Arisholm, R. Dalberg, and M. Rynning [19] presented a practical approach and tool (DART) for functional black-box regression testing of complex legacy database applications. Such applications are important to many organizations, but are often difficult to change and consequently prone to regression faults during maintenance. They also tend to be built without particular considerations for testability and can be hard to control and observe. They devised a practical solution for functional regression testing that captures the changes in database state during the execution of a system under test. The differences in changed database states between consecutive executions of the system under test, on different system versions, can help identify potential regression faults. In order to make the regression test approach scalable for large, complex database applications, classification tree models are used to prioritize test cases. The authors reported on how DART was applied and evaluated on business critical batch jobs in a legacy database application in an industrial setting, namely the Norwegian Tax Accounting System (SOFIE) at the Norwegian Tax Department (NTD). DART has shown promising fault detection capabilities and cost-effectiveness and has contributed to identify many critical regression faults for the past eight releases of SOFIE. This approach is to fully integrate DART with the daily test operation of the project, and ideally as a continuous part of the development process, as a means for early fault detection.
E. Rogstad and L. Briand [20] proposed an approach for selecting regression test cases in the context of large-scale database applications. We focus on a black-box (specification-based) approach, relying on classification tree models to model the input domain of the system under test (SUT), in order to obtain a more practical and scalable solution. The classification tree models are used to partition the input domain of the SUT in order to then select test cases. Rather than selecting test cases at random from each partition, it incorporated a similarity-based test case selection, hypothesizing that it would yield a higher fault detection rate. We perform an experiment in an industrial setting where the SUT is a large database application in Norway’s tax department. The authors compared both fault detection rate and selection execution time. In general random selection is superior to similarity-based selection in terms of selection execution time. However, the difference for smaller sample
sizes in the range of interest is less than a few minutes (i.e., 39 s when selecting 30% of the test suite when comparing similarity partition-based with random selection).
S. Chen, Z. Chen, Z. Zhao, B. Xu, and Y. Feng [21] discussed a supervised clustering method, namely semi-supervised Kmeans (SSKM), is introduced to improve cluster test selection. SSKM uses limited supervision in the form of pairwise constraints: Must-link and Cannot-link. These pairwise constraints are derived from previous test results to improve clustering results as well as test selection results. The experiment results illustrate the effectiveness of cluster test selection methods with SSKM. Two useful observations are made by analysis. (1) Cluster test selection with SSKM has a better effectiveness when the failed tests are in a medium proportion. (2) A strict definition of pairwise constraint can improve the effectiveness of cluster test selection with SSKM. Although the authors found some observations on different definitions of Must-link and Cannot-link, it may be not sufficient in other applications. The test selection using unsupervised or semi-supervised clustering mainly contains four steps:
Capturing Feature: In regression testing, the results and execution profiles of tests will be recorded. In this research work, a simple execution profile, function call profile, is generated for each test. The function call profile is represented as a binary vector, in which each bit records whether the corresponding function is called or not in a running test. If a function is called, the corresponding bit value is set to 1, otherwise 0. 2).
Euclidean Distance Measure: For each pair of tests, it will calculate the distance of them.
Cluster Analysis: The inputs to cluster analysis are the function call profiles generated in the first step. In current machine learning research, K-means is one of the most widely used clustering methods.
Sampling Strategy: A number of sampling strategies can be used to select a few of tests from each cluster and build up a new test set for regression testing.
IV.
R
ESEARCHM
ETHODOLOGYFigure 4 Architecture Diagram
This research work, presents an optimal perspective on the problem of EM Clustering Deviations for Black Box Regression Testing of Database Applications. The proposed method called Density based spatial clustering deviations for black box regression in large database, which measures of correspondence between pairs of data points. The proposed method establishes a unified framework on unsupervised data sets. The proposed approach is validated using a large scale Norwegian Tax Accounting System case study [22][23] and the results show that clustering approach can indeed serve as an accurate strategy for grouping regression test deviations. The proposed analysis suggests that this approach can significantly reduce the effort spent by testers in analyzing regression test deviations, increase their level of confidence, and therefore make regression testing more scalable.
The following methodologies are listed below,
1. Data Pre-processing
2. Black-box Regression Entropy Prediction 3. Expectation–Maximization (EM) Algorithm 4. Density-based Spatial Clustering Algorithm (DSC)
Data Preprocessing
The Norwegian Tax Department maintains the Norwegian tax accounting system (SOFIE), a system whose main purpose is to collect tax from all taxpayers in Norway. The system was developed as a customized application for the Norwegian Tax Department during the late 2000s, and entered its maintenance phase in 2011. Raw data is highly susceptible to noise, missing values, and inconsistency. The quality of data affects the data mining results [24]. In order to help improve the quality of the data and, consequently, of the mining results raw data is pre-processed so as to improve the efficiency and ease of the mining process. Data preprocessing is one of the most critical steps in a data mining process which deals with the preparation and transformation of the initial dataset. Data that is to be analyzed by data mining techniques
can be incomplete such as lacking of attribute values and noisy data such as errors and inconsistent data such as containing discrepancies in the department codes used to categorize items. Incomplete, noisy, and inconsistent data are common place properties of large, real-world databases and data warehouses. Incomplete data can occur for a number of reasons. Attributes of interest may not always be available, such as customer information for sales transaction data. Other data may not be included simply because it was not considered important at the time of entry. Relevant data may not be recorded due to a misunderstanding, or because of equipment malfunctions. Data that were inconsistent with other recorded data may have been deleted.
Black-Box Regression Testing Entropy Prediction
Functional testing involves ensuring that the functionality specified in the requirement specification works. System testing [25] involves putting the new program in many different environments to ensure the program works in typical customer environments with various versions and types of operating systems and applications. System testing is a testing conducted on a complete, integrated system to evaluate the system compliance with its specified requirements. Because system test is done with a full system implementation and environment, several classes of testing can be done that can examine non-functional properties of the system. It is best when function and system testing is done by an unbiased, independent perspective. Using black box regression testing techniques, testers examine the high-level design and the customer requirements specification to plan the test cases to ensure the code does what it is intended to do.
Expectation–Maximization (EM) Algorithm
Expectation–Maximization (EM) algorithm is an iterative method for finding maximum likelihood or maximum a posteriori (MAP) estimates of parameters in statistical models, where the model depends on unobserved latent variables. The EM iteration alternates between performing an expectation (E) step, which creates a function for the expectation of the log-likelihood evaluated using the current estimate for the parameters, and maximization (M) step, which computes parameters maximizing the expected log-likelihood found on the E step. It gives extremely useful result for the real world data set.
Density-Based Spatial Clustering Process (DSC)
The main idea of the DSC algorithm is that, for each point of a cluster, the neighborhood of a given radius has to contain at least a minimum number of points, that is, the density in the neighborhood has to exceed some predefined threshold. This algorithm needs three input parameters:
• k, the neighbor list size;
• Eps, the radius that delimitate the neighborhood area of a point (Eps-neighbourhood);
• MinPts, the minimum number of points that must exist in the Eps-neighbourhood
the farthest k nearest neighbor in terms of Euclidean distance. The average of all this distance is then calculated. After that, for each point of the dataset the algorithm identifies the directly density-reachable points using the Eps threshold provided by the user and classifies the points into core or border points. It then loop through all points of the dataset and for the core points it starts to construct a new cluster with the support of the DSC () procedure that follows the definition of density-reachable points. In this phase the value used as Eps
threshold is the average distance calculated previously. At the end, the composition of the clusters is verified in order to check if there exist clusters that can be merged together. This can append if two points of different clusters are at a distance less than Eps
.
V.
I
MPLEMENTATIONThe implementation for developing the Clustering Deviations for Black Box Regression Testing of Database Applications uses MATLAB R2010a simulator. Regression tests often result in many deviations i.e., differences between two system versions, either due to changes or regression faults. For the tester to analyze such deviations efficiently, it would be helpful to accurately group them, such that each group contains deviations representing one unique change or regression fault. The tax roll data set are considered for implementation process. It is a high dimensional data set with small sample sizes and large number of features. It contains 14290 samples for training, 8 features for testing and number of class size is 3.
Data Preprocessing is to clean the data by filling in missing values, smoothing noisy data, identifying or removing outliers, and resolving inconsistencies. If users believe the data are dirty, they are unlikely to trust the results of any data mining that has been applied. Furthermore, dirty data can cause confusion for the mining procedure, resulting in unreliable output. Although most mining routines have some procedures for dealing with incomplete or noisy data, they are not always robust. Instead, they may concentrate on avoiding over fitting the data to the function being modeled. Clustering preprocessing is the most important and widely used method of unsupervised learning. It is the problem of identifying groupings of similar points that are relatively isolated from each other, or in other words to partition the data into dissimilar groups of similar items. Noise is a random error or variance in a measured variable. This method uses data smoothing technique of Regression method can be smoothed by fitting the data to a function, such as with regression. Linear regression involves finding the best line to fit two variables, so that one variable can be used to predict the other. Multiple linear regressions are an extension of linear regression, where more than two variables are involved and the data are fit to a multidimensional surface. Using regression techniques to find a mathematical equation to fit the data helps smooth out the noise.
The noisy data in SOFIE- Norwegian Tax Accounting System case study are as follows
1. Missing values 2. Incomplete Data 3. Redundant Data 4. Inconsistency
The above mentioned noisy data are cleaned by using data cleaning techniques such as filling the incomplete data, removing the redundant data etc.
Black-Box Regression Entropy Prediction provides for clustering in the multiple regressions setting in which you have a dependent variable Y and one or more independent variables, the X’s. The algorithm partitions the data into two or more clusters and performs an individual multiple regression on the data within each cluster. Decision tree learning is a common method used in data mining. Most of the commercial packages offer complex Tree classification algorithms, but they are very much expensive. Decision tree algorithms generate tree-structured classification rules, which are written in a form of conjunctions and disjunctions of feature values. These classification rules are constructed through the following,
1. Selecting the best splitting feature based on a certain criterion
2. Partitioning input data depending on the best splitting feature values
3. Recursively repeating this process until certain stopping criteria are met.
The selected best splitting feature affects not only the current partition of input data, but also the subsequent best splitting features as it changes the sample distribution of the resulting partition.
The EM algorithm is a generally applicable mechanism for computing maximum probability estimates (MPEs) from incomplete data, in situations where maximum probability estimation would be straightforward. Expectation– Maximization (EM) algorithm is an iterative method for finding maximum likelihood or maximum a posteriori (MAP) estimates of parameters in statistical models, where the model depends on unobserved latent variables. The EM iteration alternates between performing an expectation (E) step, which creates a function for the expectation of the log-likelihood evaluated using the current estimate for the parameters, and a maximization (M) step, which computes parameters maximizing the expected log-likelihood found on the E step.
The DSC algorithm can identify clusters of widely varying shapes, clusters of varying densities, clusters which depend on non-spatial attributes, and approximate clusters in very large databases. It uses the concept of density reach-ability and density connectivity.
Density Reach-ability - A point "p" is said to be density reachable from a point "q" if point "p" is within ε distance from point "q" and "q" has sufficient number of points in its neighbors which are within distance ε.
ALGORITHMIC STEPS FOR DSC CLUSTERING
Let X = {x1, x2, x3, ..., xn} be the set of data points. DBSCAN requires two parameters: ε (eps) and the minimum number of points required to form a cluster (minPts).
Step 1: Start with an arbitrary starting point that has not been visited.
Step 2: Extract the neighborhood of this point using ε (All
points which are within the ε distance are neighborhood).
Step 3: If there is sufficient neighborhood around this point then clustering process starts and point is marked as visited else this point is labeled as noise (Later this point can become the part of the cluster).
Step 4: If a point is found to be a part of the cluster then its ε
neighborhood is also the part of the cluster and the above procedure from step 2 is repeated for all ε neighborhood points. This is repeated until all points in the cluster is determined.
Step 5: A new unvisited point is retrieved and processed, leading to the discovery of a further cluster or noise.
Step 6: This process continues until all points are marked as visited.
VI.
E
XPERIMENTALR
ESULTSThe tax roll data set are considered for implementation process. It is a high dimensional data set with small sample sizes and large number of features. It contains 14290 samples for training , 8 features for testing and number of class size is 3.
Features:TAXYEA(TY),ADJUSTENTDESC(ADS),ADJUST ENTAT(AD),BUILTAS(BT),TYPE(T),YEARBULIT(YB), SQUAREFIT(SF),STORIES(ST).
Classification Tree based on the features
Classification Tree in the above mentioned figure 5.22 is generated based upon the selected features with their importance list. The tree gives the output based on the criteria specified by the user with the help of decision statement. The output is categorized into three classes i.e., Class 0 which
categories the false values. Class 0.5 which is partially true and partially false. Class 1 which has only the true values.
Cross validation and Re substitution error rate
Cross-validation can be a computationally intensive operation since training and validation is done several times. Re substitution does not partition the data but it uses the training data for validation. The graph in the figure 5.23 shows, that the error rate has been decreasing by using the Re-substitution method through varying number of iterations
.
VII.
P
ERFORMANCEE
VALUATIONThe tax roll department data sets used in this research are Imbalanced Data Sets. The Norwegian Tax Department maintains the Norwegian tax accounting system (SOFIE), a system whose main purpose is to collect tax from all taxpayers in Norway. The system was developed as a customized application for the Norwegian Tax Department during the late 2000s, and entered its maintenance phase in 2011. SOFIE serves the daily operation of more than 3,000 end users i.e., taxation officers, and handles annual tax revenues of approximately 600 billion Norwegian Kroner [26]. It is therefore important to preserve system quality upon changes and new releases, to avoid additional effort to end users and expensive mistakes both for the taxpayers and administration.
Table 6.1 shows a summary of the Area Under Curve (AUC) and the cluster prediction per cluster input for each of the subject regression test campaigns. The full list of details, regarding entropy [27] per deviation and cluster, along with the actual distribution
Table 6.1 Comparison Methods of regression classification of AUROC values
Methods Group 1
Group 2
Group 3
Group 4
Group 5
DSC 0.997 0.985 0.999 0.992 0.999
Entropy 0.827 0.826 0.813 0.616 0.979
0.997 0.985 0.999 0.992 0.999
0.827 0.826 0.813
0.616
0.979
0 0.5 1 1.5
Group 1 Group 2 Group 3 Group 4 Group 5
A
U
C (
%
)
[image:7.595.46.290.280.403.2]Cluster Groups
Figure 6.1 Comparison Methods of regression classification of AUC values
[image:7.595.25.322.484.575.2]DSC
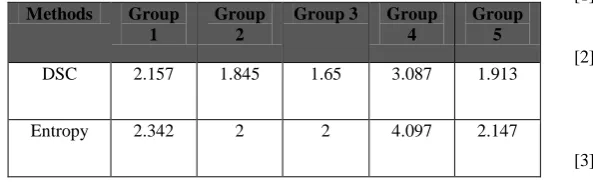
Table 6.2 shows the number of deviations needed to be inspected by the tester to cover all distinct deviations.
Table 6.2 Comparison of number of deviations needed to be inspected by the tester to cover all distinct deviations
Methods Group 1
Group 2
Group 3 Group 4
Group 5
DSC 2.157 1.845 1.65 3.087 1.913
Entropy 2.342 2 2 4.097 2.147
2.157
1.845 1.65
3.087
1.913 2.342
2 2
4.097
2.147
0 0.5 1 1.5 2 2.5 3 3.5 4 4.5
Group 1 Group 2 Group 3 Group 4 Group 5
Av
er
age
Cluster Groups
Figure 6.2 Number of deviations needed to be Inspected by the tester to cover all distinct deviations
DSC Entr opy
VIII.
C
ONCLUSION ANDF
UTUREW
ORKThis research presents an enhanced Clustering concept in data mining techniques to discover patterns from the database. This research presents a framework for discovering data memberships from unsupervised high dimensional datasets. By applying the black-box regression testing approach focuses on regression testing and proactively exposes behavioral deviations by checking inside the black box instead of checking only black-box outputs. The proposed work presents a new approach of Expectation-Maximization (EM) with density based spatial clustering algorithm to measure the dissimilarity data elements in large data base clustering. The proposed approach is validated using a SOFIE- a large scale Norwegian Tax Accounting System case study, and the results show that clustering approach can indeed serve as an accurate strategy for grouping regression test deviations. The research work executed the regression tests, and inspected all deviations from the test campaigns, while categorizing them into regression faults or changes. To applied the proposed clustering strategy on different combinations of input data, and evaluated the accuracy of the deviation grouping for each type of input combination to determine what information was relevant for our objective. A possible future addition could be to help the tester understand the relation between model properties and the clusters. For instance, there is a need for investigation, whether it is possible to infer relations such as that all deviations in density spatial cluster relate to the same equivalence class for one or more model properties, and are the only ones in the test suites to do so. This would strongly indicate the types of properties that cause different types of deviations, which would further help the tester or developer when looking for the cause of regression test failure.
R
EFERENCES[1] C. Graham, Y. Dharmasthira, and C. Eschinger, “Market Share: All Software Markets”, Worldwide, 2013, March 2014.
[2] S. Chen, Z. Chen, Z. Zhao, B. Xu, and Y. Feng, “Using semi-supervised clustering to improve regression test selection techniques”, in Proceeding 2011 IEEE 4th International Conference in Software Testing, Verification and Validation (ICST), 2011, Page number 1–10.
[3] H. Hemmati, A. Arcuri, L. Briand, “Achieving scalable model-based testing through test case diversity”, ACM Transactions on Software Engineering and Methodology (TOSEM) 22 (2013)
[4] S. Parsa, A. Khalilian, and Y. Fazlalizadeh, “A new algorithm to test suite reduction based on cluster analysis,” in Proceeding, 2nd IEEE International Conference Computer Science and Information Technology, 2009 (ICCSIT 2009)
[5] E. Rogstad, L. Briand, E. Arisholm, R. Dalberg, and M. Rynning, “Industrial experiences with automated regression testing of a legacy database application”, in Proceeding, 27th IEEE International Conference in Software Maintenance (ICSM), September 2011, Page number 362-371.
[6] M. Harrold and A. Orso, “Retesting software during development and maintenance”, in Proceeding , Frontiers of Software Maintenance, 2008 (FoSM 2008), 2008, Page number 99-108.
number 67–120, March 2012.
[8] R. Krishnamoorthi , SA. Sahaaya Arul Mary, “ Factor oriented requirement coverage based system test case prioritization of new and regression test cases”, Information and Software Technology 2009; 51(4):799–808.
[9] H. Hemmati, L. Briand, “An industrial investigation of similarity measures for model-based test case selection”, in: Proceedings of the 2010 IEEE 21st International Symposium on Software Reliability Engineering, ISSRE ’10, IEEE Computer Society, Washington, DC, USA, 2010, Page number 141–150.
[10] H.Do, G. Rothermel, “ Using sensitivity analysis to create simplified economic models for regression testing”, Proceedings of the ACM SIGSOFT International Symposium on Software Testing and Analysis (ISSTA 2008), ACM Press, 2008; 51–61.
[11] E. Rogstad, L. Briand, E. Arisholm, R. Dalberg, M. Rynning, “Industrial experiences with automated regression testing of a legacy database application”, in 27th IEEE International Conference on Software Maintenance (ICSM), 2011, Page number 362–371.
[12] L. Kaufman and P. J. Rousseeuw, “Finding Groups in Data—An Introduction to Cluster Analysis”, New York, NY, USA: Wiley, 2005.
[13] S. B. Needleman and C. D. Wunsch, “A general method applicable to the search for similarities in the amino acid sequence of two proteins”, J. Molecular Biology, volume 48, number 3, Page number 443–453, 1970.
[14] F.G.O.N. Emanuela, G. Cartaxo, Patrícia D.L. Machado, “On the use of a similarity function for test case selection in the context of model-based testing”, Software Testing, Verification and Reliability 21” (2011) 75–100.
[15] J. Xiao andW. Afzal, “Search-based resource scheduling for bug fixing tasks”, in International Symposium on Search Based Software Engineering (SSBSE), pages 133– 142, 2010
[16] P. A. Nainar and B. Liblit , “Adaptive bug isolation”, in ACM/IEEE International Conference on Software Engineering (ICSE), pages 255–264, 2010.
[17] A. Arcuri and L. Briand, “A practical guide for using statistical tests to assess randomized algorithms in software engineering”, International Conference on Software Engineering. 2011, ACM: Association for Computing Machinery: Waikiki, Honolulu , HI, USA. Page Number
1 - 10.
[18] Beena.R and Gomathi. S , “A comparative study of clustering deviations for black-box regression test-selection techniques” in International Journal of Advanced Research in Computer Science(IJARCS) , Volume 7 Issue 7 (Nov-Dec) 2016.
[19] E. Rogstad and L. Briand, “Test case selection for black-box regression testing of database applications”, Information Software Technology (IST), volume 31, number 6, Page number 676–686, June 2013.
[20] C. Zhang, Z. Chen, Z. Zhao, S. Yan, J. Zhang, and B. Xu, “An improved regression test selection technique by clustering execution profiles”, in Proceeding 2010, 10th International Conference in Quality Software (QSIC), 2010, Page number 171–179.
[21] Y. Liu, K. Wang, W. Wei, B. Zhang, and H. Zhong, “User-session-based test cases optimization method based on agglutinate hierarchy clustering” in Proceeding 2011, International Conference in Internet of Things and 4th International Conference in Cyber, Physical and Social Computing, Ser. ITHINGSCPSCOM'11, IEEE Computer Society, Washington, DC, USA, 2011, Page number 413– 418.
[22] P. Runeson and M. Host, “Guidelines for conducting and reporting case study research in software engineering”, Empirical Software Engineering volume 14, number 2, Page number 131–164, April 2009.
[23] R. K. Yin, “ Case Study Research: Design and Methods”, 3rd edition, London, U.K: Sage, 2003.
[24] I. H. Witten and E. Frank, “Data Mining: Practical Machine Learning Tools and Techniques”, 2nd edition. San Francisco, CA, USA: Morgan Kaufmann, 2005.
[25] S. Yoo , M. Harman, P. Tonella, A. Susi, “Clustering test cases to achieve effective & scalable rioritisation incorporating expert knowledge”, Proceedings of International Symposium on Software Testing and Analysis (ISSTA 2009), ACM Press, 2009; 201–211.
[26] Erik Rogstad and Lionel C. Briand, Fellow, “Clustering Deviations for Black Box Regression Testing of Database Applications”, IEEE Transactions on Reliability, volume 65, number 1,March 2016, Date of publication June 15, 2015; date of current version March 01, 2016
[27]
.