3576
Classification of WBC for Blood Cancer Diagnosis
using Deep Convolutional Neural Networks
Dhvani Kansara
1, Shaunak Sompura
2, Saifil Momin
3, Mitchell D‘silva
4Student1,2,3, Assistant Professor4,
Department of Information Technology, Dwarkadas J. Sanghvi College of Engineering, Mumbai, India1,2,3,4 Email: [email protected]1, [email protected]2,
[email protected]3, [email protected]4
Abstract- Classification of Leukocytes (WBCs) is widely used in the medical field for the diagnosis of various blood cancers such as Leukemia, Myeloma etc. The traditional methods that are currently being used are time consuming and susceptible to errors. Moreover, the results are not reliable and cannot detect morphological abnormalities. In this paper, we have implemented a model to automate the diagnosis of blood related diseases by classifying WBCs- Neutrophils, Lymphocytes, Eosinophils, and Monocytes from blood samples images, which provides a time-effective and accurate diagnostic system. Using Deep CNN we extracted minor intricacies in the structure of the cells and exhausted the dataset by generating multiple variations of the existing images, which resulted in improved accuracies. The image dataset consisted of 410 original images and 12,500 augmented images of blood cells paired with corresponding subtype labels. The proposed Deep CNN approach generated improved results and reduced the error rate compared to other models.
Index Terms-Deep Convolutional Neural Networks, Leukocytes, WBCs, blood cancer, data augmentation, CNN
1. INTRODUCTION
The evaluation of Leukocytes (white blood cells) is the primary step to diagnose many blood related diseases. The evaluation of the 5 major subtypes of Leukocytes, namely- Neutrophils, Lymphocytes, Eosinophils, Monocytes, and Basophils, can help in identification of various diseases including AIDS (Acquired Immune Deficiency Syndrome) [1] and blood cancers, such as Leukemia, Lymphoma, and Myeloma. Approximately 174,250 people in the United States (US) are estimated to be diagnosed with blood cancer in 2018 [2]. Moreover, the death tolls related to blood cancer is estimated at 58,100 in the US alone, in 2018 [2].
Currently, the medical diagnosis of such diseases is done mainly using hematology analyzer and manual counting [1]. The manual counting involves the counting of white blood cells (WBC) that is done primarily by medical operators, the accuracy of which is highly dependent on the operator's skills [3]. Although, the impedance-based hematology analyzer has its advantages, it can wrongly classify the cell types as white blood cells as their primary parameters for classification are limited to size and the number of particles [4] [5]. Therefore, there is a need to introduce precise, time-saving diagnostic systems to accurately classify the WBC count to determine various diseases. This can be made possible with the advances of Machine Learning in medical diagnosis [6], where techniques like clustering, thresholding, and support vector machine (SVM) [7] have been put to test.
This paper implements a Deep Convolutional Neural Network to classify the 4 blood subtypes. Convolutional Neural Network (CNN) is the widely used technique for image classification where the weights are learned with back-propagation [8]. A CNN model based on Deep Learning, where deep learning enhances the feature extraction ability and smooth scaling in case of increased parameters has been implemented [9] and a precision of 83% in classifying the WBCs has been achieved.
This paper is organized as follows: section 2 provides the data research, including the data exploration, augmentation, and pre-processing, section 3 describes the proposed approach of Deep Convolutional Neural Networks as well as the feature extraction and model representation. Section 4, discusses the results obtained by implementing the proposed approach. Section 5 gives the conclusion of this research.
2. DATA RESEARCH
3577
2.1. Data Selection
The proposed system uses the BCCD dataset (Blood Cell Images dataset), obtained from kaggle that consists of 12500 images (JPEG) of blood cells along with their corresponding cell type labels. Eosinophil, Lymphocyte, Monocyte, and Neutrophil are the four
blood cell types. There are around 3000 images of each type that are augmented. About 410 images are original, pre-augmented.
2.2. Exploration and Preprocessing
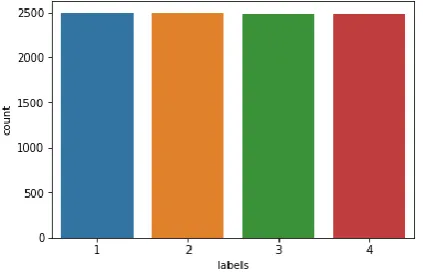
As seen in figure (2), it is found that there is a severe imbalance in the class size in the original images used to find the count of blood type cells. The distribution is not even and can thus lead to partial outputs and overfitting. The highest count of the image type being Neutrophil, where as the count of images labeled as Basophil is significantly lesser. Thus, in order to eliminate these imbalances in the input data, augmented images are used. In order to augment the images, performing transformations on the existing images such that all classes contain almost an equal number of examples. Doing so will avoid overfitting. Some of the basic transformations applied are flipping, translations, rotation, scaling, isolating individual R,G,B color channels, and adding noise. While creating new images we also add their corresponding labels into the dataset.
The categorical attributes (classes- Lymphocyte, Monocyte, Neutrophil) are first converted into numeric values and each image is re-sized to a dimension of 60x80x3 corresponding to width, height
and depth respectively. This is necessary for the descriptors (filters) to work efficiently during the CNN operation. Each class does not have a quantitative comparison amongst them, so in order that every class has an equal weightage and contribution, one hot encoding is performed over the data i.e., each of the numeric data is converted into
binary values. This will lead to a more impartial and accurate prediction.
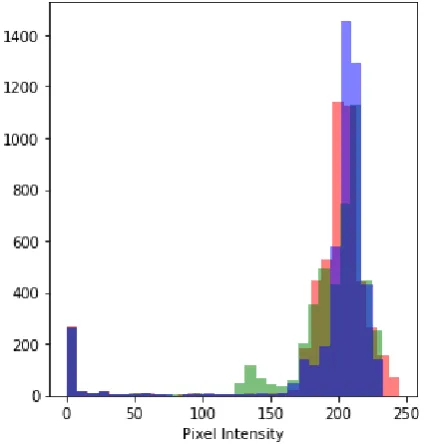
In a grayscale image, the intensity value of the pixel is stored from 0-255 where typically 0 is taken as black and 255 is taken as white. This range leads to 256 possible values for pixel intensity [13]. Separate red, green and blue value components need to be specified for color images. A vector of three numbers represents color images. The three ‗color planes‘ are usually stored separately and recombined when they are to be displayed or processed. A Histogram [11] in image processing is a graph of number of pixel values at a particular intensity value. The intensity value spans from 0-255. Histogram for color images includes the intensity values for red, green and blue at each pixel. The training of the samples is based on numeric values Fig. 1. Sample images of four different subtypes
from the dataset. [From left-to-right, top-bottom: Eosinophil, Lymphocyte, Monocyte, Neutrophil
respectively]
3578 i.e. the pixels. Figure 3 represents the distribution of
red, green and blue values in a particular class of cell
depending upon pixel value.
The images in the dataset undergo RGB normalization [12] to remove distortions. To carry out RGB normalization, the individual RGB pixel value is divided by 255. This transforms the component value range from 0-255 to 0.0-1.0. Equations 1,2,3 represent formulae used for normalization, where R stands for red, G stands for green and B stands for blue.
(1)
(2)
(3)
Thus, each image pixel is scaled down to a value between 0-1. Normalized pixels can be represented in 2 bits instead of 3 bits using RGB.
3. DEEP CNN MODEL
We use deep convolutional neural network to classify images into cell types. The subsections cover the working and applied implementation of the model.
3.1. Model Working
Convolutional Neural Network is extensively used for image classification because it uses neighboring pixel information to down sample the image effectively and
then performs predictions, which results in high accuracies [10][20]. Additionally, they work using neural networks that are scalable for large datasets. It comprises of a complex feed forward neural network involving convolutions, pooling and classification. The term convolution refers to calculation of similarities between two functions when one function passes (or convolutes) over other. Pooling is used to reduce the number of parameters when the image is too large, followed by classification based on training and improvement by backpropagation. An image according to the computer is perceived as a collection of numbers or pixels organized in three dimensions viz. width, height and depth [15]. Thus, matrix multiplications are the core operations of CNN. The functioning of CNN can be divided into two parts as feature extraction and classification [16].
Convolution is mainly responsible for feature extraction. It produces a feature map by sliding a filter (feature vector) over input data. This is obtained by performing matrix multiplication between the two at every location to extract different parts of the image and sum up the result onto a feature map. This operation is performed multiple times using different values of filters to obtain multiple feature maps [14]. This is the output of the convolution layer. The output in the real world is non-negative and non-linear thus, an activation function is applied on it. In This paper uses Rectifier Activation function to introduce non-linearity. In order to prevent the feature map from shrinking, padding is performed which is done by appending zeros surrounding the input. It is common to add a pooling layer between the convolution layers to reduce the number of computations in the network by reducing the dimensionality [15]. Various types of pooling like, max pooling (taking the maximum of neighboring pixels after convoluting), average pooling (taking the average of neighboring pixels after convoluting) and sum pooling (considering all neighboring pixel values) [16] can be used.
3579 which provides a binary output of whether the input
image belongs to a particular class or not.
3.2. Model Representation
The model can be represented using multiple layers discussed above to implement the classification.
Multiple layers of convolution and pooling are added in the beginning to extract all possible features.
Figure 5 shows the implementation layers involved from training to predicting phases. After testing multiple values for hyperparameters best accuracies were obtained with 32 filters, each filter of size 3x3, and using Rectified Linear Unit (ReLU) activation function for imposing non-linearity. A dropout of 25% is also applied to handle overfitting. The feature maps are padded so that the input size is equal to the output size to avoid feature map shrinking. In order to obtain high accuracies, the orientations of cell location in each image are considered. For this, the ImageDataGenerator in Python that generates a batch of tensor images with real-time data augmentation is used. Rotations, height and width shifting, normalizations, and flipping on original image to create a set of images containing the white blood cell type with different orientations are then applied. This ensures that the implemented model will take care of same cells positioned in different angles and will be classified correctly. The model is then run for 30 epochs, i.e. the weights are
updated 30 times by performing backpropagation to obtain an accuracy of 83%.
4. RESULTS
As seen in figure 6, with increasing number of epochs, the model obtains improved accuracies. This is because, using the phenomenon of back-propagation the model adjusts weights in the intermediate layers thus improving its understanding of image features with every iteration. The validation set accuracy
remained near constant after 30 epochs.
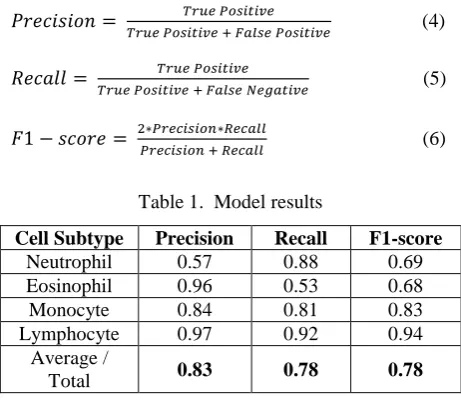
The following metrics as shown in equations 4, 5, and 6 are used to evaluate the model:
(4)
(5)
(6)
Table 1. Model results
Cell Subtype Precision Recall F1-score
Neutrophil 0.57 0.88 0.69
Eosinophil 0.96 0.53 0.68
Monocyte 0.84 0.81 0.83
Lymphocyte 0.97 0.92 0.94
Average /
Total 0.83 0.78 0.78
As shown in table 1, a value of 83% is obtained for precision, which means that 83% of the times we got the correct (expected) result. Recall is a measure of the ability of a prediction model to select instances of a certain class from a data set. A recall average of 78% shows that 78% of the times the model was correctly able to classify a particular class. F1 score conveys the balance between precision and recall. We obtain an F1-score of 78%.
Fig. 5. Model layers
Fig. 6. Change in the accuracy with the increasing epochs [x-axis indicates the number of epochs where
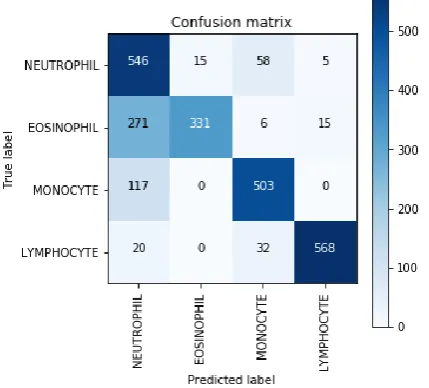
3580 Figure 7 displays a confusion matrix, which is used to
examine how correctly a model predicts a particular
the classifier also classified them as neutrophil, and 15 were neutrophil but the model classified them incorrectly as eosinophil. We observe that the erroneously classified images are quite less compared to the correctly classified ones.
5. CONCLUSION
In this paper, a classification model using Convolutional Neural Network based on deep learning was implemented, to classify the image dataset into four WBCs- Neutrophils, Lymphocytes, Eosinophils, and Monocytes. The model achieved a precision of 83% on the testing dataset. Deep learning proves significantly better than the traditional approach as it is able to identify the minute intricacies within the image to classify them accurately [17]. The original image dataset had imbalanced class sizes. Using augmented images restored the class balance and also created greater variation in the images, improving the quality of data for training the model. Deep learning also provides enhanced feature extraction, and is able to learn complex non-linear relations between dependent and independent variables [18]. This implementation of deep learning provides a scalable approach [19] and results in enhanced performance with the increase in the image dataset. This model can be implemented as a diagnostic system in clinics to
determine the WBC count, and thus, determine the
anomalies and various blood related diseases. (A.1)
REFERENCES
[1] M. J. Macawile, V. V. Quiñones, A. Ballado, J. D. Cruz and M. V. Caya, "White blood cell classification and counting using convolutional neural network," 2018 3rd International Conference on Control and Robotics Engineering (ICCRE), Nagoya, 2018, pp. 259-263.
[4] Advantages and Disadvantages of Automated Hematology Analyzer. [online] Available: https://www.scribd.com/document/224004525/Ad vantages-and-Disadvantages-of-Automated-Hematology-Analyzer-20140514-153329. [5] Dennis B. DeNicola, Advances in Hematology
Analyzers, Topics in Companion Animal
Medicine, Volume 26, Issue 2, 2011, Pages 52-61, ISSN 1938-9736.
[6] Igor Kononenko, Machine learning for medical diagnosis: history, state of the art and perspective, Artificial Intelligence in Medicine, Volume 23, Issue 1, 2001, Pages 89-109, ISSN 0933-3657, https://doi.org/10.1016/S0933-3657(01)00077-X. [7] Tamalika Chaira, Accurate segmentation of
leukocyte in blood cell images using Atanassov's intuitionistic fuzzy and interval Type II fuzzy set theory, Micron, Volume 61, 2014, Pages 1-8, ISSN 0968-4328.
[8] LeCun Y, Bengio Y (1995) Convolutional networks for images, speech, and time series. In: Arbib MA (ed) The handbook of brain theory and neural networks. MIT Press, Cambridge, MA, USA, pp 255–258.
[9] Krizhevsky, Alex & Sutskever, Ilya & E. Hinton, Geoffrey. (2012). ImageNet Classification with Deep Convolutional Neural Networks. Neural
Information Processing Systems. 25.
10.1145/3065386.
[10]Anjali Gautam, Harvindra Bhadauria,
―Classification of white blood cells based on morphological features‖ Proceedings of the 2014 International Conference on Advances in Computing, Communications and Informatics. [11]Pixel Intensity histogram characteristics: Basics
of Image Processing and machine vision [online] Available:https://www.allaboutcircuits.com/techn ical-articles/image-histogram-characteristics-machine-learning-image-processing/
[12]Normalized RGB [online] Available:
3581
[13]Pixel Values [online] Available:
https://homepages.inf.ed.ac.uk/rbf/HIPR2/value.ht m
[14]Dhvani Kansara, Rashika Singh, Deep Sanghavi, Pratik Kanani, "Improving Accuracy Of Real Estate Valuation Using Stacked Regression", International Journal of Engineering Development
and Research (IJEDR), ISSN:2321-9939,
Volume.6, Issue 3, pp.571-577, September 2018. [15]Understanding of Convolutional Neural Network
(CNN) — Deep Learning [online] Available: https://medium.com/@RaghavPrabhu/understandi ng-of-convolutional-neural-network-cnn-deep-learning-99760835f148.
[16]An intuitive guide to Convolutional Neural
Networks. [online] Available:
https://medium.freecodecamp.org/an-intuitive- guide-to-convolutional-neural-networks-260c2de0a050
[17]Priyesh Patel, Meet Nandu, Saifil Momin, Neepa Shah, "Military Adaptation of Self-driving System using Reinforcement Learning", International Journal of Emerging Technologies and Innovative Research (www.jetir.org), ISSN: 2349-5162, Vol.5, Issue 12, page no.431-437, December-2018.
[18]Deep Sanghavi, Jay Parekh, Shaunak Sompura, Pratik Kanani, "Data Visualisation and Improving Accuracy of Attrition Using Stacked Classifier", International Journal of Engineering Development
and Research (IJEDR), ISSN:2321-9939,
Volume.6, Issue 4, pp.284-293, November 2018 [19]B. M. Wilamowski, B. Wu and J. Korniak, "Big
data and deep learning," 2016 IEEE 20th Jubilee
International Conference on Intelligent
Engineering Systems (INES), Budapest, 2016, pp. 11-16.