Available online: https://edupediapublications.org/journals/index.php/IJR/ P a g e | 589
Detection of ARMD and Grading of Maculopathy Severity
Levels from Retinal Fundus Images
G Rajinikanth Reddy , M Narsing Yadav , R Raja Kishore
(PG Scholar)1 (Professor, Ph.D)2 (M.Tech, Assistant Professor)3
Malla Reddy Institute of Engineering and Technology, Medchal, Secunderabad, Telangana 500014
[email protected][email protected]2[email protected]3
Abstract
Age Related Macular Degeneration (ARMD) is a retinal disorder usually found in old people, this affects the central vision, but not the peripheral vision. The objective of this work is to develop an automated system for the classification of ARMD using digital fundus images and maculopathy severity levels, so that an intelligent computer aided system can be developed for the diagnosis of ARMD and maculopathy. Diagnosis and treatment of ARMD and maculopathy in the earlier stages helps to cure the disease and According to American Society of Retinal Specialists, about fifteen million people around the globe are suffering will save many from vision loss. ARMD may result from the ageing and thinning of macular tissues, depositing of pigment in the macula, growth of abnormal blood vessels or a combination of these processes. So, it is possible to detect and
diagnosis the disease by analyzing such
abnormalities present in the retinal images. The abnormalities should have significant difference with the neighboring tissues and by properly segmenting such regions, as a result macular degeneration is predicted whether it is present or not. Here the abnormalities are segmented from the fundus images after multi stage segmentation processes. Threshold based segmentation is used along with Canny edge detection algorithm to efficiently identify the abnormality region. Threshold based binary classification of the analyzed image is evaluated by finding the extent of abnormalities present in the image.
Diabetic maculopathy is the major cause of irreversible vision loss due to retinopathy and is found in 10% of the world diabetic population. Compulsory mass screening will help to identify the
maculopathy at early stage and reduce the risk of severe vision loss. In this paper, we present a computer based system for automatic detection and grading of diabetic maculopathy severity level without manual intervention. The optic disc is detected automatically and its location and diameter is used to detect fovea and to mark the macular region respectively. Next, hard exudates are detected using clustering and mathematical morphological techniques. Based on the location of exudates in marked macular region the severity level of maculopathy is classified into mild, moderate and severe.
1. INTRODUCTION
Image processing and analysis can greatly assist human experts (e.g. radiologists or ophthalmologists) in all medical fields. In addition, image processing methods have been widely used in the early clinical diagnoses, treatment and monitoring of various diseases. In this way, a physician can obtain decision support for detecting diseases in processed images (Osareh 2004; Patton et al. 2006). Ophthalmologists have long used fundus images to assess the health condition of an eye. Color fundus images provide anatomical information about the retina and are more suitable for automatic analysis systems, as they do not require injecting fluorescein or indocyanine green dye. In general, patients do not require medication to dilate their pupils before digital color fundus images can be obtained, and acquiring the images does not require skilled operators, as does ophthalmoscopy. Moreover, the fundus can be observed non-invasively and directly through fundus images.
Available online: https://edupediapublications.org/journals/index.php/IJR/ P a g e | 590
Important structures of the normal retina captured in a fundus image include the optic disc (OD), macula and blood vessels. Exudates, drusen deposits, microaneurysms and haemorrhages are the primary abnormal features that can be identified in a fundus image. These features provide information about the pathological changes caused by several eye diseases, such as age-related macular degeneration (ARMD), glaucoma, diabetic retinopathy and optic nerve disease, which are the leading causes of blindness or excessive vision disorders.
Figure 1. An example of color fundus images.
This paper presents a method for processing and feature determination of OD, macula and ARMD pathologies in fundus images using an automatic segmentation method. The macula is composed of millions of packed cone and rod cells that are responsive to light. ARMD, a degenerative condition of the macula, is an irreversible vision disorder. It causes a deterioration of central vision, such as is normally associated with ageing, which leads to retinal arteriosclerosis. As a result, patients lose their central vision and are not able to read or recognise faces properly, although they are able to continue other daily activities, as their peripheral vision remains intact. Therefore, the condition does not lead to total blindness. It can progress either slowly or rapidly, and patients may notice little change in their vision or experience a significant loss. Early detection of ARMD can prevent further vision loss (Law et al. 2004; Bartlett and Eperjesi 2007).
2. LITERATURE REVIEW
The drusen is affected the area of the retina. Drusen are small yellow deposits in the retina that act like trash cans and collect waste products. They can multiply progress and grow larger, and can overflow.
This growth and overflow cause blockage of nutrients to the retina and RPE cells. When RPE cells die, the overlying retina can begin to deteriorate. This is called as atrophic macular degeneration. This can be detected and find the size, area using combined local intensity distribution, adaptive intensity thresholding and edge information [1].
Automated diagnosis of age related macular degeneration from color fundus images. The automated image processing is used to early detection of macular degeneration by detecting changes in blood vessel and patterns in the retina. It’s a gradual loss of vision by oxidation of macula. Detection of ARMD is done by using probabilistic neural network [2].
The retinal images are contains the two main structures of optic disc and fovea. To develop an automatic approach for detection of eye diseases like glaucoma and macular edema. This method is used to detect the fovea. The morphological operations are used to detect the fovea [3]. The automated detection of blood vessels are plays an important role in the many eye diseases as well as systematic diseases. The matched filters are used to detect the blood vessels [4].
3. PROPOSED METHOD
A. Retinal fundus image
High resolution fundus images from the Pattern Recognition Lab (PRL) were used as the fundus image databases which were obtained from
the department of ophthalmology,
FriedrichAlexander University Erlangen-Nuremberg (Germany). The first step of the program is to read the test image from the fundus database and save to variable for further image processing stages.
B. Conversion from color to gray
Available online: https://edupediapublications.org/journals/index.php/IJR/ P a g e | 591
method, which uses a weighted average to account for human perception. The formula for luminosity is
0.21𝑅 + 0.72𝐺 + 0.07𝐵 (3.1)
Fig.2 Block diagram of the proposed method in algorithm
C. Illumination enhancement
The gray level image needs contrast adjustments in order to make the edges more visible. Here spatial domain enhancement techniques are used. They are allowed to merge with the image plane itself and are built on direct manipulation of pixels in an image. These operations are formulated by
𝑔 𝑥, 𝑦 = 𝑇 𝑓 𝑥, 𝑦 3.2
Where, 𝑔 is the output image
𝑓 is the input image
𝑇 is an operation on f defined over some neighbourhood of (𝑥, 𝑦)
Frequency domain with DFT is performed by 2D convolution.
Spatial Domain:
𝑔 𝑥, 𝑦 = 𝑓 𝑥, 𝑦 ∗ 𝑥, 𝑦 3.3
Frequency Domain:
𝐺(𝑤1, 𝑤 2)
= 𝐹(𝑤1, 𝑤 2)𝐻(𝑤1, 𝑤 2) (3.4)
D. Segmentation of optic disc
Optic disc is the brightest part in the normal fundus images, which can be seen as a pale, round or vertically slightly oval disk. Optic disc is the entrance region of blood vessels and optic nerves to the retina, it often works as a landmark, and reference for the other features in the retinal fundus image [12]. The change in the shape, color or depth of optic disk is an indicator of various ophthalmic pathologies.
𝑇 = 𝑇 𝑥, 𝑦, 𝑝 𝑥, 𝑦 , 𝑓 𝑥, 𝑦 (3.5)
Where 𝑓(𝑥, 𝑦) is the gray-level of the pixel in location (𝑥, 𝑦) and 𝑝(𝑥, 𝑦) is some local property of the pixel, for example, the mean gray-level of the pixel neighbor-hood. The resultant image 𝑔(𝑥, 𝑦) can be defined as
𝑔 𝑥, 𝑦 = 1, 𝑖𝑓 𝑓 𝑥, 𝑦 ≥ 𝑇
0, 𝑖𝑓 𝑓 𝑥, 𝑦 < 𝑇 (3.6)
When T depends only on 𝑓(𝑥, 𝑦), the threshold is called global. If T also depends on 𝑝(𝑥, 𝑦), the threshold is called local. The threshold is called dynamic or adaptive if 𝑇 depends also on spatial coordinates 𝑥 and 𝑦.
E. Extraction of abnormalities
Available online: https://edupediapublications.org/journals/index.php/IJR/ P a g e | 592
vary in size and are waxy in appearance with relatively distinct margins. The segment region includes both abnormalities and the vasculature region. So, the next step is to segment the abnormalities alone. For this the contrast enhanced gray level mage is taken. The image is first converted to its binary version so it could extract the regions with high illumination values. Thus, the extracted region will cover the abnormality areas and also other bright region. The abnormality area is shown in the red circle in which a radius is set where the abnormality area is located.
F. Feature extraction and classification
Feature extraction method are employed here in order to capture the visual contents of images which are used for retrieval and indexing. The input data is transformed into the sets of features.Since the ARMD areas are segmented, if present any, it is possible to predict whether the image is affected by the disease or not by calculating the areas with ARMD spots. Here threshold based binary classification are used. Here the analyzed image is evaluated by finding the extend of abnormalities present in the image and also edge based extraction method is used. They are also known as unsupervised classification. In this case only the image characters are used in which there is less information in the area to be classified. They mainly use the population statics such as mean and variance.
Where m- number of bands and n- Number of pixels The number of band and number of pixels are likely to be used. It is clear to understand that the images with ARMD, will have more white regions when compared to a normal one. When compared to a normal the out of the abnormal pixels are very few
while the white areas in ARMD affected images is more.
G. Optic Disc and Macula Detection
The automatic localization of optic disc is a prerequisite for identification of other retinal anatomical structures and lesions in an image. Its size and location is used to find the center of macular region in the image. Masking of optic disc is required during the exudate classification process as it has similar attributes to the exudates in terms of colour. Optic disc and cup are brighter than all other features and it is approximately about 100 pixels in diameter in a standard fundus image. Optimal thresholding method based on approximation of the histogram of an image is applied to segment the brightest regions in the image. Thresholding leads to maximization of gray level variance between object and background. When applied to the green component image it results in number of isolated connected regions because of crossing blood vessels and exudates. All the connected components in the thresholded image are labeled, total number of pixels in the component and mean spatial co-ordinates of each connected region is calculated. The component having the maximum number of pixels is assumed to be having the optic cup part of the optic disc and is considered to be the primary region of interest. Components whose mean spatial coordinates within 50 to 60 pixels distance from the mean spatial coordinates of the largest component are merged with it and new mean co-ordinate is calculated. If this region exceeds 80 pixels in diameter, then the process is stopped and circle is drawn to mark its location and center. Otherwise the threshold is decremented by one and applied to the initial image only in the local rectangular region around the candidate region. This iterative process is repeated until an optimal size of the optic disc has been reached.
Available online: https://edupediapublications.org/journals/index.php/IJR/ P a g e | 593
optic disc against the horizon is -5.6 ±3.3 degrees. Since the location of macula varies from individual to individual, a rectangular search area is localized as shown in Fig. 3(a). The width of the search area is taken equal to 2DD as the mean angle between the fovea and the center of the optic disc to the horizontal, as mentioned, varies between -2.3 to -8.9 degrees. A small pixel window is formed to scan the entire area and the average intensity is calculated. The center of window having the lowest average intensity is taken as center of the macular region. Fig. 3(b) shows the marked optic disc and macula.
Figure 3. Detection of Optic disc and Macula (a) Macular region search area; (b) Marked Optic disc
and Macula
H.Hard Exudates Detection
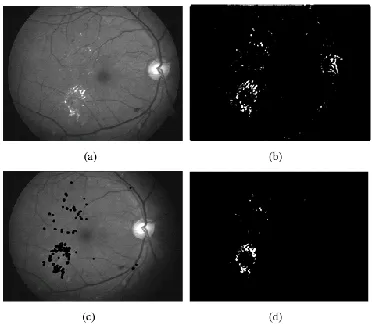
The Hard exudates are considered to be one of the bright intensity regions in the retinal images and these appear highly contrasted in the green channel image. Initially the possible exudates regions are coarse segmented by clustering technique [8]. Clustering involves separating possible exudate regions and background region. In image space, clustering is performed on the intensity difference image. Fig. 4(b) shows the possible exudate regions as a result of clustering in the image space.
Figure 4. Detection of Hard exudates (a) Intensity difference image; (b) candidate exudates regions; (c)
Overlaid candidate regions; (d) Final detected exudates
Next the optic disc area is eliminated from the clustered image to avoid false positives. The fine segmentation of exudate regions is done using morphological reconstruction [7]. Candidate exudate regions are overlaid on the green channel image to get marker image and the original green channel image is used as a mask. The morphological reconstruction by dilation is then applied on the overlaid image and it is repeated until the contour of marker image fits under the mask image to get reconstructed image. Finally, the exudate regions are obtained by thresholding the difference between the original image and the reconstructed image as in the Fig. 4(d). Since the threshold varies from one image to another, a local entropic threshold for each reconstructed image is calculated.
I. Automatic Grading of Maculopathy
Available online: https://edupediapublications.org/journals/index.php/IJR/ P a g e | 594
If exudates are present and are outside the 2DD region then it is classified as clinically non significant macular edema and ophthalmologists watch the progress of exudates with proper treatment. Presence of exudates within the 2DD is classified asclinically significant macular edema (CSME) and it has to be treated by laser. In case of CSME, the presence of exudates outside the 1DD region is termed as mild. The moderate case is one with presence of exudates within the 1DD region not involving the center of the macula. In severe case, the exudates are present inside the 1/3 DD region obscuring the center of macula resulting in the most sight threatening stage of diabetic maculopathy.
4 SIMULATION RESULTS
Figure 5. Original image
Figure 6. image after adjust intensity
Figure 7. imclose -to remove blood vessels
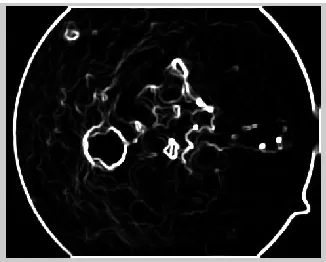
Figure 8: image after colfilt
Available online: https://edupediapublications.org/journals/index.php/IJR/ P a g e | 595
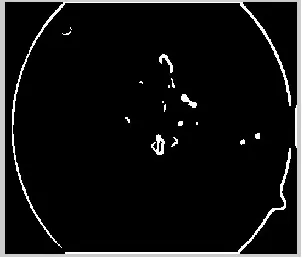
Figure 10: Circular binary mask for optic disc
Figure 11: Optic disc eliminated
Figure 12: Remove circular border
Figure 13. GUI of retinal image
5 CONCLUSION
The ocular fundus is the only part in the human body in which the vascular network can be detected directly and noninvasively. A lot of pathological information about eye diseases such as Glaucoma, Central Serous Retinopathy (CSR) and early signs of systemic diseases like ARMD, diabetes diseases can
be found and diagnosed. In the present work concentrated for the diagnosis of ARMD. Automatic computer aided diagnosis of diseases plays an important part in our present world where the conventional of diagnosis system have several disadvantages like high cost, time lag,lack of sufficient medical practitioners etc. The detection of retinal disorders like ARMD, diabetic retinopathy, glaucoma etc. from digital fundus image will be much helpful in the medical field which can reduce the time and cost required for diagnosis and detection.
The present work concentrates on the diagnosis of ARMD and the proposed system can be used to detect several factors from a digital fundus images like optic disc, vasculature map, lesions etc. The system can also be modified to implement an efficient system which can be used to study various features of retinal objects. Digital image processing techniques will be helpful to detect even the small disorders when compared to human eyes. The computer aided detection can be used to study, diagnosis, and for curing of retinal disorders in a better way. The fundus camera is used to diagnose these diseases. This automated system can be extensively used in mass screening of patients, which helps ophthalmologists with or without any expertise in diagnosis of the above diseases.
Available online: https://edupediapublications.org/journals/index.php/IJR/ P a g e | 596
without the help of medical experts, get the print out of the risk level of the diseases and can decide for further detailed clinical investigation and treatment. This kind of facility is more suitable where mass screening of patients is required and the places where hospital facility is less.
REFERENCES
[1] AlauddinBhuiyan; C. Karmakar; Di Xiao; KotagiriRamamohanarao; Yogi Kanagasingam” Drusen quantification for early identification of age related macular degeneration (AMD) using color fundus imaging” 2013 35th Annual International Conference of the IEEE Engineering in Medicine and Biology Society (EMBC), 2013.
[2] R. Priya; P. Aruna” Automated diagnosis of Age-related macular degeneration from color retinal fundus images” 2011 3rd International Conference on Electronics Computer Technology, 2011, Volume: 2.
[3] Khawaja Muhammad Asim; A. Basit; Abdul Jalil” Detection and localization of fovea in human retinal fundus images” International Conference on Emerging Technologies, 2011.
[4] Jan Odstrcilik; RadimKolar; Attila Budai; Joachim Hornegger; Jiri Jan; Jiri Gazarek; Tomas Kubena; PavelCernosek; Ondrej Svoboda; Elli Angelopoulou” Retinal vessel segmentation by improved matched filtering: evaluation on a new high-resolution fundus image database” Volume: 7, Issue: 4, 2013.
[5]. L.D. Hubbard, R. P. Danis, M.W. Neider, D.W. Thayer, H.D. Wabers, J.K. White, A.J. Pugliese, and M.F. Pugliese “Brightness, Contrast, and Color Balance of Digital versus Film Retinal Images in the Age-Related Eye Disease Study 2”, Journal of Investigative Ophthalmology and Visual Science 49, pp 3269-3282, 2008.
[6]. Dinu, H. Zhao, and P.L. Miller “Integrating Domain Knowledge with Statistical and Data Mining Methods for High-Density Genomic SNP Disease Association Analysis”, Journal of Biomedical Informatics 40, pp 750760, 2007.
[7]. S.V. Charles “Computer Vision Algorithms for Retinal Image Analysis: Current Results and Future directions”, Lecture Notes in Computer Science: Computer Vision for Biomedical Image Applications 3765/2005, pp 31-50, 2005.
[8]. M.J. Swain, and D.H. Ballard “Color Indexing”, International Journal of Computer Vision 7(1), pp 11-32, 1991.
[9]. K.L. Wee, and R. Li “The Analysis and
Applications of Adaptive-Binning Color
Histograms”, Computer Vision and Image Understanding 94, pp. 67-91, 2003.
[10]. F. Li, Q. Dai, W. Xu, and G. Er “Histogram Mining Based on Markov Chain and Its Application to Image Categorization”, Signal Processing: Image Communication 22, pp 785-796, 2007.
[11] Priya, R.; Aruna, P., "Automated diagnosis of Agerelated macular degeneration from color retinal fundus images," in Electronics Computer Technology (ICECT), 2011 3rd International Conference on , vol.2, no., pp.227-230, 8-10 April 2011
[12] Sinthanayothin. C, Boyce. J.F, Cook. H.L, Williamson. T.H, “Automated localisation of the optic disc,fovea, and retinal blood vessels from digital colour fundus images”, Br. J. Ophthalmol. 83, 1999, pp. 902– 910. 2.17.