
Measurements of event properties and multi-differential jet cross
sections and impact of CMS measurements on Proton Structure
and QCD parameters
AnterpreetKaurfor the CMS Collaboration
Panjab University, Chandigarh, India
Abstract.We present results on the measurements of characteristics of events with jets including jet-charge, investigations of shapes and jet mass distributions. The measure-ments are compared to theoretical predictions including those matched to parton shower
and hadronization. Multi-differential jet cross sections are also presented over a wide
range in transverse momenta from inclusive jets to multi-jet final states. These measure-ments have an impact on the determination of the strong coupling constant as well as on parton distribution functions (PDFs) and are helpful in the treatment of heavy flavours in QCD analyses. We also show angular correlations in multi-jet events at highest center-of-mass energies and compare the measurements to theoretical predictions including higher
order parton radiation and coherence effects. Measurements of cross sections of jet and
top-quark pair production are in particular sensitive to the gluon distribution in the proton, while the electroweak boson production - inclusive or associated with charm or beauty quarks - gives insight into the flavour separation of the proton sea and to the treatment of heavy quarks in PDF-related studies.
1 Introduction
Jets are narrow collimated cones of stable particles (mainly hadrons) produced by the hadronization of partons (quarks or gluons) in high-energy particle interactions. The strong interactions between the partons are described by the theory called Quantum Chromodynamics (QCD). In a hard scattering
process, partons are produced with high-transverse momentum (pT) and give rise to a parton shower
(PS) by emission of additional gluons and production of quark-antiquark pairs. This phase can be described by perturbative QCD (pQCD) approximations. In the non-perturbative phase, the colored partons hadronize into colorless objects in the form of collimated sprays known as jets. Jets are mea-sured in particle detectors and studied in order to determine the properties of the original quarks. The distribution of particles and energy within a jet can also reveal information about both the production mechanism and underlying physics.
CMS [1] is one of the two multipurpose experiments at the Large Hadron Collider (LHC) at
CERN, designed to see a wide range of particles and phenomena produced in high-energy proton-proton (pp) collisions in the LHC. This paper presents several studies of jet production performed by
CMS with data from proton-proton collisions taken at centre-of-mass energies (√s) of 8 and 13 TeV
during Run 1 and 2 of the LHC respectively, from 2012 until 2016. The CMS detector covers a solid
angle of almost 4πand consists of precise tracking devices around the interaction point, surrounded
by calorimeters and muon chambers. In the CMS experiment, all particles are reconstructed and identified using a particle-flow (PF) algorithm, which combines the information from the individual
subdetectors [2]. The four-vectors of particle candidates, reconstructed by the above technique, are
used as input to the anti-ktjet clustering algorithm [3]. The clustering is performed within the FastJet
package [4] using four-momentum summation. A factorized jet calibration procedure with corrections
for pile-up and jet energy scale are applied. The data is also corrected for detector effects using
an unfolding procedure which allows direct comparisons with theory. Theoretical predictions are obtained from various Monte Carlo (MC) event generators. To compare with measurements, the
parton-level calculations must be complemented with corrections for nonperturbative (NP) effects
that involve the modeling of hadronization (HAD) and multiparton interactions (MPI).
2 QCD multijet production
Inclusive jet production (p+p→ jet+X) is a key process to test predictions of perturbative QCD
(pQCD) over a wide region in phase space. It probes the parton-parton interaction and is sensitive
to the value of the strong coupling constant,αS and also provides the important constraints on the
description of the proton structure, expressed by the parton distribution functions (PDFs).
2.1 Inclusive jet production
The double-differential inclusive jet cross sections [5] has been measured using data collected at
√s
=8 TeV corresponding to an integrated luminosity of 19.7 fb−1. The measurement is presented
as a function of jet transverse momentum pTand absolute rapidity|y|and covers a large range in jet
pTfrom 74 GeV up to 2.5 TeV, in six rapidity bins up to|y|=3.0. The region of low jet pT, in particular
the range from 21 to 74 GeV, has also been studied up to|y|=4.7, using a dedicated low-pileup
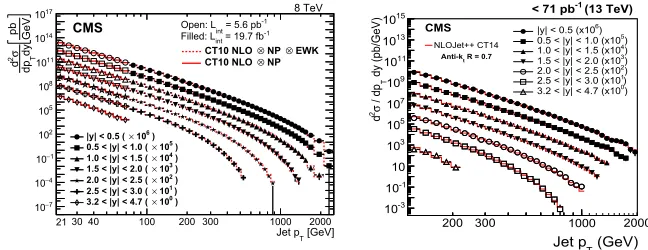
5.6 pb−1data sample. Perturbative QCD, supplemented by a small nonperturbative and electroweak
corrections, describes the data over a wide range of jet pTandyas shown in Figure1(left). Using the
probed pTrange and six different rapidity bins, the high-pTjet cross section measurements are used
to extract the value of the strong coupling constant. The best fitted value isαs(MZ)=0.1164+−00..00600043
using the CT10 NLO PDF set. The running of the strong coupling constant as a function of the energy
scale Q,αS(Q), measured for nine different values of energy scale between 86 GeV and 1.5 TeV, is
in good agreement with previous experiments and extends the measurement to the highest values of
the energy scale as shown in Fig.3. This measurement also probes hadronic parton-parton interaction
over a wide range of x and Q. The QCD analysis of these data together with HERA DIS measurements
illustrates the potential of the high-pTjet cross sections to provide important constraints on the gluon
PDF in a new kinematic regime.
Similarly a measurement of the double-differential cross section as a function of jet pTand
abso-lute rapidity|y|has been performed for two jet sizes R=0.4 and 0.7 using data collected at √s=13
TeV [6]. Data samples corresponding to integrated luminosities of 71 pb−1and 44 pb−1are used for
absolute rapidities|y|<3 and for the forward region 3.2<|y|<4.7, respectively. The comparison
between data and predictions at NLO in perturbative QCD including corrections for nonperturbative
and electroweak effects are shown in Fig. 1(right) and it is observed that jet cross sections for the
larger jet size of R=0.7 are accurately described, while for R=0.4 theory overestimates the cross
section by 5–10% almost globally. This measurement is a first indication that jet physics is as well
understood at √s=13 TeV as at smaller centre-of-mass energies in the phase space accessible with
angle of almost 4πand consists of precise tracking devices around the interaction point, surrounded
by calorimeters and muon chambers. In the CMS experiment, all particles are reconstructed and identified using a particle-flow (PF) algorithm, which combines the information from the individual
subdetectors [2]. The four-vectors of particle candidates, reconstructed by the above technique, are
used as input to the anti-ktjet clustering algorithm [3]. The clustering is performed within the FastJet
package [4] using four-momentum summation. A factorized jet calibration procedure with corrections
for pile-up and jet energy scale are applied. The data is also corrected for detector effects using
an unfolding procedure which allows direct comparisons with theory. Theoretical predictions are obtained from various Monte Carlo (MC) event generators. To compare with measurements, the
parton-level calculations must be complemented with corrections for nonperturbative (NP) effects
that involve the modeling of hadronization (HAD) and multiparton interactions (MPI).
2 QCD multijet production
Inclusive jet production (p+p→ jet+X) is a key process to test predictions of perturbative QCD
(pQCD) over a wide region in phase space. It probes the parton-parton interaction and is sensitive
to the value of the strong coupling constant,αS and also provides the important constraints on the
description of the proton structure, expressed by the parton distribution functions (PDFs).
2.1 Inclusive jet production
The double-differential inclusive jet cross sections [5] has been measured using data collected at
√s
=8 TeV corresponding to an integrated luminosity of 19.7 fb−1. The measurement is presented
as a function of jet transverse momentum pTand absolute rapidity|y|and covers a large range in jet
pTfrom 74 GeV up to 2.5 TeV, in six rapidity bins up to|y|=3.0. The region of low jet pT, in particular
the range from 21 to 74 GeV, has also been studied up to |y|=4.7, using a dedicated low-pileup
5.6 pb−1 data sample. Perturbative QCD, supplemented by a small nonperturbative and electroweak
corrections, describes the data over a wide range of jet pTandyas shown in Figure1(left). Using the
probed pT range and six different rapidity bins, the high-pTjet cross section measurements are used
to extract the value of the strong coupling constant. The best fitted value isαs(MZ)=0.1164+−00..00600043
using the CT10 NLO PDF set. The running of the strong coupling constant as a function of the energy
scale Q,αS(Q), measured for nine different values of energy scale between 86 GeV and 1.5 TeV, is
in good agreement with previous experiments and extends the measurement to the highest values of
the energy scale as shown in Fig.3. This measurement also probes hadronic parton-parton interaction
over a wide range of x and Q. The QCD analysis of these data together with HERA DIS measurements
illustrates the potential of the high-pTjet cross sections to provide important constraints on the gluon
PDF in a new kinematic regime.
Similarly a measurement of the double-differential cross section as a function of jet pT and
abso-lute rapidity|y|has been performed for two jet sizes R=0.4 and 0.7 using data collected at √s=13
TeV [6]. Data samples corresponding to integrated luminosities of 71 pb−1and 44 pb−1are used for
absolute rapidities|y|<3 and for the forward region 3.2<|y|<4.7, respectively. The comparison
between data and predictions at NLO in perturbative QCD including corrections for nonperturbative
and electroweak effects are shown in Fig. 1(right) and it is observed that jet cross sections for the
larger jet size of R=0.7 are accurately described, while for R=0.4 theory overestimates the cross
section by 5–10% almost globally. This measurement is a first indication that jet physics is as well
understood at √s=13 TeV as at smaller centre-of-mass energies in the phase space accessible with
the new data.
[GeV]
T
Jet p
30 40 100 200 300 1000 2000
GeV
pb
dyT
dp
σ
2d
7 −
10
4 −
10
1 −
10
2
10
5
10
8
10
11
10
14
10
17
10 8 TeV
CMS
21
-1
= 5.6 pb
int
Open: L
-1
= 19.7 fb
int
Filled: L
EWK
⊗
NP
⊗
CT10 NLO NP
⊗
CT10 NLO
)
6
10
×
|y| < 0.5 ( )
5
10
×
0.5 < |y| < 1.0 ( )
4
10
×
1.0 < |y| < 1.5 ( )
3
10
×
1.5 < |y| < 2.0 ( )
2
10
×
2.0 < |y| < 2.5 ( )
1
10
×
2.5 < |y| < 3.0 ( )
0
10
×
3.2 < |y| < 4.7 (
(GeV) T Jet p
200 300 1000 2000 dy (pb/GeV)T
/ dp
σ
2d
-3
10
-1
10 10
3
10
5
10
7
10
9
10
11
10
13
10
15
10
)
6
|y| < 0.5 (x10 )
5
0.5 < |y| < 1.0 (x10 )
4
1.0 < |y| < 1.5 (x10 )
3
1.5 < |y| < 2.0 (x10 )
2
2.0 < |y| < 2.5 (x10 )
1
2.5 < |y| < 3.0 (x10 )
0
3.2 < |y| < 4.7 (x10 NLOJet++ CT14
(13 TeV)
-1
< 71 pb
R = 0.7 t Anti-k
CMS
Figure 1. Double-differential inclusive jet cross sections as function of jet pT for six different|y|bins at an
interval of∆|y|=0.5. Left [5] : Data (open points representing the low-pTanalysis, filled points representing
the high-pT one) and NLO predictions based on the CT10 PDF set corrected for the nonperturbative factor for
the low-pTdata (solid line) and the NP and electroweak correction factors for the high-pTdata (dashed line), at
√s
=8 TeV are shown. Right [6] : Data (points) and predictions from NLOJet++based on the CT14 PDF set
corrected for the NP and electroweak effects (line), at √s=13 TeV are shown.
2.2 Triple differential dijets
Measurements of dijet cross sections can be used to thoroughly test predictions of perturbative QCD (pQCD) at high energies and to constrain parton distribution functions (PDFs). A measurement of the
triple-differential dijet cross section has been performed using CMS data collected at √s =8 TeV,
as a function of the average transverse momentumpT,avg = 12(pT,1 + pT,2) of the two leading jets,
half of their rapidity separationy = 1
2|y1−y2|, and the boost of the dijet systemyb = 12|y1 + y2|
[7]. The data are found to be well described by NLO predictions corrected for nonperturbative and
electroweak effects, except for highly boosted event topologies that suffer from large uncertainties in
parton distribution functions (PDFs) as shown in Fig.2(left). For large values ofyb, the momentum
fractions carried by the incoming partons must correspond to one large and one small value, while
for smallybthe momentum fractions must be approximately equal. In addition, for high transverse
momenta of the jets, x values are probed above 0.1, where the proton PDFs are less precisely known.
From Fig. 2(right), it is observed that the precise data constrain the PDFs, especially in the highly
boosted regime that probes the highest fractions x of the proton momentum carried by a parton. Also
in a simultaneous fit, the strong coupling constantαs(MZ) is extracted together with the PDFs and the
value obtained at the mass of the Z boson isαs(MZ)=0.1199±0.0015 (exp)+−00..00310020(theo).
2.3 Inclusive multijets
The investigation of inclusive multijet event cross sections (σjet ∝αS ) as a function of jet pT and
rapidityyprovides essential information about the PDFs and the strong coupling constant. Moreover,
the ratios of such cross sections,Rmn=σσmn−−jetjet ∝α
m−n, with m>n, provide an ideal tool to determine
the strong coupling constantαs(MZ) as numerous theoretical and experimental uncertainties cancel.
The inclusive 2- and 3-jet event cross sections as well as cross section ratio (R32) have been measured
using data corresponding to an integrated luminosity of 19.7 fb−1at √s=8 TeV, as a function of the
average transverse momentum, HT,2/2=12(pT,1+ pT,2) of the two leading jets [9]. R32as a function
Figure 2. [7] Left : The triple-differential dijet cross section in six bins ofyandy
b. The data are indicated
by different markers for each bin. The theoretical predictions, obtained with NLOJet++and NNPDF 3.0, and
complemented with EW and NP corrections, are depicted by solid lines. Apart from the boosted region, the data are well described by the predictions at NLO accuracy over many orders of magnitude. Right : The gluon PDFs
as a function of x as derived from HERA inclusive DIS data alone (hatched band) [8] and in combination with
CMS dijet data (solid band). The PDFs are shown at the scale Q2=104GeV2with their total uncertainties.
/2 (GeV)
T,2
H
400 500 600 1000
32
R
0.05 0.1 0.15 0.2 0.25 0.3 0.35
Data/NP
) = 0.112 - Min. Value
z
(M
s
α CT10
) = 0.118
z
(M
s
α CT10
) = 0.127 - Max. Value
z
(M
s
α CT10
CMSPreliminary 19.7 fb-1 (8 TeV)
R = 0.7
t
anti-k |y| < 2.5
300 1680
Q (GeV) 5 6 7 8 10 20 30 40 100 200 300 1000 2000
(Q)S
α
0.08 0.1 0.12 0.14 0.16 0.18 0.2 0.22 0.24 0.26
0.28 -0.0023
+0.0055 ) = 0.1150 z (M S
α
= 8TeV, s preliminary, 32 CMS R
= 8TeV s preliminary, 32 CMS R
= 8TeV s CMS Incl.Jet ,
= 7TeV s , 32 CMS R
= 7TeV s CMS Incl.Jet ,
= 7TeV s , t CMS t
= 7TeV s CMS 3-Jet Mass ,
= 7 TeV s ATLAS TEEC , D0 Incl.Jet D0 Angular Correlation H1 ZEUS
0.0011
±
) = 0.1181 z (M S
α
World Avg
CMSPreliminary
Figure 3.[9] Left : Cross section ratio R32as a function of HT,2/2 calculated from data (solid circles) in
com-parison to that from NLO pQCD (lines). The NLO predictions using the CT10 NLO PDF set corrected with NP
corrections are shown for a series of values assumed forαs(MZ) (dashed lines) together with the central
predic-tion (solid line). Right : The runningαS(Q) as a function of the scale Q is shown. The dashed line represents
the evolution of the world average [10] along with the results from other measurements of CMS [5,11–14],
ATLAS [15], D0 [16,17], H1 [18,19], and ZEUS [20].
Fig. 3 (left) presents this ratio as obtained from unfolded data in comparison to that from NLO
pQCD using CT10 NLO PDF set corrected with NP corrections. From a fit of the ratio of the 3-jet over 2-jet event cross section using the MSTW2008 PDF set, the extracted value of strong coupling
constant at the scale of the Z boson mass isαs(MZ) = 0.1150 ±0.0010 (exp) ±0.0013 (PDF) ±
0.0015 (NP)+0.0050
−0.0000(scale). As shown in Fig. 3 (right), this value is in agreement with the world
average value ofαs(MZ)=0.1181 ± 0.0011 derived in Ref. [10] as well as previous determinations
Figure 2. [7] Left : The triple-differential dijet cross section in six bins ofyandy
b. The data are indicated
by different markers for each bin. The theoretical predictions, obtained with NLOJet++and NNPDF 3.0, and
complemented with EW and NP corrections, are depicted by solid lines. Apart from the boosted region, the data are well described by the predictions at NLO accuracy over many orders of magnitude. Right : The gluon PDFs
as a function of x as derived from HERA inclusive DIS data alone (hatched band) [8] and in combination with
CMS dijet data (solid band). The PDFs are shown at the scale Q2=104GeV2with their total uncertainties.
/2 (GeV)
T,2
H
400 500 600 1000
32 R 0.05 0.1 0.15 0.2 0.25 0.3 0.35 Data/NP
) = 0.112 - Min. Value
z
(M
s
α CT10
) = 0.118
z
(M
s
α CT10
) = 0.127 - Max. Value
z
(M
s
α CT10
CMSPreliminary 19.7 fb-1 (8 TeV)
R = 0.7
t
anti-k |y| < 2.5
300 1680
Q (GeV) 5 6 7 8 10 20 30 40 100 200 300 1000 2000
(Q)S α 0.08 0.1 0.12 0.14 0.16 0.18 0.2 0.22 0.24 0.26
0.28 -0.0023
+0.0055 ) = 0.1150 z (M S α = 8TeV, s preliminary, 32 CMS R = 8TeV s preliminary, 32 CMS R = 8TeV s CMS Incl.Jet ,
= 7TeV s , 32 CMS R = 7TeV s CMS Incl.Jet ,
= 7TeV s , t CMS t = 7TeV s CMS 3-Jet Mass ,
= 7 TeV s ATLAS TEEC , D0 Incl.Jet D0 Angular Correlation H1 ZEUS
0.0011
±
) = 0.1181 z (M S α World Avg CMSPreliminary
Figure 3. [9] Left : Cross section ratio R32as a function of HT,2/2 calculated from data (solid circles) in
com-parison to that from NLO pQCD (lines). The NLO predictions using the CT10 NLO PDF set corrected with NP
corrections are shown for a series of values assumed forαs(MZ) (dashed lines) together with the central
predic-tion (solid line). Right : The runningαS(Q) as a function of the scale Q is shown. The dashed line represents
the evolution of the world average [10] along with the results from other measurements of CMS [5,11–14],
ATLAS [15], D0 [16,17], H1 [18,19], and ZEUS [20].
Fig. 3 (left) presents this ratio as obtained from unfolded data in comparison to that from NLO
pQCD using CT10 NLO PDF set corrected with NP corrections. From a fit of the ratio of the 3-jet over 2-jet event cross section using the MSTW2008 PDF set, the extracted value of strong coupling
constant at the scale of the Z boson mass isαs(MZ) = 0.1150 ±0.0010 (exp) ±0.0013 (PDF) ±
0.0015 (NP)+0.0050
−0.0000(scale). As shown in Fig. 3 (right), this value is in agreement with the world
average value ofαs(MZ)=0.1181 ± 0.0011 derived in Ref. [10] as well as previous determinations
obtained by the ATLAS and CMS collaborations [5,11–15].
2.4 Azimuthal correlations
The two-final state partons, at leading order (LO) in pQCD, are produced back-to-back in the
trans-verse plane and thus the azimuthal angular separation between the two highest pTjets in the transverse
plane,∆φ1,2= |φjet1−φjet2|, equalsπ. The production of a third or more high-pT jets leads to a
de-viation fromπin the azimuthal angle. The measurement of the azimuthal angular correlation (or
decorrelation fromπ) in multijet topologies is proven to be an interesting tool to test theoretical
pre-dictions of multijet production processes. So measurements of the normalized inclusive 2-jet, 3-jet,
and 4-jet cross sections differential in∆φ1,2and of the normalized inclusive 3-jet, and 4-jet cross
sec-tions differential in∆φmin2j (minimum azimuthal angular separation between any two of the three or
four leading pTjets,) have been performed for several regions in the leading-jet transverse momentum
pmax
T [21]. The measurements are performed using data collected during 2016 corresponding to an
integrated luminosity of 35.9 fb−1of proton-proton collisions at √s=13 TeV. The unfolded,
normal-ized, inclusive 2-jet (left), 3-jet (middle), and 4-jet (right) cross section differential in∆φ1,2is shown
in Fig.4for the variouspmax
T regions considered in the analysis. In the 2-jet case the∆φ1,2
distribu-tions are strongly peaked atπand become steeper with increasingpmaxT . The∆φ1,2distributions, in the
3-jet case become flatter atπsince the dijet events are missing, and in the 4-jet case they become even
more flat. The extension of∆φ1,2correlations in inclusive 3-jet and 4-jet topologies are new results.
(rad)
1,2
φ ∆ /2
π 2π/3 5π/6 π
) -1 (rad 1,2 φ∆ d 1,2 σ d 1,2 σ 1 -3 10 -2 10 -1 10 1 10 2 10 3 10 4 10 5 10 6 10 7 10 8 10 9 10 10 10 11 10 12 10 13 10 14 10 (13 TeV) -1 35.9 fb CMS Preliminary ) 8
> 1200 GeV (x10
max T
p )
7
< 1200 GeV (x10
max T
1000 < p )
6
< 1000 GeV (x10
max T
800 < p )
5
< 800 GeV (x10
max T
700 < p )
4
< 700 GeV (x10
max T
600 < p )
3
< 600 GeV (x10
max T
500 < p )
2
< 500 GeV (x10
max T
400 < p < 400 GeV (x10)
max T
300 < p < 300 GeV
max T
200 < p
PH-2J + Pythia8 CUETP8M1
)
8
> 1200 GeV (x10
max T
p )
7
< 1200 GeV (x10
max T
1000 < p )
6
< 1000 GeV (x10
max T
800 < p )
5
< 800 GeV (x10
max T
700 < p )
4
< 700 GeV (x10
max T
600 < p )
3
< 600 GeV (x10
max T
500 < p )
2
< 500 GeV (x10
max T
400 < p < 400 GeV (x10)
max T
300 < p < 300 GeV
max T
200 < p
2 ≥ nJets
R = 0.4 t Anti-k (rad) 1,2 φ ∆ /2
π 2π/3 5π/6 π
) -1 (rad 1,2 φ∆ d 1,2 σ d 1,2 σ 1 -3 10 -2 10 -1 10 1 10 2 10 3 10 4 10 5 10 6 10 7 10 8 10 9 10 10 10 11 10 12 10 13 10 14 10 (13 TeV) -1 35.9 fb CMS Preliminary ) 7
> 1000 GeV (x10
max T
p )
6
< 1000 GeV (x10
max T
800 < p )
5
< 800 GeV (x10
max T
700 < p )
4
< 700 GeV (x10
max T
600 < p )
3
< 600 GeV (x10
max T
500 < p )
2
< 500 GeV (x10
max T
400 < p < 400 GeV (x10)
max T
300 < p < 300 GeV
max T
200 < p
PH-2J + Pythia8 CUETP8M1
3 ≥ nJets
R = 0.4 t Anti-k (rad) 1,2 φ ∆ /2
π 2π/3 5π/6 π
) -1 (rad 1,2 φ∆ d 1,2 σ d 1,2 σ 1 -3 10 -2 10 -1 10 1 10 2 10 3 10 4 10 5 10 6 10 7 10 8 10 9 10 10 10 11 10 12 10 13 10 14 10 (13 TeV) -1 35.9 fb CMS Preliminary ) 7
> 1000 GeV (x10
max T
p )
6
< 1000 GeV (x10
max T
800 < p )
5
< 800 GeV (x10
max T
700 < p )
4
< 700 GeV (x10
max T
600 < p )
3
< 600 GeV (x10
max T
500 < p )
2
< 500 GeV (x10
max T
400 < p < 400 GeV (x10)
max T
300 < p < 300 GeV
max T
200 < p
PH-2J + Pythia8 CUETP8M1
4 ≥ nJets
R = 0.4 t Anti-k
Figure 4. [21] Normalized inclusive 2-jet (left), 3-jet (middle) and 4-jet (right) cross section differential in
∆φ1,2for ninepmaxT regions, scaled by multiplicative factors for presentation purposes. Overlaid on the data are
predictions from the PH-2J+pythia8 event generator.
3 Jet charge and mass
the jet charge distribution, unfolded for detector effects, with dijet events in pp collisions at √s=8
TeV has been performed in various ranges ofpT [22]. This measurement is carried out for different
definitions of jet charge as defined in equation1, to gain a better understanding of the underlying
models that can be used to improve the predictions of MC event generators. Figure5(left) compares
data with the normalized charge distribution of the leading jet withκ=0.6, initiated by either an up
quark (u), down quark (d), or a gluon (g) inpythia6. The charge distribution for jets initiated by
quarks with positive electric charge peaks at positive values, with a mean of 0.166e, as opposed to that for jets initiated by negatively charged quarks, with a mean of -0.088e and gluons, with a mean
of 0.013e, where e is the proton charge. This suggests that the jet charge can be used to differentiate
statistically jets from quarks of different electric charge, or to distinguish jets initiated by a gluon or a
quark.
Qκ= 1
(pTjet)κ
i
Qi(piT)κ,
Qκ
L=
i
Qi
pi
κ
/
i
pi
κ
,
Qκ
T =
i
Qi
pi
⊥
κ
/
i
pi
⊥
κ
(1)
[e]
=0.6 κ
Leading-jet Q 2
− −1.5 −1 −0.5 0 0.5 1 1.5 2
[1/e]
0.6
1/N dN/dQ
0 0.2 0.4 0.6 0.8 1 1.2
Data Gluon Up quark Down quark
> 400 GeV
T
p | < 1.5
η
|
(8 TeV)
-1
19.7 fb
CMS
Jet mass(GeV) 20 30 40 100 200 300 1000
Normalized cross section
14 −
10
12 −
10
10 −
10
8 −
10
6 −
10
4 −
10
2 −
10 1
2
10
4
10 200-260 GeV × 100 260-350 GeV × 101 350-460 GeV × 102
3
10
×
460-550 GeV 550-650 GeV × 104 650-760 GeV × 105 6
10
×
760-900 GeV 900-1000 GeV × 107 1000-1100 GeV × 108 9
10
×
1100-1200 GeV 1200-1300 GeV × 1010 PYTHIA8
CMS Preliminary 2.3 fb-1 (13 TeV)
Groomed jet mass(GeV) 20 30 40 100 200 300 1000
Normalized cross section
14 −
10
12 −
10
10 −
10
8 −
10
6 −
10
4 −
10
2 −
10 1
2
10
4
10 200-260 GeV × 100 260-350 GeV × 101 350-460 GeV × 102
3
10
×
460-550 GeV 550-650 GeV × 104 650-760 GeV × 105 6
10
×
760-900 GeV 900-1000 GeV × 107 1000-1100 GeV × 108 9
10
×
1100-1200 GeV 1200-1300 GeV × 1010 PYTHIA8
CMS Preliminary 2.3 fb-1 (13 TeV)
Figure 5.Comparison of jet charge distribution,Qκfor leading jets andκ=0.6, between data (points) and u, d,
and g distributions frompythia6 (left [22]). Results [23] of unfolding ungroomed (middle) and groomed (right)
jets for all pTbins. Bins with total uncertainty larger than 60% are not shown. The data are shown in markers for
each pTbin, scaled by a factor for better visibility. The predictions from PYTHIA8 are shown as a dashed red
line.
Jet mass is more sensitive to the internal structure of jets, which is theoretically described by QCD parton showering. The recent techniques make use of the mass of the jets to investigate signals of physics beyond the standard model (BSM). The jet mass generated by QCD radiation is typically lower than the jet mass generated by hadronically-decaying heavy SM particles that have 2- and 3-prong decays such as W, Z, and H bosons, or top quarks. This can be exploited to identify BSM particles that decay into highly Lorentz-boosted SM particles (“boosted object”). CMS has performed
a study [23] of double-differential jet cross section in bins of the ungroomed jet pT in conjunction
with the ungroomed and groomed jet mass using the ‘soft drop” grooming algorithm [24], which
the jet charge distribution, unfolded for detector effects, with dijet events in pp collisions at √s=8
TeV has been performed in various ranges ofpT[22]. This measurement is carried out for different
definitions of jet charge as defined in equation1, to gain a better understanding of the underlying
models that can be used to improve the predictions of MC event generators. Figure5(left) compares
data with the normalized charge distribution of the leading jet withκ=0.6, initiated by either an up
quark (u), down quark (d), or a gluon (g) inpythia6. The charge distribution for jets initiated by
quarks with positive electric charge peaks at positive values, with a mean of 0.166e, as opposed to that for jets initiated by negatively charged quarks, with a mean of -0.088e and gluons, with a mean
of 0.013e, where e is the proton charge. This suggests that the jet charge can be used to differentiate
statistically jets from quarks of different electric charge, or to distinguish jets initiated by a gluon or a
quark.
Qκ= 1
(pTjet)κ
i
Qi(piT)κ,
Qκ
L=
i
Qi
pi
κ
/
i
pi
κ
,
Qκ
T =
i
Qi
pi
⊥
κ
/
i
pi
⊥
κ
(1)
[e]
=0.6 κ
Leading-jet Q 2
− −1.5 −1 −0.5 0 0.5 1 1.5 2
[1/e]
0.6
1/N dN/dQ
0 0.2 0.4 0.6 0.8 1 1.2
Data Gluon Up quark Down quark
> 400 GeV
T
p | < 1.5
η
|
(8 TeV)
-1
19.7 fb
CMS
Jet mass(GeV) 20 30 40 100 200 300 1000
Normalized cross section
14 −
10
12 −
10
10 −
10
8 −
10
6 −
10
4 −
10
2 −
10 1
2
10
4
10 200-260 GeV × 100 260-350 GeV × 101 350-460 GeV × 102
3
10
×
460-550 GeV 550-650 GeV × 104 650-760 GeV × 105 6
10
×
760-900 GeV 900-1000 GeV × 107 1000-1100 GeV × 108 9
10
×
1100-1200 GeV 1200-1300 GeV × 1010 PYTHIA8
CMS Preliminary 2.3 fb-1 (13 TeV)
Groomed jet mass(GeV) 20 30 40 100 200 300 1000
Normalized cross section
14 −
10
12 −
10
10 −
10
8 −
10
6 −
10
4 −
10
2 −
10 1
2
10
4
10 200-260 GeV × 100 260-350 GeV × 101 350-460 GeV × 102
3
10
×
460-550 GeV 550-650 GeV × 104 650-760 GeV × 105 6
10
×
760-900 GeV 900-1000 GeV × 107 1000-1100 GeV × 108 9
10
×
1100-1200 GeV 1200-1300 GeV × 1010 PYTHIA8
CMS Preliminary 2.3 fb-1 (13 TeV)
Figure 5.Comparison of jet charge distribution,Qκfor leading jets andκ=0.6, between data (points) and u, d,
and g distributions frompythia6 (left [22]). Results [23] of unfolding ungroomed (middle) and groomed (right)
jets for all pTbins. Bins with total uncertainty larger than 60% are not shown. The data are shown in markers for
each pTbin, scaled by a factor for better visibility. The predictions from PYTHIA8 are shown as a dashed red
line.
Jet mass is more sensitive to the internal structure of jets, which is theoretically described by QCD parton showering. The recent techniques make use of the mass of the jets to investigate signals of physics beyond the standard model (BSM). The jet mass generated by QCD radiation is typically lower than the jet mass generated by hadronically-decaying heavy SM particles that have 2- and 3-prong decays such as W, Z, and H bosons, or top quarks. This can be exploited to identify BSM particles that decay into highly Lorentz-boosted SM particles (“boosted object”). CMS has performed
a study [23] of double-differential jet cross section in bins of the ungroomed jet pT in conjunction
with the ungroomed and groomed jet mass using the ‘soft drop” grooming algorithm [24], which
is the same as the “mass drop” grooming algorithm for our choice of parameters. This observable is sensitive to the physics modeling, and could be used in future global fits for parameter tuning.
This analysis improves over previous results by using a more theoretically controlled jet grooming
algorithm, as well as by unfolding in both pTand mass. For ungroomed jets shown in Fig.5(middle),
measurements frompythia8 are found to predict the jet mass spectrum within uncertainties in the data
for intermediate masses (0.1<m/pT<0.3). For groomed jets as in Fig.5(right), the Sudakov peak is
suppressed and the precision in the intermediate mass region (0.1<m/pT <0.3) improves, since the
grooming algorithm removes the portions of the jet arising from soft radiation.
4 Differential Z and W cross sections
Electroweak gauge boson production in pp collisions is an important probe of SM gauge boson inter-actions. The final states of W and Z decays have unique experimental signatures and the production cross sections for these processes are theoretically well understood and sensitive to deviations from
the SM. The study of the cross sections and differential cross sections for a Z boson, decaying to
dilepton channel, produced in association with jets in pp collisions at √s =8 TeV [25] as well as
at √s=13 TeV [26] has been done. The cross sections are determined as functions of various
rel-evant kinematic variables of jets. The predictions of a number of multileg generators with leading or next-to-leading order accuracy are compared with the measurements. The comparison shows the importance of including multiparton contributions in the matrix elements and the improvement in the predictions when next-to-leading order terms are included.
Similarly the differential cross sections have been measured for a W boson produced in
associa-tion with jets in pp collisions at√s=8 TeV [27] and at √s=13 TeV [28]. The measured differential
cross sections are compared with tree-level and higher-order recent event generators, as well as next-to-leading-order and next-to-next-next-to-leading-order theoretical predictions. The agreement of the
gen-erators with the measurements builds confidence in their use for the simulation of W+jets background
processes in searches for new physics at the LHC.
5 Heavy flavour jet physics
The associated production of vector bosons, W or Z, and jets originating from heavy-flavour quarks is a large background source in measurements of several SM processes, Higgs boson studies, and many searches for physics beyond the SM. The study of events with one or two well-identified and isolated leptons accompanied by heavy-flavour jets is crucial to refine the theoretical calculations in perturbative QCD, as well as to validate associated Monte Carlo techniques.
The cross section of the production of a Z boson associated with at least one jet originated by a
c-quark in pp collisions at √s=8 TeV corresponding to an integrated luminosity of 19.7±0.5 fb−1,
is measured [29]. The cross sections ratio of the production of a Z boson and at least one c- or b-quark
jet is also determined. The measured Z+c production cross section isσ(pp→Z+c+X )=8.6±0.5
(stat.)±0.7 (syst.) pb, and the cross sections ratio isσ(pp→Z+c+X )/σ(pp→Z+b+X )=2.0
±0.2 (stat.) ±0.2 (syst.). The measurements of Z+c production cross section and the cross sections
ratio, inclusively and differentially as a function ofpTjetare in agreement with the LO predictions from
MadGraphand NLO predictions from MG5_AMC. Predictions from the MCFM program are lower
than the measured Z+c cross section, both inclusive and differentially, as shown in6(left). A better
description is reached in terms of the Z+c/Z+b cross sections ratio shown in6(right).
6 Top physics
[GeV]
jet T
p
50 100 150 200
[pb]
jet T
(Z+c)/dp
σ
d
0 0.1 0.2 0.3 0.4
Data MADGRAPH MG5_aMC MCFM (MSTW08) MCFM (CT10) MCFM (NNPDF3IC)
Stat. uncertainty Total uncertainty
= 8 TeV) s (
-1
19.7 fb CMS Preliminary 19.7 fb-1 (s = 8 TeV) CMS Preliminary
[GeV]
jet T
p
50 100 150 200
]
jet T
(Z+b)/dp
σ
]/[d
jet T
(Z+c)/dp
σ
[d
0 1 2 3 4
Data MADGRAPH MG5_aMC MCFM (MSTW08) MCFM (CT10) MCFM (NNPDF3IC)
Stat. uncertainty Total uncertainty
= 8 TeV) s (
-1
19.7 fb CMS Preliminary
Figure 6.[29] Differential Z+c cross section (left) and Z+c/Z+b cross sections ratio (right) as a function of the transverse momentum of the jet. The solid rectangles indicate the total (statistical plus systematic) experimental uncertainty. Statistical and systematic uncertainties in the theoretical predictions are shown added in quadrature.
source of background in searches for physics beyond the standard model. Top quarks can decay
leptonically t→Wb→(lν) (b-jet), and hadronically t→ hadrons (three jets). In case of top pair
production, di-leptonic decays of both quarks can be selected by requiring one electron and one muon of opposite charge, and at least two jets in the final state. The case when one decay is leptonic and the other one is hadronic is selected by asking for one electron or one muon, and at least four jets in the final state.
6.1 Differentialt¯tproduction
Normalized double-differential cross sections for top quark pair (t¯t) production are measured in pp
collisions at √s=8 TeV corresponding to an integrated luminosity of 19.7 fb−1[30]. The
measure-ment is performed in the dilepton e±µ∓final state. The t¯tcross section is determined as a function of
various pairs of observables characterizing the kinematics of the top quark and t¯t system. The data is in agreement with calculations using pQCD at next-to-leading and approximate next-to-next-to-leading orders as well as with the fixed-order computations using MC Carlo event generators. The measured
double-differential cross sections have been incorporated into a PDF fit, together with other data from
HERA and the LHC. Including the t¯t data, there is a significant reduction in the uncertainties in the
gluon distribution at large values of x and can be seen in Fig. 7(left). The constraints provided by
these data are competitive with those from inclusive jet data. This improvement exceeds that from
us-ing sus-ingle-differential t¯t cross section data, thus strongly suggesting the use of the double-differential
t¯t measurements in PDF fits.
x
-3
10 10-2 10-1 1
ref
)
2 fµ
) / xg(x,
2 fµ
xg(x,
0.6 0.8 1 1.2 1.4
8 TeV ± HERA + CMS W HERA + CMS jets 8 TeV
8 TeV + ± HERA + CMS W
)] 8 TeV t ), M(t t [y(t
NLO
2
= 30000 GeV
2 f
µ
xg(x)
CMS
Figure 7.[30] The gluon distribution atµ2f =30000 GeV2, as
obtained from the PDF fit to the HERA DIS data and CMS W±boson
charge asymmetry measurements (shaded area), the CMS inclusive jet
production cross sections (hatched area), and the W±boson charge
[GeV]
jet T
p
50 100 150 200
[pb]
jet T
(Z+c)/dp
σ
d
0 0.1 0.2 0.3 0.4
Data MADGRAPH MG5_aMC MCFM (MSTW08) MCFM (CT10) MCFM (NNPDF3IC)
Stat. uncertainty Total uncertainty
= 8 TeV) s (
-1
19.7 fb CMS Preliminary 19.7 fb-1 (s = 8 TeV) CMS Preliminary
[GeV]
jet T
p
50 100 150 200
]
jet T
(Z+b)/dp
σ
]/[d
jet T
(Z+c)/dp
σ
[d
0 1 2 3 4
Data MADGRAPH MG5_aMC MCFM (MSTW08) MCFM (CT10) MCFM (NNPDF3IC)
Stat. uncertainty Total uncertainty
= 8 TeV) s (
-1
19.7 fb CMS Preliminary
Figure 6.[29] Differential Z+c cross section (left) and Z+c/Z+b cross sections ratio (right) as a function of the transverse momentum of the jet. The solid rectangles indicate the total (statistical plus systematic) experimental uncertainty. Statistical and systematic uncertainties in the theoretical predictions are shown added in quadrature.
source of background in searches for physics beyond the standard model. Top quarks can decay
leptonically t→Wb→ (lν) (b-jet), and hadronically t→ hadrons (three jets). In case of top pair
production, di-leptonic decays of both quarks can be selected by requiring one electron and one muon of opposite charge, and at least two jets in the final state. The case when one decay is leptonic and the other one is hadronic is selected by asking for one electron or one muon, and at least four jets in the final state.
6.1 Differentialt¯tproduction
Normalized double-differential cross sections for top quark pair (t¯t) production are measured in pp
collisions at √s=8 TeV corresponding to an integrated luminosity of 19.7 fb−1[30]. The
measure-ment is performed in the dilepton e±µ∓final state. The t¯tcross section is determined as a function of
various pairs of observables characterizing the kinematics of the top quark and t¯t system. The data is in agreement with calculations using pQCD at next-to-leading and approximate next-to-next-to-leading orders as well as with the fixed-order computations using MC Carlo event generators. The measured
double-differential cross sections have been incorporated into a PDF fit, together with other data from
HERA and the LHC. Including the t¯t data, there is a significant reduction in the uncertainties in the
gluon distribution at large values of x and can be seen in Fig. 7(left). The constraints provided by
these data are competitive with those from inclusive jet data. This improvement exceeds that from
us-ing sus-ingle-differential t¯t cross section data, thus strongly suggesting the use of the double-differential
t¯t measurements in PDF fits.
x
-3
10 10-2 10-1 1
ref
)
2 fµ
) / xg(x,
2 fµ
xg(x,
0.6 0.8 1 1.2 1.4
8 TeV ± HERA + CMS W HERA + CMS jets 8 TeV
8 TeV + ± HERA + CMS W
)] 8 TeV t ), M(t t [y(t
NLO
2
= 30000 GeV
2 f
µ
xg(x)
CMS
Figure 7.[30] The gluon distribution atµ2f=30000 GeV2, as
obtained from the PDF fit to the HERA DIS data and CMS W±boson
charge asymmetry measurements (shaded area), the CMS inclusive jet
production cross sections (hatched area), and the W±boson charge
asymmetry plus the double-differential t¯tcross section (dotted area).
6.2 t-channel single top quark production
The cross section of the t-channel single top quark production is measured using events with one muon
and jets in the final state [31]. The cross section for the production of single top quarks and the ratio of
the top quark to top antiquark production are measured together in a simultaneous fit where the results are used to evaluate the production cross section of single top antiquarks. Several kinematic variables are then combined into a multivariate discriminator to distinguish signal from background events. A
fit to the distribution of the discriminating variable yields a total cross section of 238±13 (stat)±29
(syst) pb and a ratio of top quark and top antiquark production ofRt−ch.=1.81±0.18 (stat)±0.15
(syst).From the total cross section the absolute value of the CKM matrix elementVtbis calculated to
be 1.05±0.07 (exp)±0.02 (theo). All results are in agreement with the standard model predictions
and previous measurements.
6.3 Top mass
The precise measurement of top quark mass (mt), a fundamental parameter of the standard model
(SM), can benefit the calculation of radiative corrections to several observables. The currentmt
mea-surement methods exploit either the full kinematic reconstruction of top quark pair (t¯t) events or
alternative event topologies or observables that are sensitive tomtvariations. The latter can avoid
in-trinsic hadronization-related uncertainties and provide further understanding of the relation between
the experimental results obtained formtand the mass parameters employed in theoretical calculations.
The first measurement of the differential t¯t cross section has been performed in the+jets channel
as a function of the leading-jet massmjetin the highly boosted top quark regime [32]. The
measure-ment is carried out in a fiducial region with fully merged top quark decays in hadronic final states,
corrected to the particle level. The predictions exceed the measurements of differential cross section
as a function of the leading-jet mas as shown in Fig.8(left) whereas the normalized differential cross
section shown in Fig.8(right) agrees with predictions from simulations, indicating the good quality
of modelling the jet mass in highly boosted top quark decays. The normalized measurement is used
to extract a value ofmt, in order to estimate the current sensitivity of the data. The value obtained is,
mt =170.8±9.0 GeV which is consistent with the current LHC and Tevatron average of 173.34±
0.27 (stat)±0.71 (syst) GeV [33].
[GeV]
jet
Leading-jet m
150 200 250 300 350
GeV
fb
jet
dm
σ
d
0 0.5 1 1.5 2
2.5 Data
MADGRAPH+PYTHIA MC@NLO+HERWIG
POWHEG+PYTHIA
CMS
(8 TeV)
-1
19.7 fb
[GeV]
jet
Leading-jet m
150 200 250 300 350
-1
GeV
jet
dm
σ
d
σ
1
0 0.005 0.01 0.015
Data 178.5 GeV =
t
m
172.5 GeV =
t
m
166.5 GeV =
t
m
CMS
(8 TeV)
-1
19.7 fb Figure 8.[32] Left : Measured
particle-level differential t¯t cross sections as a function of the leading-jet mass, compared to predictions from MadGraph+pythia,powheg+pythia,
and MC@NLO+Herwiggenerators
(lines). Right : The normalized particle-level t¯t differential cross section compared to predictions from MadGraph+pythiafor three values of
mt.
7 Summary
measurements of characteristics of events, ranging from jet-charge to shapes as well as jet mass distri-butions. The measurements are compared to theoretical predictions including those matched to parton
shower and hadronization. Along with this multi-differential jet cross-sections are presented over a
wide range in transverse momenta from inclusive jets to multi-jet final states. These measurements
have an impact on the determination of the strong coupling constantαS as well as on parton density
functions (PDFs). The electroweak boson production, whether inclusive or associated with charm or beauty quarks, gives insight into the flavour separation of the proton sea. Also the measurements of cross sections of jet and top-quark pair production are in particular sensitive to the gluon distribution
in the proton andαS.
References
[1] CMS Collaboration, JINST3, S08004 (2008).
[2] CMS Collaboration, JINST12, no. 10, P10003 (2017) arXiv:1706.04965 [physics.ins-det].
[3] M. Cacciari, G. P. Salam and G. Soyez, JHEP0804, 063 (2008) arXiv:0802.1189 [hep-ph].
[4] M. Cacciari, G. P. Salam and G. Soyez, Eur. Phys. J. C72, 1896 (2012) arXiv:1111.6097 [hep-ph].
[5] CMS Collaboration, JHEP1703, 156 (2017) arXiv:1609.05331 [hep-ex].
[6] CMS Collaboration, Eur. Phys. J. C76, no. 8, 451 (2016) arXiv:1605.04436 [hep-ex].
[7] CMS Collaboration, arXiv:1705.02628 [hep-ex].
[8] H1 and ZEUS Collaborations, Eur. Phys. J. C75, no. 12, 580 (2015) arXiv:1506.06042 [hep-ex].
[9] CMS Collaboration, CMS-PAS-SMP-16-008,http://cds.cern.ch/record/2253091
[10] Particle Data Group, Chin. Phys. C40, no. 10, 100001 (2016).
[11] CMS Collaboration, Eur. Phys. J. C73, no. 10, 2604 (2013) arXiv:1304.7498 [hep-ex].
[12] CMS Collaboration, Phys. Lett. B728, 496 (2014) arXiv:1307.1907 [hep-ex].
[13] CMS Collaboration, Eur. Phys. J. C75, no. 6, 288 (2015) arXiv:1410.6765 [hep-ex].
[14] CMS Collaboration, Eur. Phys. J. C75, no. 5, 186 (2015) arXiv:1412.1633 [hep-ex].
[15] ATLAS Collaboration, Phys. Lett. B750, 427 (2015) arXiv:1508.01579 [hep-ex].
[16] D0 Collaboration, Phys. Rev. D80, 111107 (2009) arXiv:0911.2710 [hep-ex].
[17] D0 Collaboration, Phys. Lett. B718, 56 (2012) arXiv:1207.4957 [hep-ex].
[18] H1 Collaboration, Eur. Phys. J. C75, no. 2, 65 (2015) arXiv:1406.4709 [hep-ex].
[19] H1 Collaboration, Eur. Phys. J. C77, no. 4, 215 (2017) arXiv:1611.03421 [hep-ex].
[20] ZEUS Collaboration, Nucl. Phys. B864, 1 (2012) arXiv:1205.6153 [hep-ex].
[21] CMS Collaboration, CMS-PAS-SMP-16-014,http://cds.cern.ch/record/2257685
[22] CMS Collaboration, JHEP1710, 131 (2017) arXiv:1706.05868 [hep-ex].
[23] CMS Collaboration, CMS-PAS-SMP-16-010,http://cds.cern.ch/record/2273393
[24] A. J. Larkoskiet al., JHEP1405, 146 (2014) arXiv:1402.2657 [hep-ph].
[25] CMS Collaboration, JHEP1704, 022 (2017) arXiv:1611.03844 [hep-ex].
[26] CMS Collaboration, CMS-PAS-SMP-15-010,http://cds.cern.ch/record/2114819
[27] CMS Collaboration, Phys. Rev. D95, 052002 (2017) arXiv:1610.04222 [hep-ex].
[28] CMS Collaboration, CMS-PAS-SMP-16-005,http://cds.cern.ch/record/2204927
[29] CMS Collaboration, CMS-PAS-SMP-15-009,http://cds.cern.ch/record/2202823
[30] CMS Collaboration, Eur. Phys. J. C77, no. 7, 459 (2017) arXiv:1703.01630 [hep-ex].
[31] CMS Collaboration, Phys. Lett. B772, 752 (2017) arXiv:1610.00678 [hep-ex].
[32] CMS Collaboration, Eur. Phys. J. C77, no. 7, 467 (2017) arXiv:1703.06330 [hep-ex].
![Figure 2. [7] Left : The triple-differential dijet cross section in six bins of y⋆ and yb](https://thumb-us.123doks.com/thumbv2/123dok_us/8060711.1343459/4.482.80.400.342.458/figure-left-triple-dierential-dijet-cross-section-bins.webp)
![Figure 3. [9] Left : Cross section ratio R32 as a function of HT,2/2 calculated from data (solid circles) in com-parison to that from NLO pQCD (lines)](https://thumb-us.123doks.com/thumbv2/123dok_us/8060711.1343459/5.482.45.438.305.463/figure-cross-section-ratio-function-calculated-circles-parison.webp)
![Figure 5. Comparison of jet charge distribution,and g distributions fromjets for all p Qκ for leading jets and κ = 0.6, between data (points) and u, d, pythia6 (left [22])](https://thumb-us.123doks.com/thumbv2/123dok_us/8060711.1343459/6.482.43.448.232.446/figure-comparison-charge-distribution-distributions-fromjets-leading-points.webp)
![Figure 6. [29] Differential Z+c cross section(left) and Z+c/Z+b cross sections ratio (right)as a function of the transverse momentum ofthe jet](https://thumb-us.123doks.com/thumbv2/123dok_us/8060711.1343459/8.482.42.177.505.634/figure-dierential-section-sections-ratio-function-transverse-momentum.webp)
![Figure 8. [32] Left : Measuredparticle-level differential t¯t crosssections as a function of the leading-jetmass, compared to predictions fromMadGraph+pythia, powheg+pythia,and MC@NLO+Herwig generators(lines)](https://thumb-us.123doks.com/thumbv2/123dok_us/8060711.1343459/9.482.39.446.451.609/measuredparticle-dierential-crosssections-function-compared-predictions-frommadgraph-generators.webp)
