Article
1
Scaffolds with a High Surface Area-to-Volume Ratio
2
and Cultured Under Fast Flow Perfusion Result in
3
Optimal O
2Delivery to the Cells in Artificial Bone
4
Tissues
5
Thanh Danh Nguyen 1, Olufemi E. Kadri 1, Vassilios Sikavitsas2, and Roman S. Voronov 1,*
6
1 Otto H. York Department of Chemical and Materials Engineering, New Jersey Institute of Technology,
7
Newark, NJ 07102, USA; [email protected]
8
2 School of Chemical, Biological and Materials Engineering, University of Oklahoma Norman, OK 73019,
9
USA; [email protected]
10
* Correspondence: [email protected]; Tel.: +1 973 642 4762.
11
Received: date; Accepted: date; Published: date
12
Featured Application: Optimization of Scaffold Design And Flow Perfusion Culturing
13
Conditions for Maximal Delivery of Oxygen to the Cells Embedded Deep Inside of Engineered
14
Tissues.
15
Abstract: Tissue engineering has the potential for repairing large bone defects, which impose a
16
heavy financial burden on the public health. However, difficulties with O2 delivery to the cells
17
residing in the interior of tissue engineering scaffolds make it challenging to grow artificial tissues
18
of clinically-relevant sizes. This study uses image-based simulation in order to provide insight into
19
how to better optimize the scaffold manufacturing parameters, and the culturing conditions, in
20
order to resolve the O2 bottleneck. To do this, high resolution 3D X-ray images of two common
21
scaffold types (salt leached foam and non-woven fiber mesh) are fed into a Lattice Boltzmann
22
Method fluid dynamics and reactive Lagrangian Scalar Tracking mass transfer solvers. The obtained
23
findings indicate that the scaffolds should have maximal surface area-to-solid volume ratios, for
24
higher chances of the molecular collisions with the cells. Furthermore, the cell culture media should
25
be flown through the scaffold pores as fast as practically possible (without detaching or killing the
26
cells). Finally, we have provided a parametric sweep that maps how the molecular transport within
27
the scaffolds is affected by variations in rates of O2 consumption by the cells. Ultimately, the results
28
of this study are expected to benefit the computer-assisted design of tissue engineering scaffolds
29
and culturing experiments.
30
Keywords: Oxygen Delivery; Optimization; Mass Transfer; Transport; Bone tissue engineering;
31
Computational fluid dynamics; Lattice Boltzmann Method; Scaffold Design; Culturing Protocol;
32
Lagrangian Scalar Tracking
33
34
1. Introduction
35
Incidences of bone disorders constitute a significant economic burden to societies globally. In
36
the United States alone, the total annual cost (direct and indirect) of treating an estimated 126.6
37
million people affected by musculoskeletal disorders exceeds $213 billion [1]. Moreover, with an
38
increasingly obese and ageing population, this trend is expected to continue further. Unfortunately,
39
according to U.S Department of Health & Human Services, only ~10% out of the 115,000 people who
40
needed a lifesaving organ transplant in 2018 have actually received it. This is because despite the
41
overwhelming demand, almost no FDA-approved [2] artificial tissue products are commercially
42
available today.
43
A major hurdle standing in the way of producing viable engineered bone is product size
44
limitations. These in turn stem from the inability to deliver sufficient amounts of metabolites (e.g.,
45
O2, nutrients, etc.) to the inner pore spaces of scaffolds, given that the cells consume them in large
46
quantities as they build tissue. Among these, O2 plays a critical role in the cell growth and
47
proliferation, and thus its high concentrations have been correlated with both increased cellularity
48
[3] and cell viability [4]. Conversely, a deficiency in O2 can result in a hypoxic cell state, which is
49
commonly associated with decreased metabolic activity and potentially undesirable differentiation
50
behavior [5-7]. Hence, optimal oxygen transport is important in maintaining tissue function and
51
overall survival within the artificial tissues. For that reason, bone tissue engineering scaffolds are
52
typically cultured in perfusion bioreactors, the idea behind which is to facilitate the mass transfer
53
using flow.
54
However, understanding what scaffold fabrication parameters, and flow culturing conditions,
55
result in the optimal O2 delivery to the cells is made difficult by the complexity of the pore network
56
architectures in which they reside. This is because most large scaffolds are not transparent enough
57
for microscopy, and it is also difficult to measure the O2 concentrations at different locations within
58
the scaffolds. Furthermore, the O2 uptake rate by the cells changes over time [3]. All these
59
complications make the problem even more difficult to solve manually. For these reasons, computer
60
simulation of the O2 transport and consumption offers itself as a viable alternative for obtaining
61
insight into the microenvironment, which is experienced by the cells seeded on the surfaces of the
62
scaffold pores.
63
Yet, modeling of mass transport (and specifically of O2) within scaffolds is uncommon when
64
compared to flow parameters, such as stimulatory fluid shear stress, permeability, and pressure (see
65
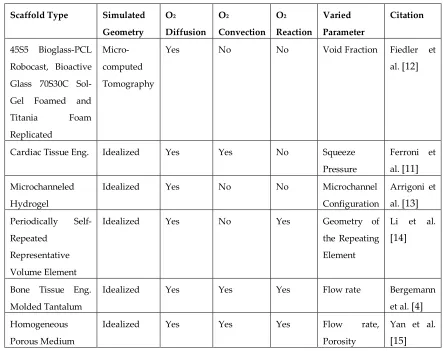
Table II in Ref. [8]). Furthermore, Table 1 below summarizes our overview of the few O2 models that
66
we did find in literature. From it, it can be seen that the studies commonly use idealized geometries
67
for the scaffolds (e.g., a homogeneous porous medium), instead of realistic image-based. In reality,
68
however, the scaffold architectures may be inhomogeneous. Moreover, many of the models either do
69
not take into account specificities of bone tissue engineering: such as the need for flow perfusion,
70
which generates a stimulatory shear environment natural to the bone canaliculi [9,10]. Instead, many
71
models either target tissue engineering in general, or they may be specific to other tissue engineering
72
disciplines: for example, Ferroni et al. [11] modeled a cardiac scaffold, which is cultured under
73
pulsatile flow (not the case for bone). Finally, few of the models take into account O2 consumption by
74
the cells. And among those that do, the rate is typically assumed to be constant. Thus, we were not
75
able to find a single bone tissue engineering model, which accounted for all of the following: the
76
realistic scaffold structure, O2 diffusion, convection and variable consumption rates.
77
Table 1 Literature overview of O2 simulations in tissue engineering scaffolds, shows that image-based
79
simulation of convection with diffusion and reaction has not yet been done.
80
Scaffold Type Simulated
Geometry O2
Diffusion O2
Convection O2
Reaction
Varied
Parameter
Citation
45S5 Bioglass-PCL
Robocast, Bioactive
Glass 70S30C
Sol-Gel Foamed and
Titania Foam
Replicated
Micro-computed
Tomography
Yes No No Void Fraction Fiedler et
al. [12]
Cardiac Tissue Eng. Idealized Yes Yes No Squeeze
Pressure
Ferroni et
al. [11]
Microchanneled
Hydrogel
Idealized Yes No No Microchannel
Configuration
Arrigoni et
al. [13]
Periodically
Self-Repeated
Representative
Volume Element
Idealized Yes No Yes Geometry of
the Repeating
Element
Li et al.
[14]
Bone Tissue Eng.
Molded Tantalum
Idealized Yes Yes Yes Flow rate Bergemann
et al. [4]
Homogeneous
Porous Medium
Idealized Yes Yes Yes Flow rate,
Porosity
Yan et al.
[15]
81
Therefore, in this work we aim to shed insight on how scaffold manufacturing parameters, and
82
flow culturing conditions, affect the O2 transport and uptake by the cells in realistic bone tissue
83
engineering scaffolds. To do this, we use two types of commonly-implemented types: the salt leached
84
foam and the non-woven fiber mesh poly-l-lactic acid (PLLA) scaffolds. Their geometries are scanned
85
in 3D using high resolution micro-computed tomography (µCT), and imported into our image-based
86
Lattice Boltzmann Method (LBM) flow[16-19] and reactive Lagrangian Scalar Tracking (rLST) mass
87
transport [20] solvers. A big advantage of the latter is it can model particles with a range of reactivity,
88
which is informative about how. In this way, a more complete picture of O2 transport within the
89
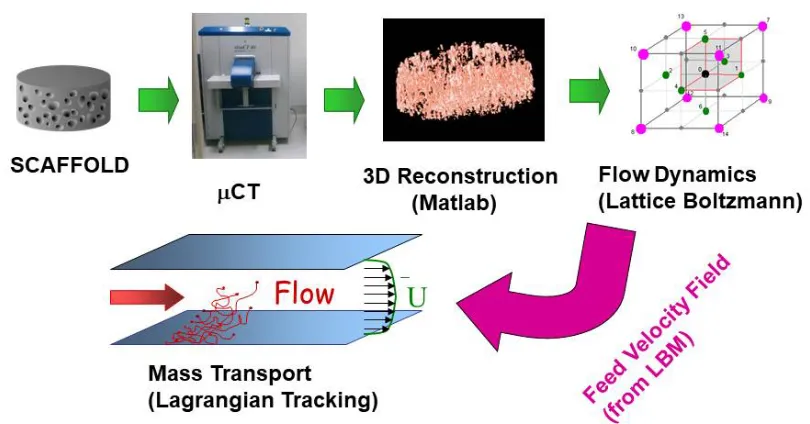
different types of BTE scaffolds can be constructed. The overall computational scheme is depicted in
90
Figure 1.
91
93
Figure 1 The image-based modeling methodology used in this work: scaffolds are scanned in 3D via high
94
resolution CT, reconstructed in silico and the resulting geometries are used by the LBM and rLST solvers.
95
2. Materials and Methods
96
2.1 Scaffold Fabrication
97
The full details of the scaffold preparation protocols can be found in our previous publications
98
[16,17]. Briefly, the scaffolds were non-woven fiber meshes, constructed using polymer micro-fibers
99
produced with spunbonding. The polymer used in the production of fibers was poly-L-lactic-acid
100
(grade 6251D, 1.4% D enantiomer 108,500 MW, 1.87 PDI, NatureWorks LLC). A custom Brabender
101
extruder (19.1 mm (0.75 in.) diameter x 381 mm length) was used to pressurize and melt the polymer.
102
A manually circulated collection screen was used to collect a random even layering of fibers. Layers
103
of fibers were stacked and measured until the stack reached a mass of 9.0 ± 0.1 g within an area of
104
162.8 cm2. The collected non-woven fiber stack then had a 7cm center cut sheet obtained from it.
105
Finally using an 8 mm diameter die, discs were punched from the layered fiber sheets. The resulting
106
scaffolds used in culturing were 8 mm diameter and ~2.3 mm thickness. Average fiber diameter was
107
measured optically, using a Nikon HFX-II microscope.
108
The porous foam scaffolds were prepared using solvent casting/particulate leaching method
[21-109
24]. Briefly, poly(L-lactic acid) (PLLA, 114,500 MW, 1.87 PDI, Birmingham Polymers) was dissolved
110
into chloroform 5% w/v. The solution was then poured over a bed of sodium chloride crystals. Solvent
111
was allowed to evaporate for 24h. The resulting salt-polymer composite was inserted into an 8 mm
112
diameter cylindrical mold and compressed at 500 psi. During compression, the composite was heated
113
to 130 °C and held at constant temperature and pressure for 30 min. Using a diamond wheel saw
114
(Model 650, South Bay Technology, Inc.), the resulting composite rod was cut into 2.3 mm thick discs.
115
The discs were placed into deionized water (DIH2O) under agitation for 2 days to leach out NaCl.
116
Entire DIH2O volumes were replaced twice per day. Leached discs were then removed from DIH2O
117
and placed under vacuum to remove moisture from the scaffolds. The resulting products were 8 mm
118
diameter, 2.3 mm thick discs. Porosity of scaffolds was determined by measuring the solid volume
119
(mass of the scaffold divided by the density of PLLA) and comparing to the total scaffold volume
120
122
2.2 3D Imaging and Virtual Reconstruction
123
The full details of our scanning procedure can be found in our previous publication.[16,17,25]
124
Briefly, scaffolds were then scanned via µCT using a ScanCo VivaCT40 system (ScanCo Medical,
125
Bassersdorf, Switzerland) to obtain 10µm resolution, 2D intensity image slices at the optimum
126
settings of 88 µA (intensity) and 45 kV (energy). The acquired X-ray images were filtered for noise
127
reduction and assembled into 3D reconstructions of the scaffolds using a custom Matlab code
128
(MathWorks Inc., Natick, MA). The scans were segmented using global thresholding. Threshold
129
values were chosen such that the porosity of scaffolds from 3D reconstructions were within 1% of
130
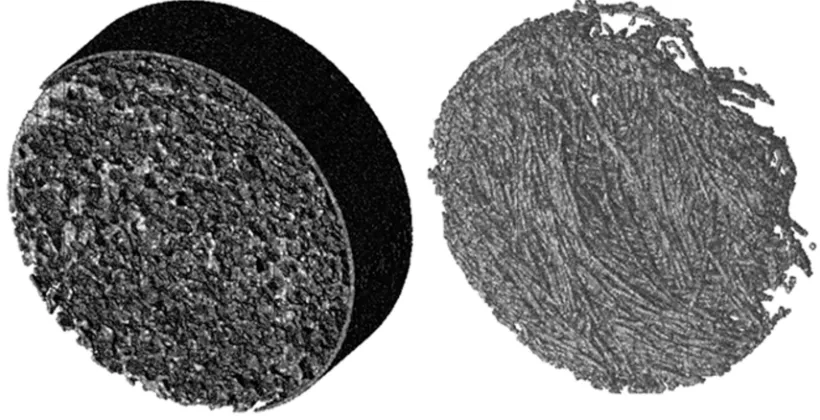
experimentally calculated porosities. Figure 2 is a typical 3D reconstruction of each scaffold type.
131
Experimental porosities were obtained by measuring the solid volume (mass of the scaffolds divided
132
by the density of scaffold materials) and comparing with total scaffold volume (assuming a
133
cylindrical scaffold) as reported in [16,17,20].
134
135
136
137
Figure 2 Three dimensional reconstructions of the two scaffold architecture types used in this study. LEFT -
Salt-138
Leached Porous Foam Scaffold; RIGHT - Non-woven Fiber mesh Scaffold. Both of the scaffolds are made from
139
PLLA, and their dimensions are 8-mm-diameter and 2.3-mm-thickness. The images were obtained via µCT
140
imaging described in our previous works [16,17,25].
141
2.3 Fluid Flow Modeling: Lattice Boltzmann Method (LBM)
142
LBM was chosen for the present application, because it is especially appropriate for modeling
143
pore-scale flow through porous media (such as scaffolds) due to the simplicity with which it handles
144
complicated boundaries [16-18,20,26-29]. This is because LBM uses structured meshes for complex
145
geometries, unlike classical CFD approaches which will rather utilize unstructured meshes. Another
146
advantage of LBM is that it uses a direct method based on first principles at the mesoscopic scale
147
rather than modeling terms of the fluid flow governing equations at the macroscopic scale. In
148
addition, the LBM method has gained popularity within the scientific computing community because
149
A previously developed custom-written, in-house code was used in this work
[16-151
18,20,26,29,31]. The D3Q15 lattice [32] in conjunction with the single-relaxation time Bhatnagar, Gross
152
and Krook [33] collision term approximation was used to perform simulations. The no-slip boundary
153
condition was applied at solid faces using the “bounce-back” technique [34]. To take advantage of
154
the inherent LBM parallelizability, domains were decomposed using message passing interface
155
[18,26]. The code has been validated for several flow cases for which analytical solutions are available:
156
forced flow in a slit, flow in a pipe and flow through an infinite array of spheres [16,26].
157
Each simulation domain was composed of a scaffold placed inside of a pipe. This is meant to
158
mimic the cassette holder that typically fixes the scaffold in the perfusion bioreactors. The pipe’s
159
length was taken to be approximately 10 times greater than the scaffold thickness, in order to avoid
160
periodicity artifacts, and to ensure that a uniform parabolic profile is developed before flow reaches
161
the scaffolds. Simulations were performed for a flow rates ranging between 0.15-1 mL/min. This is
162
considered a suitable range for culturing bone tissue in typical perfusion bioreactors. Convergence
163
was defined as when average and highest velocities computed for the simulation domain vary by
164
less than 0.01% for two consecutive time steps.
165
2.4 Oxygen Transport Modeling: Reactive Lagrangian Scalar Tracking (rLST)
166
The full details of the rLST code can be found in our prior publications [20,26]. Briefly, the
167
trajectories of the rLST particles are determined by contributions from convection (obtained using
168
the velocity field from the LBM simulations) and diffusion (i.e., Brownian motion obtained from a
169
mesoscopic Monte-Carlo approach). For example, the new X position of a marker at time t+1 is
170
calculated from the previous position at time t as follows:
171
) ( )
( 1
random t LBM
t t
t
X
U
t
X
X
(1)172
where
U
t is the fluid velocity at the particle’s location at time t, as obtained from the LBM173
solver. On the other hand, the random jump has a standard deviation that is given by
174
νΔt/Sc t
D
σ 2 0 2 , where D0 is the nominal molecular diffusivity (i.e. the diffusivity that the
175
particles would have if their motion was purely Brownian). It can also be expressed in terms of the
176
dimensionless Schmidt number Sc, which depends on the carrier fluid’s viscosity. The molecular
177
diffusivity of O2 in the cell culture medium (assumed to be an aqueous solution at the physiological
178
temperature of T = 37 oC) was 2.62 × 10⁻⁵ cm2/s, which corresponded to a Schmidt number of 328.14.
179
The rLST simulations were performed using 1 million particles, which was found to be sufficient
180
to reproduce analytical results from the Taylor-Aris formula, during the validation runs. Their initial
181
positions were distributed uniformly in a release plane at the pipe’s entrance. Furthermore, in order
182
to model the O2 consumption by the cells, each of the rLST particles had a probability ‘q’ to react
183
upon colliding with the scaffold walls: ranging from q = 0 (non-reactive) and q = 1 (fully reactive).
184
It was also assumed that the scaffold’ surface was uniformly covered with a monolayer of the
185
cells, each of them capable of consuming the O2. Since second order reactions (reactions between
186
solute particles) were not considered for this model, any interactions between rLST markers were
187
neglected (i.e. they did not affect each other’s path). This approximation is good for a dilute solution.
188
The 'Mersenne Twister' random number generator with a cycle of length (219937 - 1) was used for all
190
random number generation in the rLST code [35].
191
3. Results
192
As previously discussed, efficient delivery of O2 is vital to the cell survival in the 3D bone tissue
193
engineering scaffolds. Yet, choosing the optimal scaffold manufacturing parameters, and the
194
culturing flow conditions is non-trivial, due to the complex transport phenomena occurring in the
195
pore networks of the engineered tissue constructs. For this reason, we have performed image-based
196
simulation of the fluid flow, and of the O2 transport, occurring within two common types of bone
197
tissue engineering PLLA scaffolds: the salt-leached foam and the non-woven fiber mesh.
198
Their geometries were varied by controlling the amount and the size of the leached salt grains
199
for the former, and the fiber diameter for the latter. In order to compare the scaffolds on the same
200
scale, here the results are plotted as a function of the “specific surface area” – defined as the ratio of
201
surface area to solid volume. Furthermore, in order to analyze how the transport of O2 is affected by
202
the rate at which it is consumed by the cells, we considered different probabilities with which its
203
molecules can react upon colliding with the scaffold walls. We examine the condition of a uniform
204
coverage of the scaffold surfaces with O2-starved cells. This corresponds to an infinite surface reaction
205
rate (i.e., instantaneous consumption of every O2 molecule that collides with a scaffold wall); and
206
should be treated as a limiting case scenario, which allows for a comparison of different scaffold
207
structures on an equivalent basis.
208
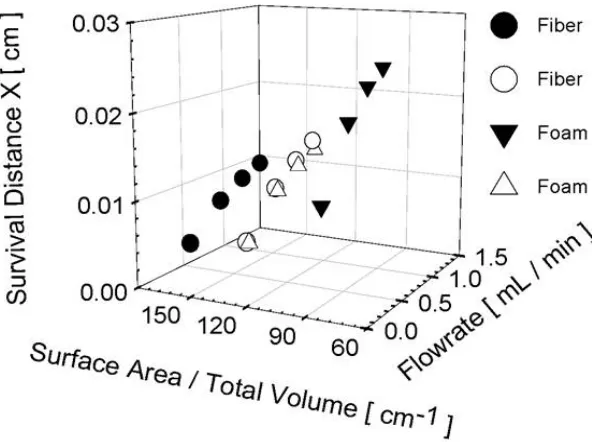
Figure 3 is a 3D plot of the O2 “survival distance” in the stream-wise direction (the X-direction),
209
as a function of the scaffold structure and the cell-culture media perfusion flow rate. The survival
210
distance is defined as the distance that the rLST markers (representing the O2 molecules) travel on
211
average, until they are “consumed” via a collision with a scaffold wall. From this figure, it is apparent
212
that the survival distance in the stream-wise direction increases as the flow rate goes up. This is
213
consistent with the Taylor-Aris dispersion theory, which states that the effective diffusivity in the
214
stream-wise direction should increase with the square of the Peclet number [20,34]:
215
= ∗
where Re is the Reynolds number and Sc is the Schmidt Number. Its physical meaning is the
216
ratio of the transport by advection to transport by diffusion. In this study, Sc is fixed for an O2
217
molecule in an aqueous cell culture media at T = 37 oC, as was discussed in the methods section.
218
Hence, according to Equation 2, the Peclet number will increase proportionally with the value of Re,
219
which depends on the velocity of the fluid. This leads to a higher effective diffusivity of the solute
220
in the stream-wise direction; and thus, the O2 can make it further into the scaffold, before it is fully
221
223
Figure 3 Survival distance in the stream-wise direction, as a function of the scaffold geometry and perfusion
224
flow rate. Data is plotted for the limiting case of the fully reactive rLST particles.
225
Another trend that is apparent from Figure 3 is that the survival distance of O2 is also inversely
226
proportional to the specific surface area of the scaffold. This makes sense, because the O2 molecules
227
have a smaller chance to collide with the scaffold’s surface, when it has less area exposed.
228
Furthermore, Figure 3 shows that the foam scaffolds have a lower specific surface area than do the
229
fiber ones. This leads to noticeably longer survival distances of O2 in the foam scaffolds.
230
Overall, the result demonstrates that it is plausible to modify the scaffold’s geometry in order to
231
increase the efficiency of the O2 transport within its structure. For example, the specific surface area
232
of a medium composed of cylinders (such as the fiber-mesh scaffold) is given as:
233
D
S
4
(3)234
where D is the fiber diameter. Unfortunately, there is no analytical formula for the salt-leached
235
foam structures, due to their anisotropy resulting from the fabrication procedure. However, in
236
general, their specific surface area goes up with lower porosity (i.e., amount of salt), and with smaller
237
salt grain size used in the leaching.
238
Interestingly, the survival distances in the Y and Z directions (i.e., perpendicular to the flow) go
239
down with the increasing flow rate (see Figure 4). The reason behind this is likely due to the particles
240
becoming entrained by the carrier fluid. Consequently, they move less in the Y and Z directions per
241
time step, relative to their displacement in the X. As a result, there is a smaller probability of collisions
242
with the walls in the former directions. However, since both the Y and Z survival distances are an
243
order of magnitude smaller than those in the X direction, the total survival distance is dominated by
244
the trend displayed by the latter.
245
247
Figure 4 Survival distances in the Y & Z directions, as a function of the scaffold geometry and perfusion flow
248
rate. Data is plotted for the limiting case of the fully reactive rLST particles. Both scaffolds types are chosen to
249
have a similar specific surface area.
250
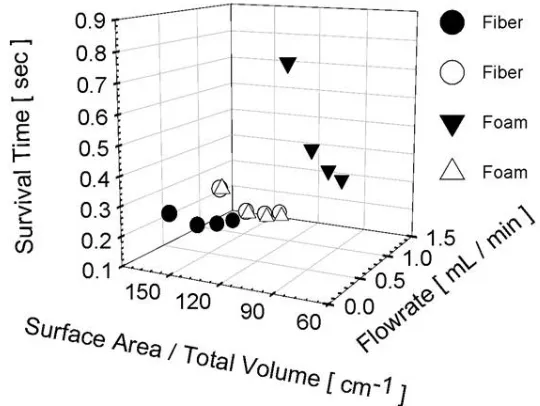
Another quantity of interest is the survival time of the O2 molecules in the scaffolds. Figure 5
251
plots this quantity as a function of the flow rate and the specific surface area of the scaffolds; for the
252
limiting case of fully reactive rLST particles. Conversely to the survival distance in Figure 3, the
253
survival time in Figure 5 decreases with the flow rate. Though, the effect of the specific surface area
254
remains the same, and the survival time varies inversely-proportionally to it. Combining the results
255
from both of the figures, it becomes apparent that fully reactive molecules get carried to a farther
256
distance by a higher flow rate. However, they take a shorter time to get consumed by the cells on the
257
surface of the scaffolds. This is especially true for the scaffold geometries with a higher exposed
258
surface area.
259
260
Figure 5 Survival time in the stream-wise direction, as a function of the scaffold geometry and perfusion flow
261
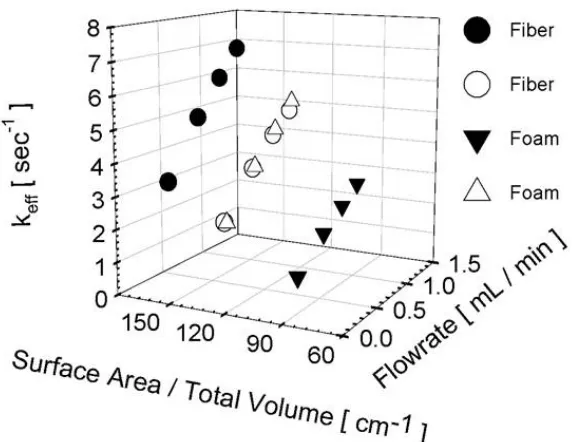
Ultimately, it is of interest to measure the effective 1st order reaction rate constant keff, with which
263
the O2 molecules get consumed in the scaffolds, after accounting for the mass transfer limitations.
264
To that end, Figure 6 is a plot of keff as a function of the flow rate and specific surface area of the
265
scaffold, for the limiting case of an infinitely fast surface consumption of O2. It reaffirms the
266
previously observed trends, which show that the O2 is consumed faster in the scaffold structures with
267
the higher surface area-to-solid volume ratios. Furthermore, it also supports the finding that
268
increasing the cell culture media flow rate through the scaffold leads to a faster O2 consumption in
269
its pores.
270
271
Figure 6 Effective O2 reaction coefficient keff, as a function of the scaffold geometry and perfusion flow rate.
272
Data is plotted for the limiting case of the fully reactive rLST particles.
273
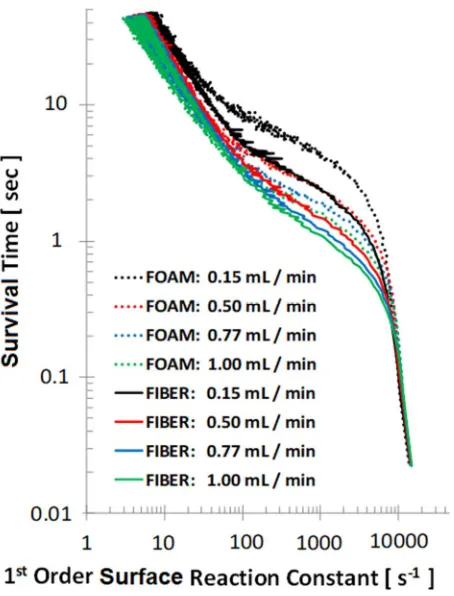
If the cells are not starved for O2, however, the rLST particles can be made to have a finite (as
274
opposed to infinite) probability to become consumed upon collision with the scaffold walls. Thus,
275
Figure 7 explores the role that the different cell affinities for consuming the O2 have on its transport
276
in the pores. In this case, the rLST particles with the different reactivities are all released
277
simultaneously, and their survival times are compared as a function of the cell culture media flow
278
280
Figure 7 O2 survival time as a function of the consumption rate by the cells on the scaffold surface. Data is plotted
281
for salt leached foam and non-woven fiber mesh scaffolds at four different flow rates.
282
Two trends are immediately apparent from Figure 7: 1) the O2 in the fiber scaffolds (solid lines)
283
has a shorter survival time than in the foam ones (dotted lines), regardless of the cells’ affinity for its
284
uptake. This is consistent with the trends in the previous section, which showed that the fiber
285
scaffolds have a higher specific surface area than do the foams. This makes them more efficient at
286
delivering the O2 molecules to the cells; and 2) the second trend essentially says that for a given
287
surface reaction rate, the consumption of O2 will take longer at the slower flows. This is again
288
consistent with a similar trend that was shown in Figure 5, where the survival time increased with
289
the slower flow rate.
290
4. Discussion
291
In this manuscript, we carried out a study of how the O2 mass transfer is affected by the scaffold
292
manufacturing and the flow perfusion culturing parameters, in bone tissue engineering scaffolds.
293
The knowledge obtained from the reported results is needed in order to overcome the product-size
294
limitations, which are commonly experienced due to hypoxia and necrosis in the center of large
295
scaffolds. To solve the problem, we used an image-based approach of scanning the true scaffold
296
structures in 3D using a high resolution µCT, and then feeding the obtained geometries to our
in-297
house parallelized fluid flow (LBM) and mass transport (rLST) solvers. Two scaffolds commonly used
298
in bone tissue engineering, the salt leached foam and the nonwoven fiber mesh, were used for this
299
study. The O2 transport results were parametrized as a function of the specific surface area of the
300
scaffold, the flow rate in the bioreactor and the affinity to consume the molecule by the cells.
301
The main conclusions from our work are that the scaffolds with the higher specific area (i.e.
302
increases the chances of the O2 uptake by them, which results in a higher consumption (i.e., shorter
304
survival times and distances) of the molecules in the scaffold. Furthermore, by increasing the flow
305
rate in the bioreactor, the O2 transport can be both facilitated (as seen from the shorter survival time
306
in Figure 4) and delivered deeper into the scaffold (as seen from the longer survival distance in Figure
307
3). Thus, the overall effective O2 reaction coefficient keff can be increased by maximizing both the
308
specific surface area of the scaffold and the flowrate through its pores. This is evident from Figure 6.
309
Interestingly, the conclusion that an increased flow rate improves the O2 delivery to the cells has
310
also been reported by Bergemann et al. [4]. However, increasing it indefinitely is not an option,
311
because there is a trade-off with the shear forces exerted on the cells by the flow. Specifically, values
312
in the range of 0.1 - 25 dynes/cm2 [36-38] are generally considered to be beneficial because they mimic
313
the natural microenvironment in bone canaliculi [9,10] and has been shown to promote tissue
314
regeneration [39-42]. On the other hand, an excessive shear in the range of 26-54 dynes/cm2 and higher
315
can cause cell lysing and/or detachment from the scaffold [43,44]. Therefore, there is some optimal
316
flow rate, which was found to be 45 L/min by the Bergemann et al. study [4]. However, this value
317
is specific to their scaffold-and-cell combination, and it could vary for other alternatives. Therefore,
318
both image-based numerical simulations and cell viability assays are necessary for tuning the optimal
319
conditions for other types of cultures. Whereas, at least the physical understanding provided in our
320
study should be applicable across all scaffold types, because they are expressed in terms of the
321
specific surface area.
322
Finally, Figure 7 in our manuscript provides insight into how the O2 transport depends on its
323
consumption by the cells. In this case, we are not assuming that the cells are O2-starved (and as a
324
result take up every oxygen molecule that collides with them). Instead, we vary consumption rate of
325
the O2 at the scaffold surface, in order to measure how this affects its transport in the scaffold. The
326
results reported in this figure allow other researchers to understand the changes in the scaffold’s
327
transport microenvironment over time. They also show how the flowrate and specific surface area
328
trends are affected by the cell-specific O2 consumption rates.
329
The limitations of our study are that the cells are assumed to have a uniformed coverage on the
330
scaffold surface. In reality, they would likely prefer some areas of the scaffolds more than others.
331
Furthermore, the tissue they lay down and the forces they exert on the scaffold would likely alter the
332
internal structure of the scaffold (and in turn the flow field in its pores). Unfortunately, our model
333
does not account for these types of influences by the cells on the mass transfer of O2. Additionally,
334
the scaffold’s structure in the real experiment could change due to wetting forces, fiber flexibility,
335
and the natural degradation of PLLA. The latter produces acidic byproducts, whose removal is
336
facilitated by the fluid flow [45]. Yet, in our study the scaffold’s structure remains static throughout
337
the virtual experiment.
338
However, the results presented in this manuscript expose qualitative trends that should hold
339
true regardless of the necessary simplifications. Therefore, it is expected that they should contribute
340
significantly to the field of bone tissue engineering scaffold design and experiment optimization.
341
5. Conclusions
342
Mass transfer of O2 in scaffolds cultured in perfusion bioreactors is of interest to the fields of
343
bone, and other types of, tissue engineering. Specifically, understanding how to control it can be
344
Therefore, we performed an image-based simulation study, in which we showed that the scaffolds
346
with the higher surface area-to-solid volume ratio result in a more efficient transfer of O2.
347
Additionally, we showed that the effect can be increased further by flowing the cell culture media
348
through the scaffold faster. Serendipitously, this also delivers the O2 deeper into the scaffold pores,
349
which is key to overcoming the product-size limitations mentioned earlier. Furthermore, we
350
provided a parametric sweep over the rates of O2 consumption by the cells situated on the scaffold
351
surfaces. This visual aid yields insight into how the different cell affinities for consuming the O2 can
352
affect the molecule’s transport through the biological porous media. Finally, the computational
353
framework presented in this study can serve as a viable tool for optimizing the scaffold design, and
354
experimental culturing protocols, for other types of tissue engineering as well.
355
Author Contributions: Conceptualization, Sikavitsas V.I. and Voronov R.S; methodology, Nguyen T.D., Kadri
356
O.E..; software, Voronov R.S; validation, Nguyen T.D., and Kadri O.E.; formal analysis, Nguyen T.D., and Kadri
357
O.E.; investigation, Nguyen T.D., and Kadri O.E.; resources, Sikavitsas V.I.; data curation, Nguyen T.D;
358
writing—original draft preparation, Nguyen T.D. and Kadri O.E.; writing—review and editing, Nguyen T.D.,
359
Kadri O.E., Sikavitsas V.I. and Voronov R.S..; visualization, Nguyen T.D. and Kadri O.E.; supervision, Voronov
360
R.S..; project administration Voronov R.S.; funding acquisition, Voronov R.S.
361
Funding: This research was funded by Gustavus and Louise Pfeiffer Research Foundation Major Research
362
Investment Grant.
363
Acknowledgments: Financial support from Gustavus and Louise Pfeiffer Research Foundation is gratefully
364
acknowledged. We also acknowledge the computing for this project was performed at the OU Supercomputing
365
Center for Education & Research (OSCER) at the University of Oklahoma (OU) and Texas Advanced Computing
366
Center (TACC) at The University of Texas – Austin. Both have contributed to the research results reported within
367
this paper. URLs: http://www.ou.edu/oscer.html and http://www.tacc.utexas.edu, respectively. This work also
368
used the Extreme Science and Engineering Discovery Environment (XSEDE)[46], which is supported by
369
National Science Foundation grant number ACI-1548562. Allocations: TG-BCS170001 and TG-BIO160074.
370
The Xradia micro-CT scans were made by Mark E. Curtis. Fiber fabrication was performed by Taren Blue, who
371
was studying under the guidance of Prof. Robert L. Shambaugh at OU. Scaffolds were cultured by Sam
372
VanGordon and Cortes Williams also at OU. We gratefully acknowledge their expertise and assistance.
373
Conflicts of Interest: The authors have no competing financial interests to declare.
374
References
375
1. American Academy of Orthopaedic Surgeons, A. One in two Americans have a musculoskeletal condition.
376
Availabe online: https://www.sciencedaily.com/releases/2016/03/160301114116.htmEnglish (accessed on
377
06/13).
378
2. Administration, U.S.F.a.D. Approved Cellular and Gene Therapy Products. Availabe online:
379
https://www.fda.gov/BiologicsBloodVaccines/CellularGeneTherapyProducts/ApprovedProducts/default.
380
htm (accessed on 02/20/2018).
381
3. Simmons, A.D.; Williams, C.; Degoix, A.; Sikavitsas, V.I. Sensing metabolites for the monitoring of tissue
382
engineered construct cellularity in perfusion bioreactors. Biosensors and Bioelectronics 2017, 90, 443-449.
383
4. Bergemann, C.; Elter, P.; Lange, R.; Weissmann, V.; Hansmann, H.; Klinkenberg, E.D.; Nebe, B. Cellular
384
Nutrition in Complex Three-Dimensional Scaffolds: A Comparison between Experiments and Computer
385
Simulations. Int J Biomater 2015, 2015, 584362, doi:10.1155/2015/584362.
386
5. Gilkes, D.M.; Semenza, G.L.; Wirtz, D. Hypoxia and the extracellular matrix: drivers of tumour metastasis.
387
Nature Reviews Cancer 2014, 14, 430.
388
6. Spill, F.; Reynolds, D.S.; Kamm, R.D.; Zaman, M.H. Impact of the physical microenvironment on tumor
389
7. Nguyen, T.D.; Song, M.S.; Ly, N.H.; Lee, S.Y.; Joo, S.W. Nanostars on Nanopipette Tips: A Raman Probe
391
for Quantifying Oxygen Levels in Hypoxic Single Cells and Tumours. Angew Chem Int Ed Engl 2019, 58,
392
2710-2714, doi:10.1002/anie.201812677.
393
8. Zhang, S.; Vijayavenkataraman, S.; Lu, W.F.; Fuh, J.Y. A review on the use of computational methods to
394
characterize, design, and optimize tissue engineering scaffolds, with a potential in 3D printing fabrication.
395
Journal of Biomedical Materials Research Part B: Applied Biomaterials 2018.
396
9. Verbruggen, S.W.; Vaughan, T.J.; McNamara, L.M. Fluid flow in the osteocyte mechanical environment: a
397
fluid-structure interaction approach. Biomech Model Mechanobiol 2014, 13, 85-97,
doi:10.1007/s10237-013-398
0487-y.
399
10. Guyot, Y.; Luyten, F.P.; Schrooten, J.; Papantoniou, I.; Geris, L. A three-dimensional computational fluid
400
dynamics model of shear stress distribution during neotissue growth in a perfusion bioreactor. Biotechnol
401
Bioeng 2015, 112, 2591-2600, doi:10.1002/bit.25672.
402
11. Ferroni, M.; Giusti, S.; Nascimento, D.; Silva, A.; Boschetti, F.; Ahluwalia, A. Modeling the fluid-dynamics
403
and oxygen consumption in a porous scaffold stimulated by cyclic squeeze pressure. Med Eng Phys 2016,
404
38, 725-732, doi:10.1016/j.medengphy.2016.04.016.
405
12. Fiedler, T.; Belova, I.V.; Murch, G.E.; Poologasundarampillai, G.; Jones, J.R.; Roether, J.A.; Boccaccini, A.R.
406
A comparative study of oxygen diffusion in tissue engineering scaffolds. J Mater Sci Mater Med 2014, 25,
407
2573-2578, doi:10.1007/s10856-014-5264-7.
408
13. Arrigoni, C.; Bongio, M.; Talò, G.; Bersini, S.; Enomoto, J.; Fukuda, J.; Moretti, M. Rational design of
409
prevascularized large 3D tissue constructs using computational simulations and biofabrication of
410
geometrically controlled microvessels. Advanced healthcare materials 2016, 5, 1617-1626.
411
14. Li, E.; Chang, C.; Zhang, Z.; Li, Q. Characterization of tissue scaffolds for time-dependent biotransport
412
criteria–a novel computational procedure. Computer methods in biomechanics and biomedical engineering 2016,
413
19, 1210-1224.
414
15. Yan, X.; Bergstrom, D.J.; Chen, X.B. Modeling of cell cultures in perfusion bioreactors. IEEE Trans Biomed
415
Eng 2012, 59, 2568-2575, doi:10.1109/TBME.2012.2206077.
416
16. Voronov, R.; Vangordon, S.; Sikavitsas, V.I.; Papavassiliou, D.V. Computational modeling of flow-induced
417
shear stresses within 3D salt-leached porous scaffolds imaged via micro-CT. Journal of Biomechanics 2010,
418
43, 1279-1286, doi:10.1016/j.jbiomech.2010.01.007.
419
17. VanGordon, S.B.; Voronov, R.S.; Blue, T.B.; Shambaugh, R.L.; Papavassiliou, D.V.; Sikavitsas, V.I. Effects
420
of Scaffold Architecture on Preosteoblastic Cultures under Continuous Fluid Shear. Industrial &
421
Engineering Chemistry Research 2011, 50, 620-629, doi:10.1021/ie902041v.
422
18. Papavassiliou, D.V.; Pham, N.H.; Kadri, O.E.; Voronov, R.S. Chapter 23 - Lattice Boltzmann Methods for
423
Bioengineering Applications. In Numerical Methods and Advanced Simulation in Biomechanics and Biological
424
Processes, Academic Press: 2018; doi: 10.1016/B978-0-12-811718-7.00023-Xpp. 415-429.
425
19. Alam, T.A.; Pham, Q.L.; Sikavitsas, V.I.; Papavassiliou, D.V.; Shambaugh, R.L.; Voronov, R.S. Image-based
426
modeling: A novel tool for realistic simulations of artificial bone cultures. Technology 2016, 1-5.
427
20. Voronov, R.S.; VanGordon, S.B.; Sikavitsas, V.I.; Papavassiliou, D.V. Efficient Lagrangian scalar tracking
428
method for reactive local mass transport simulation through porous media. International Journal for
429
Numerical Methods in Fluids 2011, 67, 501-517, doi:10.1002/fld.2369.
430
21. Lu, L.C.; Peter, S.J.; Lyman, M.D.; Lai, H.L.; Leite, S.M.; Tamada, J.A.; Vacanti, J.P.; Langer, R.; Mikos, A.G.
431
22. Alvarez-Barreto, J.F.; Sikavitsas, V.I. Improved mesenchymal stem cell seeding on RGD-modified
poly(L-433
lactic acid) scaffolds using flow perfusion. Macromol Biosci 2007, 7, 579-588, doi:DOI
434
10.1002/mabi.200600280.
435
23. Mikos, A.G.; Lyman, M.D.; Freed, L.E.; Langer, R. Wetting of poly(L-lactic acid) and
poly(DL-lactic-co-436
glycolic acid) foams for tissue culture. Biomaterials 1994, 15, 55-58.
437
24. Liu, X.; Ma, P.X. Polymeric scaffolds for bone tissue engineering. Ann Biomed Eng 2004, 32, 477-486.
438
25. Voronov, R.S.; VanGordon, S.B.; Shambaugh, R.L.; Papavassiliou, D.V.; Sikavitsas, V.I. 3D
Tissue-439
Engineered Construct Analysis via Conventional High-Resolution Microcomputed Tomography Without
440
X-Ray Contrast. Tissue Engineering Part C-Methods 2013, 19, 327-335, doi:10.1089/ten.tec.2011.0612.
441
26. Voronov, R. Fluid Shear Stress and Nutrient Transport effects via Lattice-Boltzmann and Lagrangian Scalar
442
Tracking Simulations of cell culture media perfusion through artificial bone engineering constructs imaged
443
with microCT[PhD Thesis]. Doctoral Dissertation, University of Oklahoma, 2010.
444
27. Porter, B.; Zauel, R.; Stockman, H.; Guldberg, R.; Fyhrie, D. 3-D computational modeling of media flow
445
through scaffolds in a perfusion bioreactor. Journal of Biomechanics 2005, 38, 543-549, doi:
446
10.1016/j.jbiomech.2004.04.011.
447
28. Shakhawath Hossain, M.; Bergstrom, D.J.; Chen, X.B. A mathematical model and computational
448
framework for three-dimensional chondrocyte cell growth in a porous tissue scaffold placed inside a
bi-449
directional flow perfusion bioreactor. Biotechnology and bioengineering 2015, 112, 2601-2610,
450
doi:10.1002/bit.25678.
451
29. Williams, C.; Kadri, O.; Voronov, R.; Sikavitsas, V. Time-Dependent Shear Stress Distributions during
452
Extended Flow Perfusion Culture of Bone Tissue Engineered Constructs. Fluids 2018, 3, 25.
453
30. Wang, J.; Zhang, X.; Bengough, A.G.; Crawford, J.W. Domain-decomposition method for parallel lattice
454
Boltzmann simulation of incompressible flow in porous media. Physical Review E 2005, 72, 016706,
455
doi:10.1103/PhysRevE.72.016706.
456
31. Kadri, O.E.; Williams, C., 3rd; Sikavitsas, V.; Voronov, R.S. Numerical accuracy comparison of two
457
boundary conditions commonly used to approximate shear stress distributions in tissue engineering
458
scaffolds cultured under flow perfusion. Int J Numer Method Biomed Eng 2018, 34, e3132,
459
doi:10.1002/cnm.3132.
460
32. Qian, Y.H.; Dhumieres, D.; Lallemand, P. Lattice Bgk Models for Navier-Stokes Equation. Europhysics
461
Letters 1992, 17, 479-484.
462
33. Bhatnagar, P.L.; Gross, E.P.; Krook, M. A Model for Collision Processes in Gases .1. Small Amplitude
463
Processes in Charged and Neutral One-Component Systems. Physical Review 1954, 94, 511-525.
464
34. Sukop, M.C.; Thorne, D.T.; NetLibrary Inc. Lattice Boltzmann modeling an introduction for geoscientists
465
and engineers. Springer: Berlin ; New York, 2006; pp ix, 172 p.
466
35. Matsumoto, M.; Nishimura, T. Mersenne twister: a 623-dimensionally equidistributed uniform
pseudo-467
random number generator. ACM Trans. Model. Comput. Simul. 1998, 8, 3-30, doi:10.1145/272991.272995.
468
36. Stolberg, S.; McCloskey, K.E. Can shear stress direct stem cell fate? Biotechnology Progress 2009, 25, 10-19,
469
doi:10.1002/btpr.124.
470
37. Raimondi, M.T.; Moretti, M.; Cioffi, M.; Giordano, C.; Boschetti, F.; Lagana, K.; Pietrabissa, R. The effect of
471
hydrodynamic shear on 3D engineered chondrocyte systems subject to direct perfusion. Biorheology 2006,
472
43, 215-222.
473
38. Kim, K.M.; Choi, Y.J.; Hwang, J.-H.; Kim, A.R.; Cho, H.J.; Hwang, E.S.; Park, J.Y.; Lee, S.-H.; Hong, J.-H.
474
Mesenchymal Stem Cells through TAZ Activation. PLOS ONE 2014, 9, e92427,
476
doi:10.1371/journal.pone.0092427.
477
39. Miyashita, S.; Ahmed, N.E.M.B.; Murakami, M.; Iohara, K.; Yamamoto, T.; Horibe, H.; Kurita, K.;
Takano-478
Yamamoto, T.; Nakashima, M. Mechanical forces induce odontoblastic differentiation of mesenchymal
479
stem cells on three-dimensional biomimetic scaffolds. Journal of Tissue Engineering and Regenerative Medicine
480
2017, 11, 434-446, doi:10.1002/term.1928.
481
40. Zhao, F.; Vaughan, T.J.; McNamara, L.M. Quantification of fluid shear stress in bone tissue engineering
482
scaffolds with spherical and cubical pore architectures. Biomechanics and Modeling in Mechanobiology 2016,
483
15, 561-577, doi:10.1007/s10237-015-0710-0.
484
41. Sikavitsas, V.I.; Bancroft, G.N.; Holtorf, H.L.; Jansen, J.A.; Mikos, A.G. Mineralized matrix deposition by
485
marrow stromal osteoblasts in 3D perfusion culture increases with increasing fluid shear forces. Proceedings
486
of the National Academy of Sciences 2003, 100, 14683-14688, doi:10.1073/pnas.2434367100.
487
42. Yourek, G.; McCormick, S.M.; Mao, J.J.; Reilly, G.C. Shear stress induces osteogenic differentiation of
488
human mesenchymal stem cells. Regenerative medicine 2010, 5, 713-724, doi:10.2217/rme.10.60.
489
43. Brindley, D.; Moorthy, K.; Lee, J.-H.; Mason, C.; Kim, H.-W.; Wall, I. Bioprocess Forces and Their Impact
490
on Cell Behavior: Implications for Bone Regeneration Therapy. Journal of Tissue Engineering 2011, 2011,
491
620247, doi:10.4061/2011/620247.
492
44. Alvarez-Barreto, J.F.; Linehan, S.M.; Shambaugh, R.L.; Sikavitsas, V.I. Flow Perfusion Improves Seeding of
493
Tissue Engineering Scaffolds with Different Architectures. Annals of Biomedical Engineering 2007, 35,
429-494
442, doi:10.1007/s10439-006-9244-z.
495
45. Agrawal, C.M.; McKinney, J.S.; Lanctot, D.; Athanasiou, K.A. Effects of fluid flow on the in vitro
496
degradation kinetics of biodegradable scaffolds for tissue engineering. Biomaterials 2000, 21, 2443-2452.
497
46. Towns, J.; Cockerill, T.; Dahan, M.; Foster, I.; Gaither, K.; Grimshaw, A.; Hazlewood, V.; Lathrop, S.; Lifka,
498
D.; Peterson, G.D., et al. XSEDE: Accelerating Scientific Discovery. Computing in Science & Engineering 2014,
499
16, 62-74, doi:10.1109/MCSE.2014.80.