83 | P a g e
ANALYSIS ON PERFORMANCE IMPROVEMENT OF
A TRACTOR ENGINE TESTING UNIT
Shikhar Jamuar
1, Subbarao Chamarthi
2, Shivam Goyal
3,
Soubhagya Ranjan Dhall
41,2,3,4
Student, Mechanical Engineering Department, SRM University, Delhi-NCR Campus
ABSTRACT
This paper provides an overview of possibilities for determining tractor's engine load, fuel consumption and
exhaust emissions in real operating conditions. The use of accumulated database in tractor's electronic control
modules for the analysis of engine load, fuel consumption and exhaust emissions is analysed. The methodology
for analysis of engine power, speed and exhaust emissions dependencies, also for analysis of engine exhaust
emissions is presented. This speeds up the process, reduces cycle time and increases efficiency of the process.
After these operations the Engine is ready. Now after these operations Engine is forwarded to the Test Shop.
There is a complete testing setup for every engine that comes out of the main assembly line. Here engine is
thoroughly checked for its working and any possible faults such as engine noise, rpm, loading, leakages,
exhaust smoke etc.
Keywords: Cycle time, Engine load, Exhaust Emission, Fuel consumption, Loading.
I.
INTRODUCTION
A tractor is a source of power under stationery and mobile conditions. Therefore, the first step of its
performance evaluation is to determine the maximum power and torque together with SFC and variation of
these characteristics over the entire governed speed range. The engine BHP has no importance to the user, as he
is concerned with the power available at the power outlets of the tractor and therefore in laboratory the power is
measured at all the power outlets viz. Power take-off shaft, belt pulley, drawbar and hydraulic lift. In the initial
stages of the agricultural mechanisation process, many poorly designed and poorly manufactured machines may
be put on the market. This situation poses serious problems at both the individual and the national level. Official
testing of agricultural machinery was started with the primary objective of eliminating poorly designed and
poorly manufactured machinery. It must however be remembered that, at the same time, testing tends to upgrade
the technical level on the manufacturer’s side, thereby contributing to marked improvements in the performance
84 | P a g e
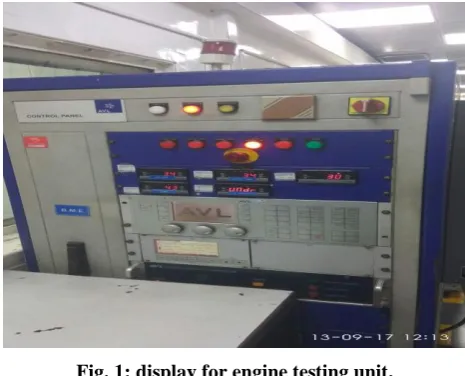
Fig. 1: display for engine testing unit.Every Industry has separate engine testing department. There is a complete testing setup for every engine that
comes out of the assembly line. Here engine is thoroughly checked for its working and any possible faults such
as
Engine noise
RPM
Loading
Leakages
Exhaust Smoke
Different models of engine can be tested in the engine-testing department, the test beds may vary in design and
size but more less are capable of the complete testing. There are different levels of tests. Some are optional and
others are compulsory, but the basic test procedure remains the same few step in and out don’t matter. The test
report comprises of four sections namely:
Specifications: Test engineers verify measurements and specifications to make sure everything is congruent
with the manufacturer's specifications.
Test Conditions: Engineers record the exact test conditions of the test engine to ensure that conditions meet
the requirements of the test procedure.
Compulsory Tests: Engineers record the performance of the engine at the main power take-off, the power lift
and hydraulic pump, and the drawbar. Included in the drawbar tests and PTO tests are fuel consumption
measurements.
Water leakage section: Check Cylinder Head rear plate. Water pump, Head Gasket, Water Plug, Drain Plug
and Oil Leakage: Check Tappet Cover, Cylinder Head Gasket , Front rear half moan joint , Sump joint ,
Timing Case cover , Rear end oil seal , Oil filter , Drain plug , PTO plate , Pressure pipe and elbow pipe and
Timing case cover seal.
Gears and Knocking: Check Missing and Vibration. Or any types of disturbance which create in engine are
85 | P a g e
II.
PROCEDURE
OF
ENGINE
TESTING
UNIT
The procedure for engine testing is mentioned below.
Engine oil is poured into the engine
Engine is fixed in the mounting points
The intake and exhaust are connected to the supply and draw line
The hot water supply is connected
The flywheel of the engine is connected to the rotor of the dynamometer
The engine is turned on using an electrical switch
And is run on idle RPM for some time
Then after some time the engine is shifted to max throttle
By Appling load using a dynamometer the rpm is brought down to 2200
And the further brought down to 1200rpm
The engine speciation values are noted against these rpm and matched with a specification sheet issued by
the R&D department
If the values are under the specified limits then is OK otherwise it is REJECTED or kept on HOLD
2.1 Parameters of Engine Testing
Oil temperature
Water inlet temperature
Oil pressure
Fuel time ( mileage )
Water outlet temperatur
Air temperature
2.2Engine Testing Device
The device used for engine testing is called dynamometer. The there are many types of dynamometer broadly.
Hydraulic dynamometer
Eddy current dynamometer
Switching field dc dynamometer
Fan dynamometer
Transmission dynamometer
Chassis dynamometer
The device specifically used for our testing at the laboratories is Eddy current dynamometer.
2.3 Working Of An Eddy Current Dynamometer
In this type load is applied to the engine by eddy current principle
Dynamometer consist of stator and rotor
Rotor is connected with shaft to engines flywheel
86 | P a g e
440v supply with varying current (0-15amp)
The current varies from 0-15 to control the engine load 0-250NM
III. FIGURES AND TABLES
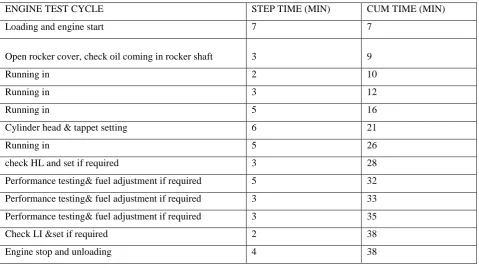
The following observations are made for the Engine test cycle and noticed the respective Step time and
Cumulative time as observed and given below:
TABLE 1. Engine test cycle and respective Step time and Cumulative time
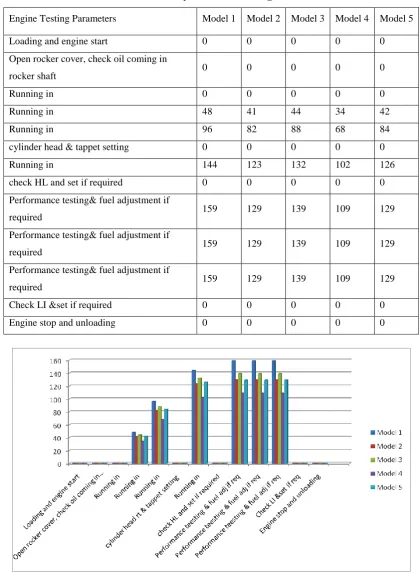
Fig 2. Graph for step time and cum time for different processes
Apart from these the engine testing parameters for five different working models were anlayzed and the results
are mentioned below:
ENGINE TEST CYCLE STEP TIME (MIN) CUM TIME (MIN)
Loading and engine start 7 7
Open rocker cover, check oil coming in rocker shaft 3 9
Running in 2 10
Running in 3 12
Running in 5 16
Cylinder head & tappet setting 6 21
Running in 5 26
check HL and set if required 3 28
Performance testing& fuel adjustment if required 5 32
Performance testing& fuel adjustment if required 3 33
Performance testing& fuel adjustment if required 3 35
Check LI &set if required 2 38
87 | P a g e
TABLE 2. Analasys for different engine models
Engine Testing Parameters Model 1 Model 2 Model 3 Model 4 Model 5
Loading and engine start 0 0 0 0 0
Open rocker cover, check oil coming in
rocker shaft 0 0 0 0 0
Running in 0 0 0 0 0
Running in 48 41 44 34 42
Running in 96 82 88 68 84
cylinder head & tappet setting 0 0 0 0 0
Running in 144 123 132 102 126
check HL and set if required 0 0 0 0 0
Performance testing& fuel adjustment if
required 159 129 139 109 129
Performance testing& fuel adjustment if
required 159 129 139 109 129
Performance testing& fuel adjustment if
required 159 129 139 109 129
Check LI &set if required 0 0 0 0 0
Engine stop and unloading 0 0 0 0 0
88 | P a g e
IV. CONCLUSION
This work reports the test bed set-up used for the evaluation of the performance of Tractor engines. The
procedure has proven to be reliable and robust and allows obtaining also a series of additional parameters
describing the engine performance. The described testing procedure allows investigating both a single
parameter’s value, and also the whole operating performance of an engine. The use of this Research paper
allows investigating the entire acquisitions with reduced post processing time. This test stand with the described
post processing procedure will be used in the future works to evaluate the performance of traditional and
alternative fuelled ICEs for both agricultural and co-generative applications.
REFRENCES
[1] B. Shadidi, T. Yusaf, H.H.A. Alizadeh and B. Ghobadian. 2014. Experimental investigation of the tractor
engine performance using diesohol fuel, Appl. Energy. 114: 874–879.
[2] S. Ahmed, M.H. Hassan, M.A. Kalam, S.M. AshrafurRahman, M.J. Abedin and A. Shahir. 2014. An
experimental investigation of biodiesel production, characterization, engine performance, emission and
noise of Brassica juncea methyl ester and its blends, J. Clean. Prod. 79: 74–81.
[3] J J. Pullen, K. Saeed. 2014. Factors affecting biodiesel engine performance and exhaust emissions - Part II:
Experimental study, Energy. 72: 17–34.
[4] K. Nikzadfar, A.H. Shamekhi. 2014. Investigating the relative contribution of operational parameters on
performance and emissions of a common-rail diesel engine using neural network, Fuel. 125: 116–128.
[5] S. S.N. Pang, G.C. Zoerb and G. Wang. 1985. Tractor monitor based on indirect fuel measurement, Trans.
ASABE. 28: 994–998.
[6] D. Friso. 1988. Modellomatematico per l’ottenimentorapido del piano quotatodeiconsumi di unmotore
diesel [Mathematical model to obtain quickly the contour map of diesel engine specific fuel consumptions],
Riv. Di Ing. Agrar. 1: 56–61.
[7] K. Kar, S. Roberts, R. Stone, M. Oldfield and B. French. 2004. Instantaneous exhaust temperature