417 |
P a g e
PUSHOVER ANALYSIS FOR THE RC STRUCTURES
WITH DIFFERENT ECCENTRICITY
Sharmila H C
1, Prof. Mahadeva M
2 1Assistant Professor, Department of Civil Engineering, Dr. S M C E, Bangalore (India)
2Assistant Professor, Department of Civil Engineering,
Shri Pillappa College of Engineering,
Bangalore (India)
ABSTRACT
Inpresent scenario, most ofthe buildingsare often constructedwith irregularitiessuch as softstorey, torsional
irregularity, unsymmetricallayout of in-fill walls, vertical and plan irregularity, etc. Past earthquakestudies
shows that the most of theRC buildings havingsuch irregularities were severely damaged under the seismic
ground motion. The present study is an overview of performance of thetorsionally unbalanced buildingsalso
called as asymmetricbuildings subjecting to pushoveranalysis. In this study theeffect of eccentricity between
Centre of mass (CM) and Centre of story stiffness (CR)on the performanceof the building ispresented. The
performanceof the buildings isassessed as per theprocedure prescribed injATC-40 andFEMA 273.
Keywords: Eccentricity, Pushover analysis, Storey displacement, Storey drift.
I. INTRODUCTION
The most destructive of all natural disaster is earthquake. It is defined as the vibration of earth's surface due to
sudden release of energy in the earth's crust. Earth quake has direct and indirect effects. The result of an
earthquake is generally due to the aspects such as the load path distribution, effect of source and local site.
Earthquake causes the ground to vibrate and the structures resting on it will be subjected to ground motion.
Hence when earthquake happens, the structures which are subjected to dynamic loading will not be considered
external loading but a loading which arises due to the lateral movement of supports. Factors contributing to
structural damages during earthquake are plan irregularity, elevation irregularity, strength, stiffness, mass,
torsional respectively. As mentioned early Earthquake is the most destructive of all natural disaster which
causes both loss of life and loss of economy. Maximum of the losses are due to structural breakdown. Hence, it
is necessary to design the structures scientifically and also considering structure’s symmetry to resist moderate
and severe earthquakes depending on importance of structure and site location.
II. METHODOLOGY
Many seismic methods are available to analyses a structure. Though linear analysis gives appreciable results for
determining the linear behavior of structure, it fails to predict the collapse mechanism land redistribution of
forces on subsequent yielding. To understand the actual behavior of the structure beyond its elastic limit and to
418 |
P a g e
important in seismic design. Hence pushover analysis is popular for determining various parameters like InitialStiffness, Yield point, Maximum Base Shear, Maximum Displacement.
2.1 Pushover Analysis
It is a nonlinear static method used in performance based analysis. It is relatively simple to implement and gives
information about deformation ductility and strength characteristics of the structure and distribution of demands
which help in identifying the critical members likely to reach limit stages during an earthquake event and hence
proper attention can be given while designing and detailing. In pushover analysis a set of lateral loads are
applied along the height of the structure and nonlinearity effects for materials are modeled and then the structure
is pushed until collapse takes place that helps in assessing the status of plastic hinges formed in the structure.
Loading the structure in this way weak links and failure modes of the structure are found. Base shear and roof
displacements at each step can be plotted to generate pushover curve. Load is applied incrementally on the
building frame, the formation of plastic hinges, stiffness degradation, and lateral load versus roof top
displacement for the structure is analytically computed. It gives an insight view of the structure's maximum base
shear capacity which is capable of resisting and the corresponding inelastic drift.
III. DESCRIPTION OF MODEL CONSIDERED FOR STUDY
Type of structure Ordinary moment resisting RC
frame
Plan size 5m x 5m
Number of stories G +3
Height of each storey 4m
Total Building height 16m
Slab 120mm
Grade of concrete M20
Grade of reinforcing steel Fe415
Seismic zone Zone IV
419 |
P a g e
Fig 3.1: Roof and Floor Plan Of Model
Fig 3.2: elevation of the model considered
4 models with same plan and elevation but different column orientation were considered for the study. i.e.,
model with different eccentricities. Eccentricity is the difference between Centre of mass (CM) and Centre of
420 |
P a g e
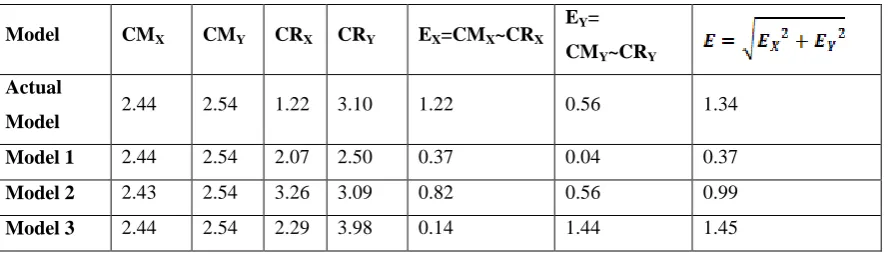
Table 3.1: Values of eccentricities for different models from ETABSModel CMX CMY CRX CRY EX=CMX~CRX
EY=
CMY~CRY
Actual
Model 2.44 2.54 1.22 3.10 1.22 0.56 1.34
Model 1 2.44 2.54 2.07 2.50 0.37 0.04 0.37
Model 2 2.43 2.54 3.26 3.09 0.82 0.56 0.99
Model 3 2.44 2.54 2.29 3.98 0.14 1.44 1.45
The values of eccentricities were rounded up and the models were renamed as below
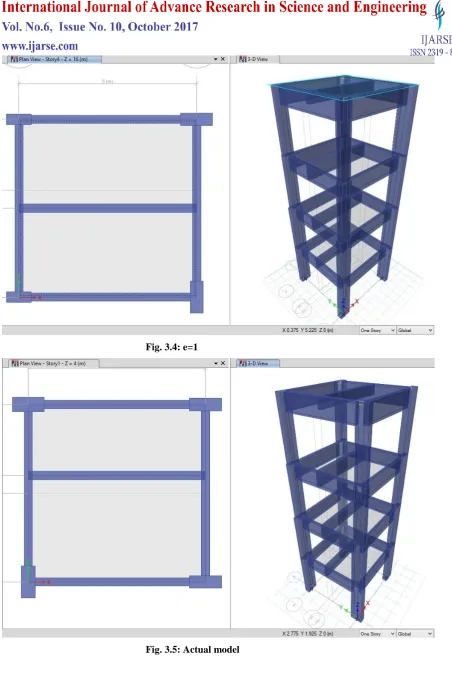
Actual model: model with column orientation as shown in the Fig. 3.3 with eccentricity 1.34
e = 0.4: model 1 with column orientation as shown in the Fig.3.4 with eccentricity 0.4
e = 1: model 2 with column orientation as shown in the Fig. 3.5 with eccentricity 1
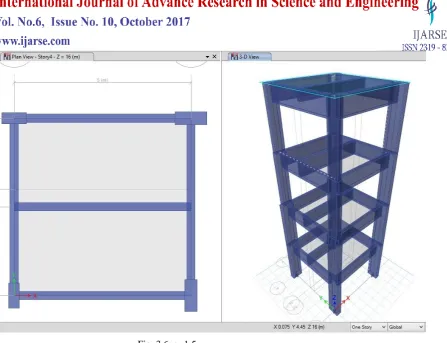
e = 1.5: model 3 with column orientation as shown in the Fig. 3.6 with eccentricity 1.5
421 |
P a g e
Fig. 3.4: e=1422 |
P a g e
Fig. 3.6: e=1.5IV. RESULTS AND DISCUSSIONS
4.1 Storey Displacements
Storey displacement is the movement of each storey in horizontal direction when subjected to lateral loads.
Table 5.1 shows the values of displacements at each storey level for four different models.
Table 4.1: Storey displacement for models with different eccentricities in X and Y direction.
Storey
level
Storey displacement in X direction in mm Storey displacement in Y direction in mm
e =0.4 e=1 e=1.34 e=1.5 e =0.4 e=1 e=1.34 e=1.5
Story4 38.2 37.1 33.5 40.2 41.1 41.5 38.7 38.6
Story3 29.8 29.2 26.2 31.5 32.8 31.6 31.1 30.6
Story2 18.3 17.9 16.5 20.2 21.9 20.3 20.1 19.5
Story1 7 7 6.6 8.5 10 8.6 8.6 7.7
423 |
P a g e
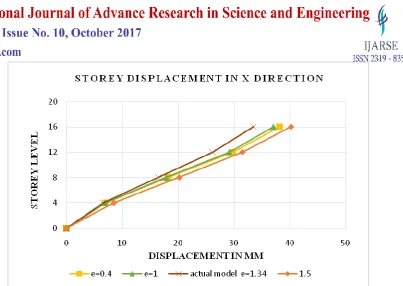
Fig. 4.1: Storey displacement for all the models in X direction
0 4 8 12 16 20
0 10 20 30 40 50
St
o
re
y
Lev
el
Displacement in mm S T O R E Y D I S P L A C E M E N T I N Y
D I R E C T I O N
e=0.4 e=1 actual model e=1.34 e=1.5
Fig. 4.2: Storey displacement for all the models in Y Direction
Figure 4.1 and Figure 4.2 shows the displacement of each storey along the height of the building for models
along X and Y direction respectively. From the data presented in table 5.1 for displacement of the building in X
and Y direction, it can be observed that, the displacement in the actual model is varying almost linearly from
base to the roof. The same behaviour is observed for all the models. In the X direction the storey displacement
in all the storeys decreases with increase in eccentricity up to e = 1.34(actual model) but the storey displacement
increases in the model with e = 1.5 this is because, in the model with e = 1.5 2 columns are oriented in X
direction and 2 columns are oriented in Y direction but in the other models, all columns are oriented in X
direction (e = 0.4) and one column oriented in the Y direction (e = 1, e = 1.34). The displacement in top storey
decreases from 38.2mm to 33.5mm with increase in eccentricity from e = 0.4 to e = 1.34 ( actual model) but in
424 |
P a g e
gradually decreasing with increasing eccentricity in all the models. The displacement in top storey decreasesfrom 41.1mm to 38.6mm with increase in eccentricity from e = 0.4 to e = 1.5.
4.2 Storey Drift
Drift is the relative motion of each storey of the building with respect to storey below. Drifts indicate the lateral
movement of the building model. Table 5.2 shows the values of storey drift at each storey level for four different
models.
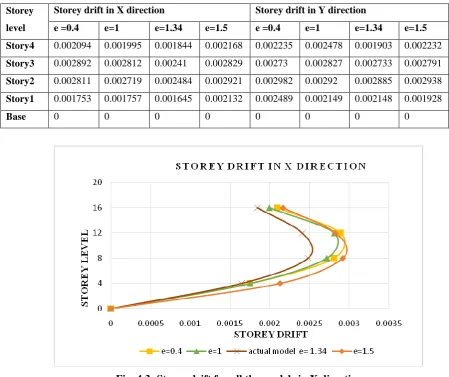
Table 4.2: Storey drift for models with different eccentricities in X and Y direction.
Storey
level
Storey drift in X direction Storey drift in Y direction
e =0.4 e=1 e=1.34 e=1.5 e =0.4 e=1 e=1.34 e=1.5
Story4 0.002094 0.001995 0.001844 0.002168 0.002235 0.002478 0.001903 0.002232
Story3 0.002892 0.002812 0.00241 0.002829 0.00273 0.002827 0.002733 0.002791
Story2 0.002811 0.002719 0.002484 0.002921 0.002982 0.00292 0.002885 0.002938
Story1 0.001753 0.001757 0.001645 0.002132 0.002489 0.002149 0.002148 0.001928
Base 0 0 0 0 0 0 0 0
425 |
P a g e
Fig. 4.4: Storey drift for all the models in Y direction
Figure 4.3 and Figure 4.4 shows the storey drift along the height of the building for each model in X and Y
direction respectively. From the data tabulated in table 4.2 it can be observed that the storey drift is zero at the
base and more at storey 2 and 3 for all the models. In the X direction, storey drift in 2 storey decreases from
0.002811 to 0.002484 with increase in eccentricity from e = 0.4 to e = 1.34 (actual model) but it is increased to
0.002921 in model with e = 1.5 this is because 2 columns are oriented in X and Y direction. The storey drift in
model with e = 1 and e = 1.34(actual model) are not same though one column is oriented in Y direction, this is
because the column which is oriented in Y direction in both the models is different i.e., in actual model CL19
and in model with e = 1 CL20 is oriented in Y direction. In the Y direction the drift is zero at the base and it is
almost same for all the models in 2 and 3 storey. The actual model shows drift of 0.001903 and model with e =
1 shows 0.002478 drift at top storey though one column is oriented in Y direction this is again because not same
columns are oriented in Y direction.
V. CONCLUSION
Lateral displacement capacity of the structure decreases with increase in eccentricity in both X and
Y direction.
Storey drift decreases with increases in eccentricity in X direction but it is almost same with
increase in eccentricity in Y direction.
REFERENCES
[1] Applied Technology Council, ATC-40 (1996), “Seismic Evaluation and Retrofit of Concrete Buildings”,
Volume 1, California
[2] Federal Emergency Management Agency (1997), FEMA 273, “NEHRP Guidelines for the Seismic
426 |
P a g e
[3] IS- 1893- Part I: 2002, “Criteria for Earthquake Resistant Design of Structures”, Bureau of Indian Standards,New Delhi.
[4] Akanshu Sharma, G.R. Reddy, K.K Vaze(2012), “Nonlinear seismic analysis of reinforced concrete framed
structures considering joint distortion”Reactor Safety Division.
[5] B.G. Naresh Kumar et al.,(2012) “seismic performance evaluation of RC framed building-An approach to
torsionally asymmetric building”IOSR Journal of engineering (IOSRJEN), Vol. 2, Issue 7(July 2012), pp
01-12.
Biographaical Data: