304 | P a g e
STUDY ON SESMIC PERFORMANCE OF RC
BUILDING USING PUSHOVER ANALYSIS
Deepa.T
1, Chandrashekar V.C
2 1,2Assistant Professor, Dept. of Civil Engineering,
Dayananda Sagar College of Engineering Bangalore, Karnataka, (India)
ABSTRACT
Earthquake is one of the major natural event to make the structures to collapse now a days. India is divided into four
seismic zones, structures situated in high seismic zone experiences huge damage when earth shakes, hence to
prevent these harms, seismic design is also taken into consideration while designing the structure located in any of
the seismic zone. To design the structures for seismicity, there are many methods of analysis, one of the popular
method is nonlinear static analysis procedure. In present study, the building of plan dimension (30x18) m assumed
to be located in different parts of Karnataka state and response of the structure to ground motion for both code
defined and user defined response spectra is compared and plotted, and also present study consists of applying
lateral load, in a determined pattern to the structure in small percentage increase, that is pushing the modeled
structure or structural element and plotting the whole functional shear force and related lateral displacement at
each step, until the structure attains collapse condition. Seismic resistant design philosophy incorporates the non-linear response of the structure by using appropriate response reduction factor (R). The value of R is directly related
to the ductility level provided in the structure. Greater the assumed value of R, greater will be the ductility in the
structure. Use of higher values of R is encouraged because of significant reduction in base shear leading to more
economic structure. SAP2000 analytical tool is used for the analysis. It is found that, lateral displacement in case of
user defined response spectra is less as compared to code defined response spectra, and also performance point of
user defined spectra is less than code defined spectra.
Keywords: Diagonal Strut, Nonlinear Static Analysis, Pushover analysis, Response Spectra,
Redundancy factor, Response reduction factor, SAP2000.
I. INTRODUCTION
1.1 General
seismic code is also taken, and pushover analysis is done to see the behavior of structures for these two response spectra and compare the result. There has been a considerable increase in the construction of tall buildings both residential and commercial and the modern trend is towards more tall and slender structures. Thus the effects of lateral loads like wind loads, earthquake loads and blast forces are attaining increasing importance and almost every designer is faced with the problems of providing adequate strength and stability against lateral loads. In the present study an RC building is analyzed by varying plastic hinge length and its location for bare and in filled frames.
1.2 User Defined Response Spectra
User defined response spectra taken from the previous investigation by T.G. Sitharam on seismic hazards of different parts of Karnataka State.
Fig 1: User Defined Response Spectra (Developed by Researchers)
1.3 Response Reduction Factor
Response reduction factor (R) is characterized diversely in various nations for various sorts of basic frameworks. In Indian seismic code, IS1893:2002, estimation of R for strengthened solid structure is indicated taking into account, Ordinary Moment Resisting Frame (OMRF) and Special Moment Resisting Frame (SMRF). The estimation of R changes from 3-5 in IS code according to kind of opposing edge, however the current writing does not give data on what premise R qualities were considered Response reduction factor consists of majorly three parameters; strength, redundancy,ductility.
R = Rs*Rμ*RR
Where RS, RR, and Rμ represents over strength, redundancy and ductility factors, respectively.
The strength factor (RS) is a measure of the built-in over strength in the structural system and is obtained by dividing the
ultimate base shear (Vu) by the design base shear (Vd). The ductility factor (Rµ) is a measure of the global nonlinear
response of a structural system in terms of its plastic deformation capacity. The redundancy factor, (RR) is measure of
Fig: 2 Typical Pushover response curve for evaluation of response reduction factor, R
1.4 Pushover Analysis
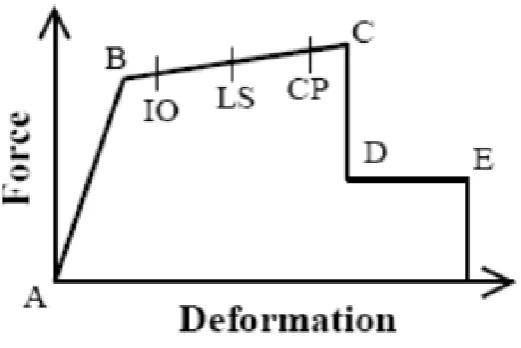
A stagnant nonlinear pushover examination is a system used to gage seismic structural deformation. In this system the connected shear power and the corresponding displacements are plotted by applying monotonically expanding even loads in a prearranged way on the structure, until the structure accomplishes the disappointment criteria. SAP defines plastic hinge properties as per FEMA-356.Hinge property defined in the form of force curve with five points labelled A, B, C, D, and E shown in fig3. The value of these points obtained from moment curvature relationship of element depends on the type of geometry, material property, longitudinal reinforcement, shear reinforcement and loads subjected to particular member
Fig -3: A-B-C-D-E Curve for Force vs. Deformation
II. METHODOLOGY
Seismic analysis of the RC building generally includes calculation of storey drift, time period, lateral displacement and nonlinear static analysis includes the formation of hinges and performance point. To determine these factors, SAP2000 analytical tool is used.
2.1 Building Description
The plan dimension of the building is (30x18) m. G+4 3D model of building with each floor height is 3m and 5 bays along X-direction and 3 bays along Y-direction with 6 m spacing for both direction is modelled in SAP2000. Building is modelled as soft storey and infill walls are modelled as equivalent diagonal strut, width of the strut is calculated and assigned as infill panels.
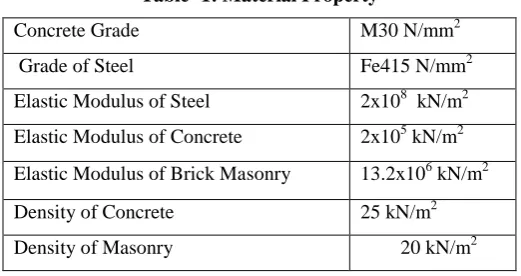
2.2 Material Property
The basic material properties used for the analysis of RC building are as follows.
Table -1: Material Property
Concrete Grade M30 N/mm2
Grade of Steel Fe415 N/mm2 Elastic Modulus of Steel 2x10⁸ kN/m2
Elastic Modulus of Concrete 2x10⁵ kN/m2
Elastic Modulus of Brick Masonry 13.2x10⁶ kN/m2
Density of Concrete 25 kN/m2 Density of Masonry 20 kN/m2
2.3 Section Properties and Loads
Table -2: Section Property and Loads
SECTION PROPETIES Beam (250X500) mm
Interior Column (500X500) mm
Exterior Column (250X500) mm
Thickness of Slab 100 mm
Thickness of Wall 250 mm
Storey Height 3 m
Floor finish, DPC 2 kN/m2 FBBM 15 kN/m2
PPT 4.5 kN/m2
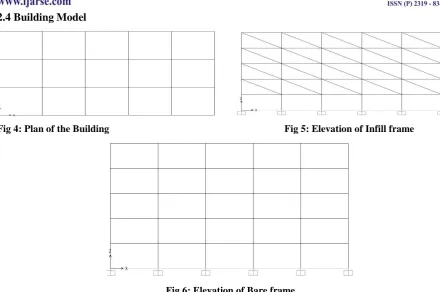
2.4 Building Model
Fig 4: Plan of the Building Fig 5: Elevation of Infill frame
Fig 6: Elevation of Bare frame
2.5. Strut width calculation
Stafford Smith equation for calculation of equivalent diagonal strut width is considered. Stiffness of the masonry walls is considered.
Smith and Henry,
w =
2h 2L2
1
2.6 Plastic Hinge length calculation
III. RESULTS AND DISCUSSION
3.1 Natural Time Period
It is the time of undamped free vibration of the building. Natural period obtained from SAP2000 for the building located in different cities of Karnataka State are plotted and tabulated.
Table- 4:Natural Period along longitudinal direction Table-5: Natural Period along transverse direction
Due to the presence of infill stiffness the natural period gets reduced as compared to bare frame natural period. The natural period directly affects the spectral acceleration Sa/g, it can be observed in Fig.2 of IS: 1893(Part1)-2002, where the spectral acceleration coefficient increases as the time period reduces.
3.2 Lateral Deformation
When horizontal loads are applied to the structures along its height, it deforms laterally. The amount of deformation obtained from SAP2000 for both infilled and bare frame model along transverse and longitudinal direction are plotted and tabulated.
Table-6: Lateral displacement (mm) along longitudinal direction(Located in Bangalore)
Fig: 7 Deformation profile along longitudinal direction (Located in Bangalore) Mode Natural Time Period (S)
Infill frame Bare frame
1 0.6 1.045
2 0.553 0.947
3 0.538 0.915
4 0.151 0.327
Mode Natural Time Period (S)
Infill frame Bare frame
1 0.639 1.277 2 0.611 1.172
3 0.523 1.063 4 0.153 0.402
Storey No. Code defined response spectra User defined response spectra
Infill Bare Infill Bare
5 2.03 4.23 0.4 0.8
4 1.96 3.80 0.389 0.71
3 1.85 3.06 0.366 0.57
2 1.71 2.04 0.338 0.38
1 1.47 0.87 0.292 0.17
Table -7: Lateral displacement (mm) along Longitudinal direction (Located in Mangalore)
Fig: 8 Deformation profile along longitudinal direction (Located in Mangalore)
3.3 Storey Drift
As per Clause: 7.11.1 of IS: 1893 (Part 1): 2002 the storey drift for RC building is limited to 0.004 times the storey height, that is 0.4% of storey height.
Table -8: Inter Storey Drift for Both Longitudinal and Transverse Direction
Storey No.
Displacement (mm)
Storey No.
Displacement (mm)
Infill Bare Infill Bare
5 1.84 2.49 5 0.07 1.21
4 3.73 4.62 4 0.12 2.57
3 5.78 6.86 3 0.15 4.17
2 7.45 8.62 2 0.26 5.68
1 6.15 7.04 1 4.28 6.18
Storey No.
Code defined response spectra
User defined response spectra Infill Bare Infill Bare
5 3.24 8.31 0.227 0.47
4 3.14 7.47 0.220 0.428 3 2.96 6.01 0.207 0.344
2 2.74 4 0.191 0.231 1 2.36 1.71 0.165 0.1
Fig: 9 Storey drift profile in transverse direction Fig: 10 Storey drift profile in longitudinal direction
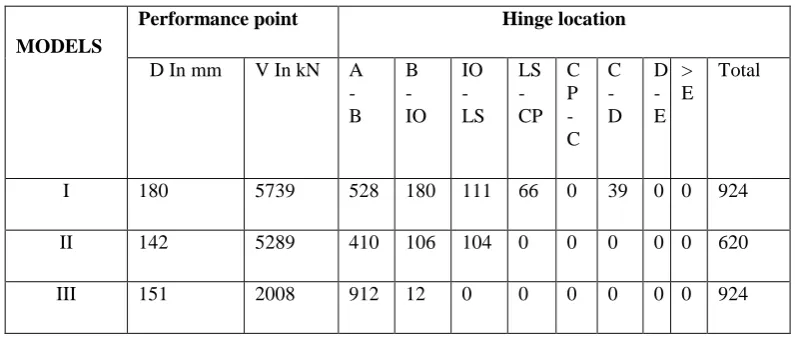
3.4 Formation of Hinges and their Location
Table-8: Formation and location of hinges
MODELS
Performance point Hinge location
D In mm V In kN A - B B - IO IO - LS LS - CP C P - C C - D D - E > E Total
I 180 5739 528 180 111 66 0 39 0 0 924
II 142 5289 410 106 104 0 0 0 0 0 620
III 151 2008 912 12 0 0 0 0 0 0 924
Model I - Infill along Longitudinal Direction Model II - Bare along Longitudinal Direction Model III - Infill along Transverse Direction Mode IV - Bare along Transverse Direction
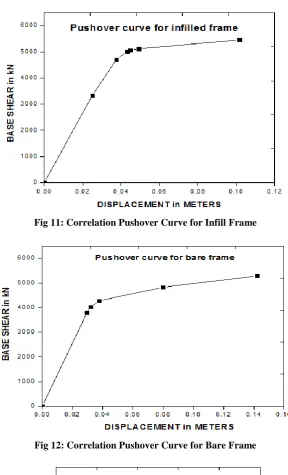
Table -9: Base shear and Displacement values
Models Base shear
(kN)
Displacement(mm)
Model 1 5530.212 122
Model 2 6670.024 97
Model 3 5535.196 122
Fig 11: Correlation Pushover Curve for Infill Frame
Fig 12: Correlation Pushover Curve for Bare Frame
Fig 14: Comparison of correlation results with bare frame in longitudinal direction
Fig 15: Comparison of pushover curves for infill framewith hinges of different hinge length formulations.
Table-10: Base shear and displacement values for bare frame
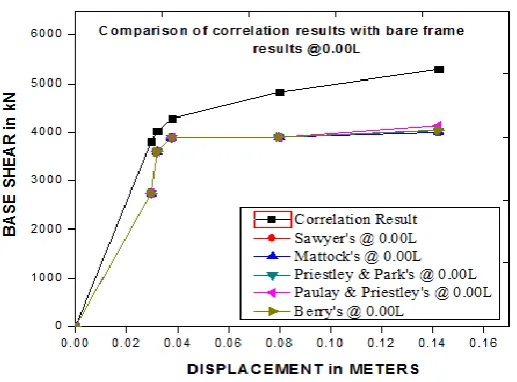
Fig 17: Comparison of correlation result with bare frame result at 0.00L
Fig 18: Comparison of correlation result with infill frame result at 0.00L
IV. CONCLUSIONS
[1] On the basis of present work, following conclusion are drawn,
[2] Lateral displacement for code defined spectra is 5.07 times the user defined spectra.
[3] The analytical natural time period do not agree with time period obtained using empirical expression of the code for all the cities considered, there high degree of dynamic analysis should be carried out to design such type of buildings.
[4] The inter storey obtained for the building located in different cities are within permissible limit prescribed by Indian Standards.
[5] Bare frame structures are having highest R value as compared to the infill frame structure.
[6] There is significant difference between the value of the Response reduction factor given in the IS code and that obtained from analysis.
[8] Performance point is very close for modal, FEMA and IS-1893-2002 loading. This is due to the close similarity between the load patterns.
[9] Considering infill frame and bare frame, infilled frames have the more stiffness than the bare frame. [10]Base shear increases with the increases in length of the hinge location.
REFERENCES
[1] Abhijeet. A. Maske et.al. “Pushover analysis of reinforced concrete framed structures: A case Study” International Journal of Advanced Technology in Engineering and Science, Volume No.02, Issue No. 10, October 2014. [2] ATC-40, “Seismic evaluation and retrofit of concrete buildings” Volume -1, California Seismic Safety Commission. [3] G.R.Patil, Achyut S “Pushover Analysis of RCC Building with Soft Storey at Different Levels”, IOSR Journal of
Mechanical and Civil Engineering.
[4] Indian Standard: 1893(Part-1)-2002, “Criteria for Earthquake Resistance Design of Structures” General Provisions and Buildings.
[5] Indian Standards: 456-2000, “Plain and Reinforced concrete-Code of Practice”
[6] Mahendra Wadia, Nitin Choudhry. “Pushover Analysis of RC frame building n with Shear wall” IOSR Journal of Mechanical and Civil Engineering (IOSR- b JMCE), Volume 11, Issue 2 Ver. V (Mar- Apr. 2014), PP 09-13. [7] Md.Rihad, S.S.Dyavanal“Seismic evaluation of multistorey building with soft storey” International Journal of
Research in Engineering and Technology eISSN: 2319-1163 | pISSN: 2321-7308.
[8] Neethu K.N, Saji K.P “Pushover Analysis of RC building” International Journal of Science and Research (IJSR) ISSN (Online): 2319-7064.
[9] P.Agarwal and M.Shrikande, “Earthquake resistance Design of Structures”, Prentice-Hall of India pvt ltd New Delhi, India.
[10] Rahiman.G.Khan, M.R. Vyavahare “Pushover Analysis of Tall Building with soft storey at different level” International Journal of Engineering Research and Application, Vol.3, Issue.4, Jul-Aug 2013, pp.176-185. [11] Ravi Kanitkar, Vasant Kanitkar “Seismic performance of conventional multi storey building with open ground
floors for vehicular parking” February 2014, The Indian Concrete Journal.
[12] Ravikumar C.M, Venkat Reddy et.al, “Probabilistic Format for Seismic Risk analysis of RC Buildings in the Indian Context", IUP Journal of Structural of Engineering, 2013
[13] RVRK Prasad, Akshay.V.Raut “Pushover Analysis G+3 reinforced concrete building with soft storey” Journal of Mechanical and Civil Engineer, Vol.11, Issue.4, Ver. I (Jul- Aug. 2014), PP 25-29.
[14] S.S.Dyavanal, Praveen Rathod “Pushover Analysis of Seven storied RC building with openings in Infill wall” International Journal of Engineering Trends and Technology (IJETT) – Volume 14 Number 3 – Aug 2014. [15] T.G.Sitharam, Naveen James et.al “A Study on seismicity and seismic hazard of Karnataka State” mmiIndian
Academy of science, IISc, Bangalore.
[16] S.Devi, Dr.G.Nandini Devi (2016) “Seismic Demand of Reinforced Concrete Structural Systems”.
[17] SanmiDespande(2015) “Formulation of the seismic response reduction factor for earthquake resistant design”. [18] Dr. S. N. Tande (2013) “An Investigation of Seismic Response Reduction Factor for Earthquake Resistant Design”. [19] A.L.Deepak (2015) “Formulation of Response Reduction Factor for an RCC Frame and Study on Difference in R [20] factor Based on Seismic Zones”.
[22] reinforced0concrete buildings.”
[23] Rajesh P.0Dhakal and Richard C. Fenwick: “Detailing of nniPlastic0Hinges in Seismic0Design of Concrete0Structures (2008).”
BIOGRAPHICAL NOTES
Prof. Deepa T is working as assistant professor in department of civil engineering from last year in DSCE Bangalore, she also worked as assistant professor in SJMIT Chitradurga for 3 years and she worked as lecturer for 2 years in Prasanna college of engineering Ujire. She received her M.Tech in Civil Engineering with specialization in CAD Structures from Visvesvaraya technological university. Her research is in the field of Earthquake resistant structures, Structural engineering.