International Journal of COPD
Dove
press
O r I g I n A L r e s e A r C h
open access to scientific and medical research
Open Access Full Text Article
Functional imaging using computer methods
to compare the effect of salbutamol
and ipratropium bromide in patient-specific
airway models of COPD
LA De Backer1
Wg Vos2
r salgado3
JW De Backer2
A Devolder1
sL Verhulst1
r Claes1
Pr germonpré1
WA De Backer1
1Department of respiratory Medicine, 2FluidDA, 3Department of radiology,
Antwerp University hospital, Antwerp, Belgium
Correspondence: Lieve De Backer Department of respiratory Medicine, Antwerp University hospital, Wilrijkstraat 10, 2650 edegem, Belgium
Tel +32 3821 5480 Fax +32 3821 4447
email [email protected]
Background: Salbutamol and ipratropium bromide improve lung function in patients with
chronic obstructive pulmonary disease (COPD). However, their bronchodilating effect has not yet been compared in the central and distal airways. Functional imaging using computational fluid dynamics offers the possibility of making such a comparison. The objective of this study was to assess the effects of salbutamol and ipratropium bromide on the geometry and compu-tational fluid dynamics-based resistance of the central and distal airways.
Methods: Five patients with Global Initiative for Chronic Obstructive Lung Disease Stage III COPD were randomized to a single dose of salbutamol or ipratropium bromide in a crossover manner with a 1-week interval between treatments. Patients underwent lung function testing and a multislice computed tomography scan of the thorax that was used for functional imaging. Two hours after dosing, the patients again underwent lung function tests and repeat computed tomography.
Results: Lung function parameters, including forced expiratory volume in 1 second, vital capacity, overall airway resistance, and specific airway resistance, changed significantly after administra-tion of each product. On funcadministra-tional imaging, the bronchodilating effect was greater in the distal airways, with a corresponding drop in airway resistance, compared with the central airways. Salbutamol and ipratropium bromide were equally effective at first glance when looking at lung function tests, but when viewed in more detail with functional imaging, hyporesponsiveness could be shown for salbutamol in one patient. Salbutamol was more effective in the other patients.
Conclusion: This pilot study gives an innovative insight into the modes of action of salbutamol and ipratropium bromide in patients with COPD, using the new techniques of functional imaging and computational fluid dynamics.
Keywords: chronic obstructive pulmonary disease, imaging, computed tomography,
computational fluid dynamics, salbutamol, ipratropium
Introduction
Chronic obstructive pulmonary disease (COPD) is a heterogeneous disorder character-ized by dysfunction of the small and large airways, as well as destruction of the lung parenchyma and its vasculature, in highly variable combinations. The hallmark of COPD is limitation of expiratory flow, which is slowly progressive and irreversible.1,2
Small airway function is still mainly evaluated using specific lung function tests, including flow-volume loops, nitrogen washout, and helium flow volume loops.3 Recently,
there has been a trend towards the identification of new outcome parameters to evaluate
International Journal of Chronic Obstructive Pulmonary Disease downloaded from https://www.dovepress.com/ by 118.70.13.36 on 22-Aug-2020
For personal use only.
Number of times this article has been viewed
This article was published in the following Dove Press journal: International Journal of COPD
Dovepress De Backer et al
lung function and treatment effects in COPD patients. In the literature, suggestions are made to investigate “volume parameters” like forced vital capacity after bronchodilation.4
However, these spirometric tests have their limitations, in that they are effort-dependent, and the deep inspiration and forced expiration required alone can lead to changes in airway tone.5 It
is known that bronchodilator drugs can improve lung mechan-ics in COPD patients, despite little change in forced expira-tory volume in 1 second (FEV1), by decreasing the amount of hyperinflation.6 Also, advanced imaging techniques based on
multislice high-resolution computed tomography (CT) have been used to characterize COPD patients.7 These techniques
allow for evaluation of the density of the parenchyma8 or for
evaluation of airway lumen and wall thickness.9,10 Effects of
bronchodilation on the bronchus-vessel ratio and airway lumen caliber have been studied in COPD patients by De Luca et al11
and Hasegawa et al,12 respectively.
In recent years, a number of studies have used computa-tional fluid dynamics to assess flow behavior in the respira-tory system. The models used have been either idealized or based on realistic geometry,13–15 but very few studies have
used image-based patient-specific models.16,17
Recent studies have indicated the possibility of using a combination of imaging tools and computer methods to pro-vide functionality and to yield additional insight into clinically relevant issues, such as the bronchodilatory effects of inhaled medication. In the past, we have demonstrated a very good cor-relation between spirometric indices like FEV1 and Tiffeneau index (FEV1/vital capacity, an index to discriminate between obstructive and restrictive pathology) and computational fluid dynamics-based calculation of overall and distal airway resistance, ie, from the segmental airways onwards. Therefore, functional imaging can be used to assess functional changes in the distal airways after pharmacological intervention. With this technique, it is possible to make a comparison of the broncho-dilation induced by salbutamol (Ventolin™, GlaxoSmithKline, London, UK) versus ipratropium bromide (Atrovent® HFA,
Boehringer Ingelheim, Ingelheim, Germany).
Salbutamol, a short-acting beta2-agonist, induces bron-chodilation for up to 6 hours. It is used to treat wheezing, dyspnea, and breathing difficulties caused by asthma and COPD, to prevent bronchospasm during exercise, and to improve lung function.18
Ipratropium bromide is a short-acting anticholinergic bronchodilator (muscarinic antagonist) that induces bron-chodilation for up to 6 hours. Beneficial effects include improvement in lung function, wheezing, dyspnea, and health-related quality of life in patients with COPD.18
Comparisons between salbutamol and ipratropium bromide have been previously performed but limited to spiro-metric values and nonfunctional data, like dyspnea scores. In these studies, the degree of bronchodilation achieved with ipratropium bromide was equal to the degree of bronchodila-tion achieved after using a short-acting beta2-agonist.19 Both
compounds improve exercise capacity and reduce dyspnea to a similar extent.20 It is as yet unclear if salbutamol has
a different effect at the level of the peripheral airways in comparison with ipratropium bromide.18
The aim of this study was to compare the effects of salbutamol and ipratropium bromide at the level of all air-ways, especially in the distal and smaller airways. Recently developed functional imaging techniques offer the possibility to make these comparisons in detail and in a more sensitive way than is possible using the classical lung function tests. We compared these techniques in order to determine the most powerful method for assessment of bronchodilation in COPD.
Materials and methods
Patients
We recruited five patients with severe but stable COPD (three men and two women with Global Initiative for Chronic Obstructive Lung Disease [GOLD] Stage III disease). The degree of airway obstruction was verified by a baseline pul-monary function test after at least 12 hours of bronchodilator withdrawal. Lung function testing was performed according to European Respiratory Society guidelines.21 The study
pro-tocol was approved by the local ethics committee and each patient gave informed consent to all procedures. Baseline patient characteristics are given in Table 1.
study design
The study was an open, randomized, two-way crossover, pilot study involving a screening visit and 2 study days
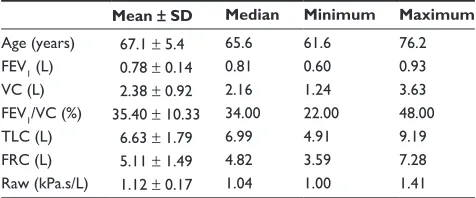
Table 1 Baseline characteristics of the included patients with COPD
Mean ± SD Median Minimum Maximum
Age (years) 67.1 ± 5.4 65.6 61.6 76.2 FeV1 (L) 0.78 ± 0.14 0.81 0.60 0.93 VC (L) 2.38 ± 0.92 2.16 1.24 3.63 FeV1/VC (%) 35.40 ± 10.33 34.00 22.00 48.00 TLC (L) 6.63 ± 1.79 6.99 4.91 9.19 FrC (L) 5.11 ± 1.49 4.82 3.59 7.28 raw (kPa.s/L) 1.12 ± 0.17 1.04 1.00 1.41
Abbreviations: FeV1, forced expiratory volume in 1 second; VC, vital capacity;
TLC, total lung capacity; sD, standard deviation; FrC, functional residual capacity.
International Journal of Chronic Obstructive Pulmonary Disease downloaded from https://www.dovepress.com/ by 118.70.13.36 on 22-Aug-2020
Dovepress Computerized functional imaging of airways in COPD
separated by at least 1 week to avoid any carryover effect. Prior to the first dosing, patients underwent lung function testing (spirometry, body plethysmography) and low-dose, high-resolution CT scanning of the thorax. After dosing, the patients once more underwent lung function tests and low-dose, high-resolution CT scanning. These measurements were done 90 ± 30 minutes after the dose. The assessments on the second study day were the same as those done on the first day, except that the CT pre-dose was not taken to limit radiation exposure.
study medication
The study medications, salbutamol and ipratropium bro-mide, were supplied by GlaxoSmithKline and Boehringer Ingelheim, respectively. The original medication and pack-aging were used. At each visit, the patients received either four puffs of salbutamol 100 µg or four puffs of ipratropium bromide 20 µg. The medication was administered by the investigator or by a member of the clinical unit designated by the investigator. Patients were trained to use the devices.
After gentle expiration, a dose of salbutamol 100 µg or ipratropium bromide 20 µg was inhaled in one breath to total lung capacity from a valved spacer device. The breath was then held for 5–10 seconds before the subject exhaled. Four separate doses (total dose 400 µg of salbutamol or 80 µg of ipratropium bromide) were delivered at 30-second intervals.
Inhaled corticosteroids were permitted during the study, provided that the dose remained constant for at least 6 weeks prior to the first visit and remained constant throughout the study period. An appropriate washout period for bronchodi-lating products was determined to be at least 24 hours for long-acting bronchodilators and at least 6 hours for short-acting bronchodilators prior to both study days.
CT and segmentation
High-resolution CT scans of the thorax can detect airways in the respiratory system down to the small airways with a diameter of 1–2 mm when imaged at total lung capacity.22–25
From high-resolution CT images, patient-specific values can be derived for the lumen cross-sectional area, airway length, airway wall thickness, and the extent of emphysema. These values can be assessed either in a particular plane or by analyz-ing multiple slices over a defined longitudinal region. These high-resolution CT scans enable three-dimensional recon-struction of the airway geometry regions to be developed. This geometry reconstruction is performed by semiautomatic segmentation of the airways. This involves identification and
grouping of voxels that belong to a specific anatomic structure, including the airway tree, the lungs or lobes or, in some cases, the fissures. A three-dimensional reconstruction of the mor-phology can then be performed. Outcome parameters include lung volumes, lobar volumes, and local airway volumes. By assessing multiple scans of the same patient, it is possible to analyze the changes in different parameters either over time (eg, before and after bronchodilation), or at several breathing levels, such as forced residual capacity or total lung capacity. In this study, at each CT data collection time point, two CT thorax scans were taken on a 64-slice GE LightSpeed VCT scanner. One scan was taken at total lung capacity, the other at functional residual capacity. Lung volumes were controlled using adapted spirometry during the high-resolution CT procedure. Scans were taken in a dose reduction protocol, ie, reduced tube voltage (100 kV) and tube current as a func-tion of patient weight (1 mAs/kg). In addifunc-tion to this, there was an increase in noise factor to reduce the radiation dose further. Total radiation dose for the high-resolution CT scans taken in this study per patient was less than 12 mSv. Scanning time was less than 5 seconds per scan, voxel dimension was approximately 0.5 mm3, and the scanning region extended
from the larynx down to the diaphragm.
From the high-resolution CT data, three-dimensional reconstruction of the airway geometry at total lung capacity was performed using semiautomatic segmentation of the airways up to the point where no distinction could be made between intraluminal and alveolar air (fifth to seventh bifurca-tion, airway diameter approximately 1 mm). In addibifurca-tion, the lung lobes were segmented both at total lung capacity and functional residual capacity by identifying the fissure planes and subsequently using these surfaces as cutting objects. By segmenting the lung lobes at two lung levels it was possible to assess lobar expansion and hence the internal patient-specific mass flow distribution in the lower airways. The segmentation and three-dimensional model reconstruction was performed using a commercially developed and validated software pack-age (Mimics®, Materialise, Leuven, Belgium). To determine
the local change in airway volume, the models were subdi-vided into individual branches according to the nomenclature defined by Ikeda (as described in Netter26). For each individual airway branch, the volume (iVaw) was determined before and after the administration of the medication.
Computational fluid dynamics
Functionality can be added to the static segmented images by applying computational fluid dynamics methods to characterize airway resistance and aerosol deposition patterns.
International Journal of Chronic Obstructive Pulmonary Disease downloaded from https://www.dovepress.com/ by 118.70.13.36 on 22-Aug-2020
Dovepress De Backer et al
The postprocessing involves airway wall smoothing and reduction of segmentation artifacts. The airway model is then converted into a computational grid using a commercial soft-ware package (T-Grid®, Fluent Inc, Lebanon, NH) in order to
solve the Navier-Stokes flow equations numerically. Flow is incompressible and isothermal, and most recent computational fluid dynamics models take into account the image-based internal flow distribution by including lobar expansion as a boundary condition. Computational fluid dynamics enables the determination of flow properties, including pressure, veloc-ity, and density inside the entire flow domain. This allows the calculation of airway resistance by assessing the total pressure drop and airflow rate. Mesh size was around 4.5 × 10⁶ cells.
Steady flow simulations on these grids were performed using a commercial computational fluid dynamics solver (Fluent Inc). A mass flow of 30 L/minute was specified as the boundary condition at the trachea to reflect normal tidal breathing. At the outlets, the static pressure was defined using an iterative process to reflect the internal mass flow distribution matching the lobar expansion as derived from the CT data. The flow was considered laminar, incompressible, and adiabatic. Detailed descriptions of the segmentation and flow simulation proce-dures can be found in De Backer et al.24
From the computational fluid dynamics data, the iRaw was obtained. iRaw was defined as:
iRaw =∆p
F
where ∆p is the total pressure drop over a certain region and F is the mass flow rate of air through this region.
statistical analysis
Comparisons of airway characteristics before and after medication, as well as changes in airway characteristics
between both medications, were assessed using the Wilcoxon matched-pairs test.
Comparisons between pulmonary function tests and func-tional imaging were made using Spearman rank correlations. For all analyses, P , 0.05 was defined as statistically signifi-cant and P , 0.1 as a trend. Analyses were performed using Statistica® software (StatSoft, Sandton, South Africa).
Results
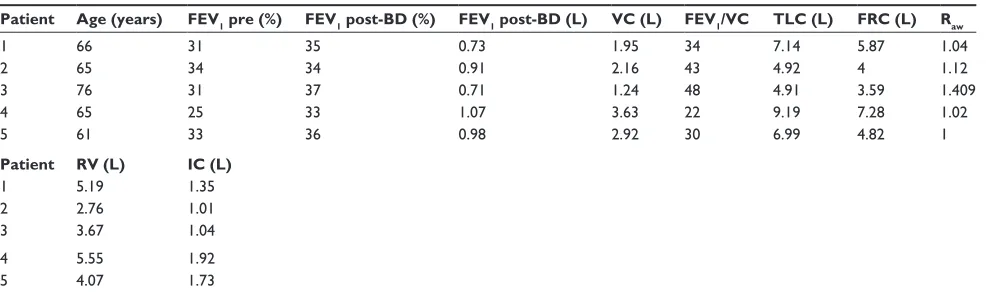
All five patients completed the study. The patients (three male and two female, mean age 67 years) had GOLD Stage III COPD, a mean 71 pack-year smoking history, and an aver-age FEV1 of 35% predicted (Tables 1 and 2). A detailed overview of the results and the abbreviations used can be found in Table 3 and Figures 1–3.
For these five patients, there was a significant increase in vital capacity (P = 0.04) and decrease in airway resis-tance (Raw, P = 0.04) and specific resistance (sRaw, P = 0.04) 1.5 hours after inhalation of salbutamol. Functional imag-ing parameters showed an increase in total airway volume (iVawtot, P = 0.04) after salbutamol, with a small rise in iVawcentr (P = 0.08) and a large rise in iVawdist (P = 0.04). Also, after salbutamol, iRawtot decreased (P = 0.04) due to a reduction in iRawcentr (P = 0.08) and iRawdist (P = 0.08).
After ipratropium bromide, there was a rise in FEV1 (P = 0.04) and a trend towards an increase in vital capac-ity (P = 0.08), and a decrease in Raw (P = 0.08) and sRaw (P = 0.08). Functional imaging parameters show an increase in iVawtot (P = 0.04), with a small rise in iVawcentr (P = 0.04) and a large rise in iVawdist (P = 0.04). Also, after ipratropium bromide, iRawtot decreased (P = 0.04) due to a decrease in iRawcentr (P = 0.08) and iRawdist (P = 0.08).
No significant differences were found between changes in lung function testing and functional imaging parameters
Table 2 Baseline lung function values in individual patients
Patient Age (years) FEV1 pre (%) FEV1 post-BD (%) FEV1 post-BD (L) VC (L) FEV1/VC TLC (L) FRC (L) Raw
1 66 31 35 0.73 1.95 34 7.14 5.87 1.04
2 65 34 34 0.91 2.16 43 4.92 4 1.12
3 76 31 37 0.71 1.24 48 4.91 3.59 1.409
4 65 25 33 1.07 3.63 22 9.19 7.28 1.02
5 61 33 36 0.98 2.92 30 6.99 4.82 1
Patient RV (L) IC (L)
1 5.19 1.35
2 2.76 1.01
3 3.67 1.04
4 5.55 1.92
5 4.07 1.73
Abbreviations: BD, bronchodilator; rFC, residual functional capacity; rV, residual volume; IC, inspiratory capacity; FeV1, forced expiratory volume in 1 second; TLC, total
lung capacity; VC, vital capacity; raw, airway resistance
International Journal of Chronic Obstructive Pulmonary Disease downloaded from https://www.dovepress.com/ by 118.70.13.36 on 22-Aug-2020
Dovepress Computerized functional imaging of airways in COPD
Table 3
Lung function changes after salbutamol and ipratropium bromide
Patient number
Δ FEV 1 (% pred) Δ FEV 1 (% pred) Δ
VC (L)
Δ
VC (L)
Δ
R (kPa/L)
Δ
R (kPa/L)
Δ
specR (kPa)
Δ
specR (kPa)
Lung function testing 1
4 6 0.22 0.37 -0.120 -0.260 -1.44 -1.59 2 0 1 0.23 -0.01 -0.161 0.089 -1.00 0.19 3 6 4 0.28 0.27 -0.479 -0.201 -2.06 -0.91 4 8 6 0.55 0.54 -0.560 -0.461 -4.46 -3.38 5 3 6 0.04 0.20 -0.171 -0.339 -0.89 -1.51 Average 4.2 3.6 0.26 0.27 -0.298 -0.234 -1.97 -1.44 Δ Vtot (%) Δ Vtot (%) Δ Vcent (%) Δ Vcent (%) Δ Vdist (%) Δ Vdist (%) Δ Rawtot (%) Δ
Rawtot (%)
Δ Rawcent (%) Δ Rawcent (%) Δ Rdist (%) Δ Rdist (%)
Functional imaging 1
18.1 8.3 9.9 3.7 38.8 19.9 -44 -19 -30 0 -54 -33 2 11.1 8.0 5.7 5.6 39.9 20.8 -55 -41 -15 -16 -68 -49 3 19.6 10.9 10.0 5.8 80.6 43.7 -63 -56 -8 -13 -82 -71 4 0.7 17.6 –3.0 5.4 15.8 67.5 -27 -64 24 0 -37 -77 5 9.4 4.5 6.8 0.9 15.9 13.7 -34 -31 -37 -34 -33 -30 Average 10.8 10.5 5.0 4.5 31.6 32.4 -47.6 -44.5 -17.7 -16.7 -57.2 -58.1 Abbreviations: F eV 1 , forced expiratory volume in 1 second; VC, vital capacity; R, airway resistance; specR, specific airway resistance (corrected for lung volume R × F r C); Vtot , total volume of the segmented airways; Vcentr , volume of the central airways until the third bifurcation; Vdist , volume of the distal airways from third to seventh bifurcation; rawtot , airway resistance of all segmented airways; rawcentr , airway resistance on the central airways until the third bifurcation; rawdist
, airway resistance of the distal airways from third to seventh bifurcation; % pred, per
centage predicted.
Notes:
g
rey shading indicates changes after salbutamol; no shading indicates changes after ipratropium bromide.
International Journal of Chronic Obstructive Pulmonary Disease downloaded from https://www.dovepress.com/ by 118.70.13.36 on 22-Aug-2020
Dovepress De Backer et al
0
Before salbutamol
FEV
1
(% pred
)
After
salbutamol ipratropiumBefore ipratropiumAfter 10
20 30 40 50 60 70 80 90
Mean Mean±SE Mean±SD 100
0.0
Before salbutamol
VC (L
)
After
salbutamol ipratropiumBefore ipratropiumAfter 0.5
1.0 1.5 2.0 2.5 3.0 3.5 4.0 4.5 5.0
0.0
Before salbutamol
Raw
(kPa.s/L
)
After
salbutamol ipratropiumBefore ipratropiumAfter 0.2
0.4 0.6 0.8 1.0 1.2 1.4 1.6
0
Before salbutamol
sR
aw
(kPas)
After
salbutamol ipratropiumBefore ipratropiumAfter 1
2 3 4 5 6 7 8 9 10
Figure 2 Changes in FeV1, VC, raw and sraw after salbutamol and ipratropium in five COPD patients (GOLD III). All changes are significant (P, 0.05) except the changes
in FeV1 after salbutamol and VC after ipratropium.
75 70 65 60 55 50 45 40 35 30 25 20 10 5 15
0 −5 −10 −15 −20 −25
75 70 65 60 55 50 45 40 35 30 25 20 10 5 15
0 −5 −10 −15 −20 −25
75 70 65 60 55 50 45 40 35 30 25 20 10 5 15
0 −5 −10 −15 −20 −25
75 70 65 60 55 50 45 40 35 30 25 20 10 5 15
0 −5 −10 −15 −20 −25 Change in local airway volume
after ipratropium bromide [%]
Change in local airway volume
after ipratropium bromide [%] Change in local airway volumeafter salbutamol [%] Change in local airway volume after salbutamol [%]
A B
C D
Figure 1 Changes in airway volume based an segmented airways from the CT scan (iVtot) in a patient (upper figures) mainly responsive to salbutamol (B) and less to
ipratropium bromide (A), and in a patient (lower figures) more responsive to ipratropium bromide (C) and less responsive to salbutamol (D).
International Journal of Chronic Obstructive Pulmonary Disease downloaded from https://www.dovepress.com/ by 118.70.13.36 on 22-Aug-2020
Dovepress Computerized functional imaging of airways in COPD
after salbutamol or after ipratropium bromide. Looking at the functional imaging parameters, we noticed a trend towards a higher response to salbutamol. However, for one patient, we observed an inverse trend, with hyporeactivity to salbutamol. Repeating the statistical analysis without this hyporesponder to salbutamol, we obtain a trend in favor of salbutamol (com-pared with ipratropium bromide) for the change in iVawtot (P = 0.07) and iRawtot (P = 0.07). Lung function testing did not detect any differences between salbutamol and ipratropium bromide. When we compared functional radiologic measure-ments with classical lung function measuremeasure-ments (Tables 4 and 5), we only found a significant Spearman rank correlation between resistance and Rtot. Functional imaging detects small differences and is more sensitive, which explains why these correlations are not strong.
Discussion
Using functional imaging, we demonstrated that central but mainly distal airway dimensions (third to seventh bifurcation) increased significantly after an inhaled beta2-agonist (salbutamol) and anticholinergic agent (ipratropium bromide) in patients with severe COPD. Corresponding changes in lung function (spirometry, airway resistance) could be observed, but the changes seen on lung function testing were overall less pronounced than the changes in airway caliber seen by the imaging method. The changes observed with imaging were even greater when airway resistance calculated using
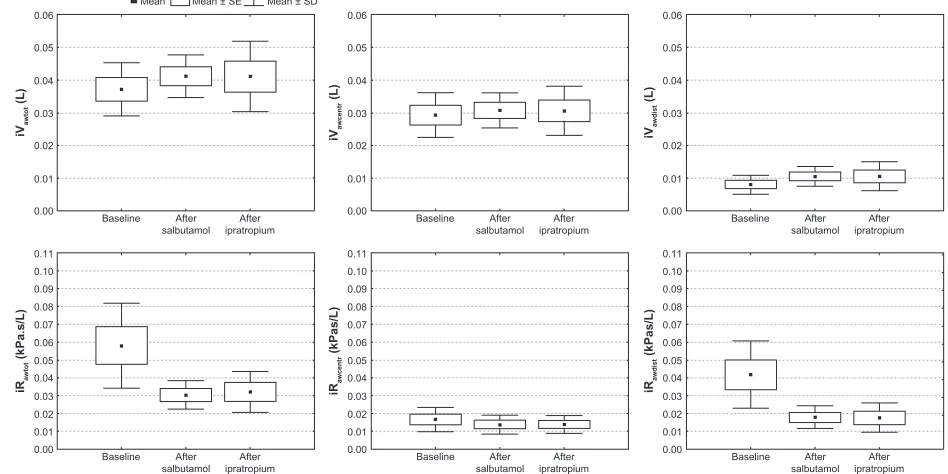
Mean Mean ± SE Mean ± SD
0.00 Baseline
iVawto
t
(L)
After
salbutamol ipratropiumAfter 0.01
0.02 0.03 0.04 0.05 0.06
0.00
Baseline Baseline Baseline
iRawto
t
(kPa.s/L)
After
salbutamol ipratropiumAfter 0.01
0.02 0.03 0.04 0.05 0.06 0.08 0.07 0.09 0.10 0.11
0.00
Baseline
iVawcent
r
(L)
After
salbutamol ipratropiumAfter 0.01
0.02 0.03 0.04 0.05 0.06
0.00
iRawcent
r
(kPas/L)
After
salbutamol ipratropiumAfter 0.01
0.02 0.03 0.04 0.05 0.06 0.08 0.07 0.09 0.10 0.11
0.00
Baseline
iVawdist
(L)
After
salbutamol ipratropiumAfter 0.01
0.02 0.03 0.04 0.05 0.06
0.00
iRawdist
(kPas/L)
After
salbutamol ipratropiumAfter 0.01
0.02 0.03 0.04 0.05 0.06 0.08 0.07 0.09 0.10 0.11
Figure 3 Changes after salbutamol and ipratropium bromide in total (iVtot), central (iVcentr) and distal airway volume (iVdist) based on images of segmented airways and
corresponding resistance (irawtot, irawcentr and irawdist) using computational fluid dynamics, in five COPD patients (GOLD ST III). All changes are significant (P, 0.05) except
for iVawcentr after salbutamol and irawcentr after both salbutamol and ipratropium bromide.
Abbreviations: sD,standard deviation; se, standard error.
Table 4 spearman rank comparison between functional imaging
resistance and pulmonary function test (PFT) resistance
Rtot Rawcentr Rawdist
r (PFT) 0.52 0.17 -0.21
P 0.02 0.5 0.4
rspec (PFT) 0.27 -0.38 0.37
P 0.3 0.09 0.1
Abbreviations: rtot, total airway resistance; rawcentr, airway resistance in the central
airways until third bifurcation; rawdist airway resistance of distal airways from third
to seventh bifurcation.
computational fluid dynamics was taken into consideration. The latter method seems to provide added, more pronounced, and more sensitive information in the calculation of airway dimensions. Also, discrepancies between FEV1 and forced vital capacity responses were observed, with more pro-nounced overall volume responses. Overall, the response to salbutamol was more pronounced than that to ipratropium bromide. However, ipratropium bromide was more active in one patient, especially when changes in airways caliber were taken into account.
Assessment of reversibility is recognized as an essential part of the management of airway obstruction.27 COPD
patients are considered to have airflow limitation that is not fully reversible. While some patients can still show high reversibility, most COPD patients have limited changes in FEV1 after bronchodilators.28 Some can show larger
changes in forced vital capacity and develop the so-called
International Journal of Chronic Obstructive Pulmonary Disease downloaded from https://www.dovepress.com/ by 118.70.13.36 on 22-Aug-2020
Dovepress De Backer et al
volume response29 which is seen more in severe patients
with end-expiratory flow limitation.4–30 We focused on the
more common, severe COPD patients with little reversibil-ity in FEV1 after bronchodilators. The functional imaging used in this study provided us with the opportunity to see whether changes in airway caliber and calculated airway resistance using computer methods were comparable with the limited changes seen in FEV1 in these patients. More-over, the imaging method used provided information on changes in both central (until the third bifurcation) and dis-tal (third to seventh bifurcation) airways. High-resolution CT has been used previously to determine bronchodilator responses either looking at changes in parenchymal den-sity31 or at bronchus–vessel caliber relationship.11 Both
methods are more indirect than the segmentation method used in this study complemented with computational fluid dynamics-based airway resistance measurements. We did not calculate emphysema scores for these patients, but we know from as yet unpublished data that functional imag-ing can be of value in doimag-ing this, because we can measure blood vessel density in every lobe and compare this with the percentage of airflow going to this lobe. This way, we have an idea about the ventilation/perfusion match. We certainly have to include this technique in a larger study in the future.
The variable response to different bronchodilators in COPD patients has been observed before, and previous attempts to identify the right patients for certain products were not satisfying. Oga et al20 found that the effects of
different bronchodilators on exercise capacity varied among individuals with stable COPD, while the degree of bronchodilation measured by FEV1 did not correlate with the increase in endurance time of the exercise test. This suggests that FEV1 is not an optimal descriptor of the bron-chodilator effect. We did not measure diffusing capacity of the lung for carbon monoxide or maximum inspiratory and expiratory pressure in this study, which could be interesting
to compare in larger studies in the future, as would be the BODE index (we did not measure the 6-minute walking distance), because it is a global measure of COPD severity, which takes into account some important health-related quality of life measures.
We found that the response to salbutamol was larger in four out of five of our patients compared with the response to ipratropium bromide. However, a hyporesponse to salbu-tamol was observed for one patient. Classical lung function testing was not able to make this distinction. FEV1 clearly underestimates the acute bronchodilator effects in COPD patients,32 probably because the main effect is situated in the
distal airways, as we see with imaging.
In this study, we used functional imaging as a method for evaluating bronchodilator treatment in COPD. Because COPD is such a heterogeneous disease, the same treat-ment does not have the same effect in different patients. This method helps us to understand why this is the case. It is the first method to evaluate regional resistances and volumes, and gives us new insights into the mechanism of bronchodilating treatment. It could help us to select the right treatment for the right patient, which should be the goal of every physician.
Suboptimal dosing may contribute to the wide varia-tion of responders with different degrees of reversibility, because dose-response relationships have been demonstrat-ed.33 Using higher doses, there is no substantial difference
between using a short-acting beta-agonist or a short-acting muscarinic agonist. It has also been demonstrated that there is an effective improvement in FEV1 on adding a high dose of salbutamol (600 µg) or a high dose of ipratropium bro-mide (120 µg) to regular tiotropium.34 A limitation of this
study is the fact that we only studied patients with more severe GOLD Stage III COPD who are known to have more volume response. Additional insight could be gained by performing the same tests on patients with GOLD Stage I, II, and IV COPD.
Different descriptors of the disease, like genetics and emphysema scores, might also be of help in predicting response. Some studies have shown that genotype may determine the bronchodilating response.35,36 A larger study
including all degrees of severity and performed over a lon-ger time period could also give important information on the relationship between clinical outcomes (quality of life, dyspnea scores) and imaging data. We can conclude that salbutamol and ipratropium bromide have a bronchodilat-ing effect in COPD patients, as indicated by a significant improvement in FEV1, vital capacity, Raw, and sRaw in
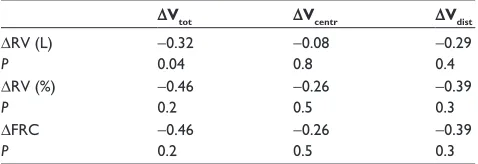
Table 5 spearman rank comparison between change in pulmonary
function test volumes and change in functional imaging volumes
ΔVtot ΔVcentr ΔVdist
∆rV (L) -0.32 -0.08 -0.29
P 0.04 0.8 0.4
∆rV (%) -0.46 -0.26 -0.39
P 0.2 0.5 0.3
∆FrC -0.46 -0.26 -0.39
P 0.2 0.5 0.3
Abbreviations: rV, residual volume; FrC, functional residual capacity; Vtot, total
volume of the segmented airways; Vcentr, volume of the central airways until the
third bifurcation.
International Journal of Chronic Obstructive Pulmonary Disease downloaded from https://www.dovepress.com/ by 118.70.13.36 on 22-Aug-2020
Dovepress Computerized functional imaging of airways in COPD
classical lung function testing. Using functional imaging, regional differences in airway volumes and resistances can be detected after bronchodilation. Distal bronchodilation is more pronounced than central bronchodilation. iRawtot decreases, with a redistribution of airway resistance from the distal to the central airways. From classical lung func-tion tests, there seems to be no difference in efficiency between salbutamol and ipratropium bromide. Neverthe-less, using functional imaging parameters, we can distin-guish two different types of responders, ie, the ones who respond more to salbutamol and a possible subgroup of hyporesponders to salbutamol. To confirm these findings, we need to study a larger group of patients, looking at different characteristics to predict and explain these dif-ferent responses.
Disclosure
The authors report no conflicts of interest in this work.
References
1. Bosken CH, Wiggs BR, Pare PD, Hogg JC. Small airway dimen-sions in smokers with obstruction to airflow. Am Rev Respir Dis. 1990;142(3):563–570.
2. Kuwano K, Bosken CH, Pare PD, Bai TR, Wiggs BR, Hogg JC. Small airways dimensions in asthma and in chronic obstructive pulmonary disease. Am Rev Respir Dis. 1993;148(5):1220–1225.
3. Pare PD, Brooks LA, Coppin CA, et al. Density-dependence of maximal expiratory flow and its correlation with small airway disease in smokers.
Am Rev Respir Dis. 1985;131(4):521–526.
4. Walker PP, Calverley PM. The volumetric response to broncho-dilators in stable chronic obstructive pulmonary disease. COPD. 2008;5(3):147–152.
5. Burns GP, Gibson GJ. A novel hypothesis to explain the bronch-constrictor effect of deep inspiration in asthma. Thorax. 2002;57(2): 116–119.
6. Newton MF, O’Donnell DE, Forkert L. Response of lung volumes to inhaled salbutamol in a large population of patients with severe hyperinflation. Chest. 2002;121(4):1042–1050.
7. Grenier PA, Beigelman-Aubry C, Fetita C, Preteux F, Brauner MW, Lenoir S. New frontiers in CT imaging of airway disease. Eur Radiol. 2002;12(5):1022–1044.
8. Gevenois PA, Yernault JC. Can computed tomography quantify pulmo-nary emphysema? Eur Respir J. 1995;8(5):843–848.
9. Achenbach T, Weinheimer O, Biedermann A, et al. MDCT assess-ment of airway wall thickness in COPD patients using a new method: Correlations with pulmonary function tests. Eur Radiol. 2008;18(12):2731–2738.
10. Brillet PY, Fetita CI, Saragaglia A, et al. Investigation of airways using MDCT for visual and quantitative assessment in COPD patients. Int J
Chron Obstruct Pulmon Dis. 2008;3(1):97–107.
11. De Luca N, Capuzi P, D’Angeli AL, et al. High resolution computed tomography (HRCT) assessment of beta 2-agonist induced bronchodila-tion in chronic obstructive pulmonary disease patients. Eur Rev Med
Pharmacol Sci. 1999;3(2):83–87.
12. Hasegawa M, Makita H, Nasuhara Y, et al. Relationship between improved airflow limitation and changes in airway calibre induced by inhaled anticholinergic agents in COPD. Thorax. 2009;64(4): 332–338.
13. Longest PW, Vinchurkar S. Effects of mesh style and grid convergence on particle deposition in bifurcating airway models with comparisons to experimental data. Med Eng Phys. 2007;29(3):350–366.
14. Yang XL, Liu Y, So RM, Yang JM. The effect of inlet velocity profile on the bifurcation COPD airway flow. Comput Biol Med. 2006;36(2):181–194.
15. Ma B, Lutchen KR. CFD simulation of aerosol deposition in an ana-tomically based human large-medium airway model. Ann Biomed Eng. 2009;37(2):271–285.
16. de Rochefort L, Vial L, Fodil R, et al. In vitro validation of compu-tational fluid dynamic simulation in human proximal airways with hyperpolarized 3He magnetic resonance phase-contrast velocimetry.
J Appl Physiol. 2007;102(5):2012–2023.
17. Lin CL, Tawhai M, McLennan G, Hoffman E. Computational fluid dynamics. IEEE Eng Med Biol Mag. 2009;28(3):25–33.
18. Gross NJ. Anticholinergic agents in asthma and COPD. Eur J
Pharma-col. 2006;533(1–3):36–39.
19. McCrory DC, Brown CD. Anti-cholinergic bronchodilators versus beta2-sympathomimetic agents for acute exacerbations of chronic obstructive pulmonary disease. Cochrane Database Syst Rev. 2002;4:CD003900.
20. Oga T, Nishimura K, Tsukino M, Sato S, Hajiro T, Mishima M. A com-parison of the effects of salbutamol and ipratropium bromide on exercise endurance in patients with COPD. Chest. 2003;123(6):1810–1816. 21. Brusasco V, Crapo R, Viegi G. Coming together: The ATS/ERS
consensus on clinical pulmonary function testing. Eur Respir J. 2005;26(1):1–2.
22. De Backer JW, Vos WG, Vinchurkar SC, et al. Validation of compu-tational fluid dynamics in CT-based airway models with SPECT/CT.
Radiology. 2010;257(3):854–862.
23. De Backer JW, Vos WG, Burnell P, et al. Study of the variability in upper and lower airway morphology in Sprague-Dawley rats using modern micro-CT scan-based segmentation techniques. Anat Rec
(Hoboken). 2009;292(5):720–727.
24. De Backer JW, Vos WG, Gorle CD, et al. Flow analyses in the lower airways: Patient-specific model and boundary conditions. Med Eng
Phys. 2008;30(7):872–879.
25. De Backer JW, Vos WG, Devolder A, et al. Computational fluid dynamics can detect changes in airway resistance in asth-matics after acute bronchodilation. J Biomech. 2008;41(1): 106–113.
26. Netter FH. Respiratory System. Summit, NJ: CIBA Collection; 1979. 27. Calverley PM, Burge PS, Spencer S, Anderson JA, Jones PW.
Broncho-dilator reversibility testing in chronic obstructive pulmonary disease.
Thorax. 2003;58(8):659–664.
28. Tashkin DP, Celli B, Decramer M, et al. Bronchodilator responsiveness in patients with COPD. Eur Respir J. 2008;31(4):742–750.
29. Ben SH, Prefaut C, Tabka Z, Zbidi A, Hayot M. The forgotten mes-sage from GOLD: FVC is a primary clinical outcome measure of bronchodilator reversibility in COPD. Pulm Pharmacol Ther. 2008;21(5):767–773.
30. Schermer T, Heijdra Y, Zadel S, et al. Flow and volume responses after routine salbutamol reversibility testing in mild to very severe COPD.
Respir Med. 2007;101(6):1355–1362.
31. Kurashima K, Takayanagi N, Sato N, et al. High resolution CT and bronchial reversibility test for diagnosing COPD. Respirology. 2005;10(3):316–322.
32. Borrill ZL, Houghton CM, Woodcock AA, Vestbo J, Singh D. Measur-ing bronchodilation in COPD clinical trials. Br J Clin Pharmacol. 2005;59(4):379–384.
33. Teale C, Morrison JF, Page RL, Pearson SB. Dose response to inhaled salbutamol in chronic obstructive airways disease. Postgrad Med J. 1991;67(790):754–756.
34. Cazzola M, Santus P, D’Adda A, Pizzolato S, DiMarco F, Centanni S. Acute effects of higher than standard doses of salbutamol and iprat-ropium on tiotiprat-ropium-induced bronchodilation in patients with stable COPD. Pulm Pharmacol Ther. 2009;22(3):177–182.
International Journal of Chronic Obstructive Pulmonary Disease downloaded from https://www.dovepress.com/ by 118.70.13.36 on 22-Aug-2020
International Journal of COPD
Publish your work in this journal
Submit your manuscript here: http://www.dovepress.com/international-journal-of-copd-journal The International Journal of COPD is an international, peer-reviewed journal of therapeutics and pharmacology focusing on concise rapid reporting of clinical studies and reviews in COPD. Special focus is given to the pathophysiological processes underlying the disease, intervention programs, patient focused education, and self management protocols.
This journal is indexed on PubMed Central, MedLine and CAS. The manuscript management system is completely online and includes a very quick and fair peer-review system, which is all easy to use. Visit http://www.dovepress.com/testimonials.php to read real quotes from published authors.
Dovepress
Dove
press
De Backer et al
35. Kim WJ, Hersh CP, DeMeo DL, Reilly JJ, Silverman EK. Genetic association analysis of COPD candidate genes with bronchodilator responsiveness. Respir Med. 2009;103(4):552–557.
36. Umeda N, Yoshikawa T, Kanazawa H, Hirata K, Fujimoto S. Associa-tion of beta2-adrenoreceptor genotypes with bronchodilatory effect of tiotropium in COPD. Respirology. 2008;13(3):346–352.
International Journal of Chronic Obstructive Pulmonary Disease downloaded from https://www.dovepress.com/ by 118.70.13.36 on 22-Aug-2020