Change Detection of AL-Hammar Marsh
Using Classification Method Based On
Gaussian Mixture Model
Dr. Ban Abed –AL-Rizak
1, Dr.Israa.J. Muhsin
2, Dr.Ebtesam Fadhel
3Assistant Professor, Department of Astronomy and Space College of Science, University of Baghdad, Iraq, Baghdad,
AL-Jaderiya1.
Assistant Professor, Department of Physics College of Science, University of Baghdad, Iraq, Baghdad, AL-Jaderiya2.
Assistant Professor, Department of Astronomy and Space College of Science, University of Baghdad, Iraq, Baghdad,
AL-Jaderiya3.
Abstract:- The object of the presented study was to monitor the changes that had happened in the main features (water, vegetation, and soil) of Al-Hammar Marsh region. To fulfill this goal, different satellite images had been used in different times, MSS 1973, TM 1990, ETM+ 2000 and MODIS 2010. A method of supervised classification was used in this study . Supervised classification relies on the prior knowledge of the location and identity of land cover types that are in the image. This can be achieved through field our work, a method of supervised classification and analysis. Which is, named supervised classifier, based on Gaussian mixture model which is often used in probability classification problems to model such distributions. The experiment demonstrate that the proposed method can get a better classification result and less affected by the noise.
KEYWORDS: Change Detection, Classification method, AL-Hammar marsh, Gaussian mixture model.
I.INTRODUCTION
Remote-sensing community research focusing on image classification has long attracted the attention of the remote-sensing because classification results are the basis for many environmental and socioeconomic applications. Scientists and practitioners have made great efforts in developing advanced classification approaches and techniques for improving classification accuracy. The well known and common classification methods that, usually, followed by remote sensing data users are those categorized as supervised and unsupervised methods [1] .
Remotely sensed imagery can be made use in a number of applications, encompassing reconnaissance, creation of mapping products for military and civil applications, evaluation of environmental damage, monitoring of land use, radiation monitoring, urban planning, growth regulation, soil assessment, and crop yield appraisal [2].
In the present work, remote sensing techniques have been applied for study the Change Detection of AL-Hammar Marsh regions using the proposed method is presented to classify The area of Al-AL-Hammar marsh regions which depended on Gaussian probability density functions are widely used to model the distribution of values within a dataset.
To fulfill this study, LANDSAT (MSS 1973, TM 1990, ETM+ 2000) and MODIS 2010, for Al-Hammar marsh are used.
II. STUDY AREA DESCRIPTION
extending to a total area of over (4,500)km² during periods of seasonal and temporary inundation. Al-Hammar lake, which dominates the marshes, is the largest water body in the lower Euphrates.
In 1973, it is approximately (120) km long and (25)km at its widest point. Slightly brackish due to its proximity to the Arabian Gulf, the lake is atrophic and shallow. Maximum depth at low water levels is (1.8)m and about three meters at high water mark. During the summer,large parts of the littoral zone dry out, and banks and islands emerge in many places. Fed primarily by the Euphrates River, which constitutes the northern limit of these marshes, these waters drain at Qarmat Ali into the Shatt al-Arab. A considerable amount of water from the Tigris River, overflowing from the central marshes, nourishes the Al-Hammar marshes [3]
The coordinates of Al-Hammar marshe are (30° 35′ to 31° 00′ N), (46° 25′ to 47° 45′ E), and its altitude mostly ranges between (4.5 and 9m.) above sea level.
Al Hammar marsh complex boasts one of the most important waterfowl areas in the Middle East, both in terms of bird numbers and species diversity. The vast and dense reed beds provide ideal habitat for breeding populations, while the ecotonal mudflats support shorebirds.
Globally significant concentrations of migratory waterfowl have been recorded during winter, and although not properly surveyed, the area is likely to host similarly high numbers during the spring and autumn seasons [4].
Figure (1): the Historic Extent of the Southern Marshlands [5].
III. PROPOSED CLASSIFICATION METHOD
In this section, the proposed method is presented. First, the general multi-dimensional Gaussian mixture model is described and solved by Expectation-Maximization (EM) algorithm. Then, the proposed neighborhood weighted method is described in detail. Based on this proposed model, the implemented algorithm is finally given [6].
(1)
where αk denotes the mixture coefficients. The parameter set of this distribution is
Θ = (α1,…,αK,Θ1, …,ΘK) with the constraint that .
Typically, pk (x|Θk) is modeled by a Gaussian distribution with mean μk and covariance matrix Σk. That is
(2)
Maximum likelihood (ML) estimation is a common used method to find the probability distribution parameters. The log-likelihood expression for this density from the data X is given by:
(3)
Finding the ML solution directly from Eq. (3) is difficult because it contains the log of the sum. The EM algorithm is a good way to solve this problem. The iterative solution for finding the parameters at the (t+1)th iteration step is as follows:
(4)
(6)
Taking the mixing parameters αk as prior probabilities, the probability of each class can be computed using Bayes’ rule:
(7)
IV. EXPERIMENTAL RESULT
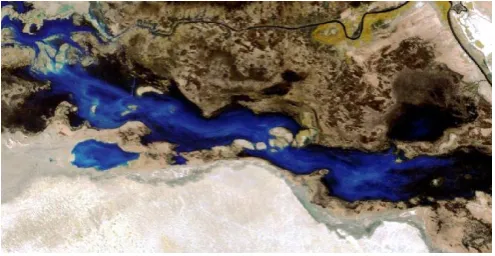
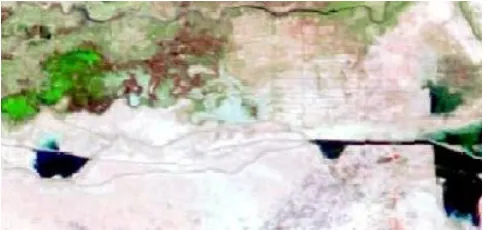
The proposed method of classified( the general multi-dimensional Gaussian mixture model is described and solved by Expectation-Maximization (EM)algorithm). is perform by visual basic. Frist input a vectorial volume X , the number of classes K. Second, Initialization of , . Any classification method could be used , we choose K-means. Third, calculate the prior probability by Eq.(7). Fourth, compute the new parameter data according to Eqs. (4), (5), and (6). Finaly, repeat steps Second- Fourth until reaching the end condition. we can notice that the final regions are not homogeneous as expected because of the noise, so this method relies on the histogram of image. The results show as following:- Figures (2,3,4,5) Represent the original image.
Figure (4) : Represents the The landsat image ETM+ for 2000 year .
Figure (5) : Represents the MODIS image for 2010 year .
Figures (6.7,8,9) Represent the classified image with the Gaussian mixture model with K=5,
Figure (6) : Represents the classified image for 1973.
Figure (8) : Represents theclassified image for 2000.
Figure (9) : Represents theclassified image for 2010.
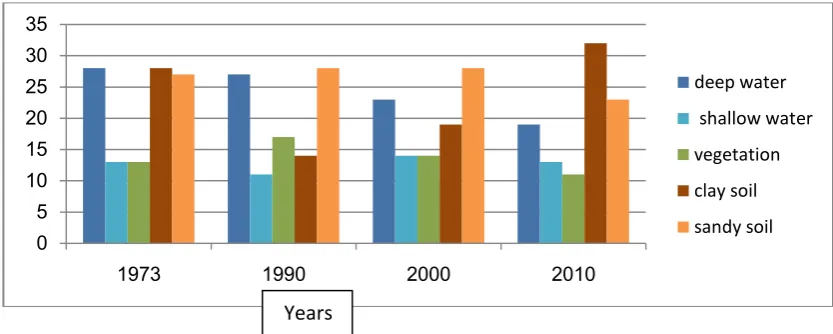
The area of Al-Hammar marsh objects (water, vegetation, and soil) for this method can be distributed statistically as shown in the figure (10) while the value of these areas can be noticed in the table (1).
Figure. (10): Represents Al-Hammar marsh objects (vegetation, water, and soil) distribution for the results of proposed classification method.
0 5 10 15 20 25 30 35
1973 1990 2000 2010
deep water
shallow water
vegetation
clay soil
sandy soil
Rate
o
f ar
ea
%
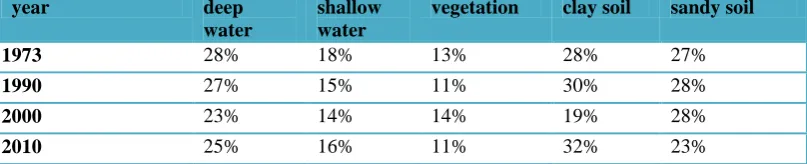
Table (1): Shows the area distribution of Al-Hammar marsh objects (vegetation, water, and soil) for the results of proposed classification method .
year deep
water
shallow water
vegetation clay soil sandy soil
1973 28% 18% 13% 28% 27%
1990 27% 15% 11% 30% 28%
2000 23% 14% 14% 19% 28%
2010 25% 16% 11% 32% 23%
VI.CONCLUSION
Protecting and monitoring of AL-Hammar marsh objects (vegetation, water, and soil) is major concerns for many local and state agencies. High-resolution satellite remote sensing is an important tool that can potentially be applied to gather information needed for water, vegetation and soil area assessments in the marshes. The assessment has been achieved using classification method which depended on Gaussian probability density functions The water and vegetation in the following 1973,1990 are decreases ,while the clay soil and sandy soil are increase .In the following 2000,2010 the water, some and how was increase.
REFRENCES
[1]. Tang H, Dillenseger J-L, Luo LM." Intra subject 3D/3D Kidney Registration using Local Mutual Information Maximization"; Proc of the 29th Conf IEEE-EMBS; Lyon, France pp. 6379–6382. 2007. . .
[2]. Lakare SA." Ray Based Exploration of Volumetric Data" [PhD]”. Stony Brook: State University of New Yorkpp. 91–106; 2004. .
[3]. James A. Shine and Daniel B. Carr, "A Comparison of Classification Methods for Large Imagery Data Sets", JSM Statistics in an ERA of Technological Change-Statistical computing section, New York City, pp.3205-3207.2002
[4]. M. Govender, K. Chetty, V. Naiken and H. Bulcock, "A comparison of satellite hyperspectral and multispectral remote sensing imagery for improved classification and mapping of vegetation", Water SA, Vol. 34, No. 2, April 2008.
[5]. Ehsani, A . H . and Quiel, F. Efficiency of Landsat ETM+ Thermal Band for Land Cover Classification of the Biosphere Reserve Eastern Carpathians (Central Europe) Using SMAP and ML Algorithms", , Int. J. Environ. Res., 4, 741-750, ISSN: 1735-6865. 2010
[6]. Xiangwei Liu “Several Different Remote Sensing Image Classification Technology Analysis”, Journal of Sustainable Development Vol. 4, No. 5, October, 2011
![Figure (1): the Historic Extent of the Southern Marshlands [5].](https://thumb-us.123doks.com/thumbv2/123dok_us/1662289.1208707/2.595.126.447.373.620/figure-historic-extent-southern-marshlands.webp)