Clustering Analysis of Simple K – Means
Algorithm for Various Data Sets in Function
Optimization Problem (Fop) of Evolutionary
Programming
R. Karthick
1, Dr. Malathi.A
2Research Scholar, Department of Computer Applications, Karpagam University, Coimbatore, Tamil Nadu, India1
Assistant Professor, PG and Research Department of Computer Science, Govt. Arts College, Coimbatore, Tamil Nadu, India2
ABSTRACT: Evolutionary Algorithms are based on some influential principles like Survival of the Fittest and with some natural phenomena in Genetic Inheritance. The key for searching the solution in improved function optimization problems are based only on Selection and Mutation operators. In this paper a Selection algorithm for data set is chosen so as to identify the survival of the fittest and also the simple K means clustering algorithm is analyzed on different data sets to check for the performance of the K – means on different data set which gives best accuracy to identify the best solution.
KEYWORDS: Evolutionary Programming, Function Optimization, Genetic Algorithm K-means clustering
I. INTRODUCTION
II. EVOLUTIONARY PROGRAMMING STRATEGIES
Evolutionary Strategies were developed as a method to solve parameter optimization problems [5]. To aspire the evolution of artificial intelligence, the evolutionary programming had developed for the ability to predict the changes in the environment. The individuals undergoes a Gaussian distribution method of addition zero mean Gaussian variable of standard deviation. The Survival of the fittest from the parent and the offspring becomes the parent of next generation [6]. The next generations are called as offspring. The procreation of a population in the general computer programs are based Evolutionary programming techniques. GP has been mainly intended for discovering computer programs able to solve particular classes of optimization problems [7]. The evolutionary search algorithm is applied iteratively to arrive at a near optimum solution. [8]. In the Genetic algorithm the set of data (represented in numbers) called as “Chromosomes” and the elements in the data are called as “genes” The survival of the Fittest is identified by calculating the function.
GENETIC ALGORITHM AND IT’S OPERATORS
The operation of GAs begins with a population of a random string representing design or decision variables. The population is then operated by three main operators; reproduction, crossover and mutation to create a new population of points [9]. To start with the function optimizations in the genetic algorithm we need to set the population in the encoded format and define it as members. Cross over and mutation, operators based on reproduction, are used to create the next generation.[10]For creating next generation, crossover plays a vital role here by combining the members in the current generated population. The mutation systematically changes elements of a solution from the current generation in order to create a member of the next generation [10]. To find the best solution or survival of the fittest, genetic algorithms uses the cross over and mutation and performs the operation. Genetic algorithms are well suited for searching complex, highly non-linear spaces because they avoid becoming trapped in a local minimum [11].
III. CLUSTERING
In this technique we split the data into various groups and it is termed as clusters. Each cluster contains the homogeneous data from other cluster‟s data [12]. Data Clustering refers to unsupervised learning technique, which offers refined and more abstract views to the inherent structure of a data set by partitioning it into a number of disjoint or overlapping groups [13].
K- MEANS CLUSTERING
K-Means is one of the simplest unsupervised learning algorithms to classify a given data set through a certain number of clusters fixed a priori [14]. The term “k-means” was first used by James MacQueen in 1967, though the idea goes back to 1957. The standard algorithm was first proposed byStuart Lloyd in 1957 as a technique of pulse-code modulation, though it wasn‟t published until 1982. K-means is a widely used partitional clustering method in the industries. the K-means algorithm is the most commonly used partitional clustering algorithm because it can be easily implemented as is the most efficient terms of the execution time [15].
IV. PROBLEM DESCRIPTION AND RELATED WORK
The problem is that identifying the survival of the fittest (Best solution), from the randomly generated populations and also the breast cancer and diabetics data set is chosen and simple K means clustering algorithm is applied over it. An Experimental analysis report is compared for the above mentioned dataset with the K-means algorithm. In EP after identifying the best solution the tournament selection is applied to the new generations (offsprings) and the survival of the fittest is identified. The minimum best population is identified grouped in an order and at one stage there will be no changes in the offspring which is generated after the tournament selection. Various rules have been described to identify the offspring for the next generation.
Rule 2: All the solutions are positioned at one location and one best solution is taken among them Rule 3: With a certain probability, collective solutions are taken for creating a subsequent selection.
Rule 4 : By applying simple K means clustering algorithm is applied for the data sets a result analysis is studied and the best data set is chosen
Rule 5: After choosing the data set which gives the best accuracy in K means again GA is applied.
V. PROCESS INVOLVED IN EP
S1. Generate two populations randomly between some ranges for example 1* (1, 10) and 2* (1, 10)
S2. From the population generation calculate the fitness function based on our formulae
S3. Sort the population in decreasing order based on the fitness.
S4. Perform the operation till all the elements get sorted.
S5. Perform a pair wise tournament between the fitness values and replace the new fitness value with the old fitness
values.
S6. Plot the graph based on the result which is generated.
ALGORITHM
//Input: A and B are generated randomly //Output: Best solution
Begin
A 1 *rand (1, 10); B 2* rand (1, 10);
For generating the solution for every element in the population For i=1:10
F=A+2*B End for
Return min (F) End
Genetic Algorithm Approach to FOP
Genetic Algorithm approach is engaged to optimally select the minimum best solution from the randomly generated population. To identify the global minimum search space the traditional genetic algorithms were used to explore the solutions. There are various ways in genetic algorithm to improve the performance of evolutionary programming. Here we follow Cross over and Mutation. The cross over encapsulates various elements in the current generation and creates an offspring (New Member). The mutation is nothing but sudden change in the element of the current population which is generated. Genetic algorithm are also well suited for searching complex, highly non-linear spaces because they avoid becoming trapped in a local minimum [11] In the evolutionary computation method, the fitness estimation is very much important, were the individual are considered as values and encodes only part of the solution. There are some basic outlines of genetic algorithm which are as follows
Initialize the population Evaluating the fitness Creating a new population Selection
Crossover Mutation
Placing the new offspring which is generated Replacement by selection operations
Testing
The GA‟s are known as Search algorithms, which are based on the phenomenon of natural selection and natural genetics. From our problem, a certain population is chosen (coding format) and the candidate for the solution to the optimization problem. The first form is nothing but we need to generate the population randomly. From the randomly generated populations we need to generate the offspring. The offspring inherits the characteristics of parents from which they have generated. After all the offspring‟s are generated a tournament operations is performed between them so that the low fitness is replaced by the best fitness.
Tournament Selection
The process involved in the tournament selection is as follows, 1. Two solutions are taken randomly from the available population. 2. Fitness is compared between the chosen populations
3. Best fitness replaces the least fitness
4. This determines the tournament selection selects the best individual in each tournament For example consider the below table1.
A B Fitness
2.3845 1.5461 5.4766
2.8075 1.047 4.9646
1.5678 4.5756 10.719
2.6404 1.7966 6.2335
0.5189 2.1949 4.9087
2.9392 3.6458 10.2308
0.8143 2.1376 5.0896
0.757 2.8769 6.5108
2.6272 1.2591 5.1455
2.2119 4.9533 12.1186
Table1: Population and fitness.
From the above population chose two solutions randomly e.g. 10.719 and 12.1186. Here the best solution is 12.1186 it replaces the 10.2308 like this the iteration happens for all the individuals and best solution is found. The below figure shows the fitness value which is raised on the final stage after the tournament selection operation is applied over it.
Crossover and Mutation
Here, we use 1 point crossover. The crossover is used to create a new offspring. From the two populations the two offspring is generated.
The below table depicts this,
Population1 11011 001110001 Population2 11011 110000011 Offspring1 11011 110001111 Offspring2 11011 000110011
Table2: Single point Crossover
After the operations which are performed in the crossover, the next step is we need to go for mutation. The mutation is nothing but sudden changes in the offspring. That is, in the binary encoding, the mutation occurs is the values of 0 changes to 1 and 1 changes to 0.
Original Offspring1 1100011001101 Original Offspring2 1101111001100 *Mutated Offspring1 1101111001101 Mutated Offspring2 1111011001100
Table3: Mutation.
The genetic algorithm cycle is depicted in the below figure.
Fig2: GA Cycle
VI. DATA SET
The data sets from UCI repository. Here WEKA 3.7 tool is used to perform the clustering analysis of K-means. Here the K-Means Clustering algorithm is compared with the dataset to find the performance of the IRIS-Fisher Dataset, Hospitality Data Set, Breast Cancer Dataset and Diabetics Data set.
Population
Parents
Offspring
Selection
VII. EXPRIEMENTAL PROCESS INVOLVED IN K-MEANS
Here various data sets which is specified above is taken and K-means clustering algorithm is applied over the data set to identify the Number of iterations and squared errors on each data set. The below table shows the number of attributes and instances of various data set which is chosen from UCI repository.
Data Set Attributes Instances
Breast Cancer 10 699
Diabetes 3 768
IRIS –Fisher 4 150
Hospitality 10 2728
Table 4: Details of Dataset
Experimental Results
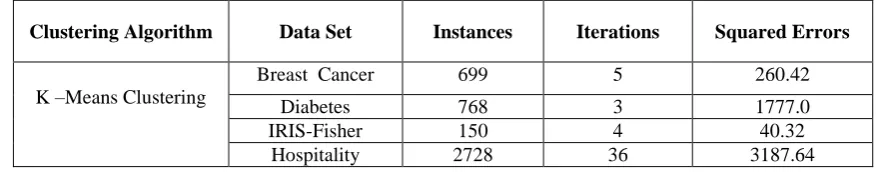
The below table 5 shows the experimental results of various data set after the K- means clustering algorithm is applied.
Clustering Algorithm Data Set Instances Iterations Squared Errors
K –Means Clustering
Breast Cancer 699 5 260.42
Diabetes 768 3 1777.0
IRIS-Fisher 150 4 40.32
Hospitality 2728 36 3187.64
Table 5: Comparison of K-means on data set for Iterations
The data sets are clustered into 0 and 1 instances based on the number of attributes of each data set. The below table 6 depicts the number of 0 and 1 instances with accuracy percentage level.
Clustering Algorithm Data Set Clustered Instances
0 1
K –Means Clustering
Breast Cancer 245 (35%) 454 (65%)
Diabetes 761 (99%) 7 (1%)
IRIS-Fisher 50 (33%) 100 (67%)
Hospitality 1439 (53%) 1289 (47%)
Table 6: K-means on Data set for Clustered Instances
Figure: Comparison of K-means with various data set
VIII. CONCLUSION AND FUTURE WORK
In this paper the K- Means clustering algorithm along with function optimization is analyzed for randomly generated population and various data sets. In the randomly generated population the fitness values is raised based on the selection operation. In the K- Means algorithm, various data set is given in which it provides high result over diabetes data set in which it provides minimum number of iterations and maximum accuracy of zero clustered instances with 99%. The algorithms which is presented in GA and steps involved in EP are very much help to solve the problem of function optimization. In future, the most convenient of this problem is we can extend the parameters which have been declared and the function can also be added with additional parameters. The same data set is chosen for comparison of various clustering algorithms. Finally we can conclude that, identifying the best solutions based on the survival of the fittest from various populations and K- Means clustering produces high results in diabetes data set over other data.
REFERENCES
[1] X.Yao and Y.Xu, “Recent Advances in Evolutionary Computations” Int. J. Compt. Sci and technology [2] Shane Legg, Marcus Hutter, Akshat Kumar, “ Tournament versus Fitness Uniform Selection” [3] Ajith Abraham, “Natural Computation for Business Intelligence from Web Usage Mining” [4] Halina Kwasnika , “K-Model An Evolutionary Algorithm with New Schema of Representation”. [5] Schwefel H.P “On the Evolution of Evolutionary Computation.”
[6] Marc Schoenauer and Zbigniew Michalewicz, “Evolutionary computation”. [7] Mihai Oltean, “Evolving Evolutionary Algorithms for function Optimization” [8] Evolutionary Algorithms for optimizing bridge deck rehabilitation
[9] Tom V.Mathew “Genetic Algorithm”.
[10] Sarah wazirud, David C. Brogan and Paul F. Reynolds Jr, “Coercion through optimization: A Classification of Optimization Techniques” [11] Y.Carson and A.Maria: “Simulation Optimization: Methods and Applications”, proceedings of the 19777 Winter Simulation Conference, 1977 [12] Suman and Mrs. Pooja Mittal “Comparison and Analysis of Various Clustering Methods in Data mining on Education data set using Weak
tool”. International Journal of Emerging science & Technology in Computer Science. Vo1. 3 Iss. 2 PP. 240 – 244
[13] Prakash Singh and Aarohi Surya, “Performance Analysis of Clustering Algorithms in Data Mining in Weka” Int. J. of Adv in Eng. and Tech. Vol.7 Iss 6 PP. 1866 – 1873
[14] S.C. Punitha, P.Ranjith Jeba Thangaiah and M. Punithavalli, “Performance Analysis of Clustering using Partitioning and Hierarchical Clustering Techniques”, Int. J. of Database Theory and Applications. Vol.7 No.6 PP. 233-240