Copyright1999 by the Genetics Society of America
Improving the Efficiency of Artificial Selection: More Selection Pressure
With Less Inbreeding
Leopoldo Sanchez,*
,1Miguel Angel Toro
†and Carlos Garcı´a*
*Departamento de Bioloxı´a Fundamental, Facultade de Bioloxı´a, Universidade de Santiago, 15706 Santiago de Compostela, Galicia, Spain
and†Instituto Nacional de Investigaciones Agrarias, 28040 Madrid, Spain Manuscript received July 11, 1998
Accepted for publication December 14, 1998
ABSTRACT
The use of population genetic variability in present-day selection schemes can be improved to reduce inbreeding rate and inbreeding depression without impairing genetic progress. We performed an experi-ment with Drosophila melanogaster to test mate selection, an optimizing method that uses linear programming to maximize the selection differential applied while at the same time respecting a restriction on the increase in inbreeding expected in the next generation. Previous studies about mate selection used computer simulation on simple additive genetic models, and no experiment with a real character in a real population had been carried out. After six selection generations, the optimized lines showed an increase in cumulated phenotypic selection differential of 10.76%, and at the same time, a reduction of 19.91 and 60.47% in inbreeding coefficient mean and variance, respectively. The increased selection pressure would bring greater selection response, and in fact, the observed change in the selected trait was on average 31.03% greater in the optimized lines. These improvements in the selection scheme were not made at the expense of the long-term expectations of genetic variability in the population, as these expectations were very similar for both mate selection and conventionally selected lines in our experiment.
A
RTIFICIAL selection brings genetic progress, but ancestor’s information in genetic evaluations to shorten the generation intervals (Nicholas andSmith 1983) also increases the rate of inbreeding (Lush1946;Robertson1961), which results in inbreeding depres- tend also to speed the loss of genetic variability in se-lected populations.
sion of the selected trait itself and fitness components
such as fecundity and viability (FalconerandMackay In recent years, a considerable amount of work has been done on the design of strategies to optimize the 1996). The problem has become more serious in
pres-ent-day animal and tree breeding, in which short-term use of genetic variability in artificial selection (reviewed inToroandPerez-Enciso1990). Most of these strate-selection responses are maximized by the use of the
animal model best linear unbiased predictor (BLUP) gies try to maximize the selection response while at the same time imposing some restriction on the resulting genetic evaluations. There is a consensus that BLUP is
the best available method for genetic evaluation, as it loss of genetic variability in the population. This loss can be measured not only by the inbreeding coefficient, increases the accuracy of selection by using all the
avail-but also by the average coancestry coefficient, the able information from relatives in the evaluation of the
founder equivalents, and the founder genome equiva-selection candidates. However, the naive use of BLUP
lents (see the review byBallouandLacy1995). These evaluation may also increase the inbreeding rate and
strategies can be classified into three groups: (1) those the loss of genetic variability, because related individuals
manipulating the number of selected individuals ( Vil-tend to be selected together, as they share most of their
lanuevaet al. 1996) or their contribution to the next familial information (Belonsky and Kennedy 1988;
generation (Toro andNieto 1984;Nietoet al. 1986;
Toroet al. 1988a). In fact, in small populations, the use
WrayandGoddard1994;Meuwissen1997); (2) those of less family information may provide more response in
using a suboptimal selection criterion, giving less weight the mid and longterm (Perez-EncisoandToro1992;
to family information (seeVillanuevaandWoolliams Grundyet al. 1994). Other recent developments, such
1997 for the latest developments of this idea); and (3) as the use of multiple ovulation and embryo transfer to
those using a nonrandom mating system, such as mini-increase female family size in cattle and the use of only
mum coancestry, factorial, or compensatory mating (see review by Caballeroet al. 1996).
The mate selection method proposed by Toro and
Corresponding author: Carlos Garcı´a, Area de Xene´tica,
Departa-mento de Bioloxı´a Fundamental, Facultade de Bioloxı´a, Universidade Perez-Enciso(1990) may include most of the desirable de Santiago, 15706 Santiago de Compostela, Galicia, Spain.
properties of the above methods. It consists of selecting,
E-mail: [email protected]
from the series of all possible mating sets between the
1Present address: Department of Forest Genetics and Plant Physiology,
Swedish Institute of Agricultural Science, SE-901 83 Umea˚, Sweden. selection candidates, that set maximizing the expected
similar numbers of eggs, and each one was introduced in a response in the next generation, under the restriction
different vial already containing 3 ml culture medium. Having that the resulting inbreeding does not exceed a chosen
two different vial effects for every female, we intended to limit. Two mating sets can be different because of the measure better the variation between vials. The selection pro-number of parents, the distribution of the contribution cedures used in each line were as follows:
REF selection line:The 256 (6434) male and 256 female in descendants of these parents, or the actual matings
pupae assigned to this line were measured, and the longest between them. By choosing an optimum mating set, the
8 males and 64 females were selected. Each selected male was method erases the distinction between selection and
mated to a random sample of 8 selected females. The mating mating, as both kinds of decisions are taken simultane- took place in two steps, each step comprising 4 adult females ously. The joint control of selection and mating could introduced into the male’s vial for 24 hr. They were kept identified by clipping different combinations of their two pos-enable a noticeable short-term optimization of artificial
terior scutellar bristles. We measured 4 males and 4 females selection schemes (ToroandPerez-Enciso1990;Toro
from every female’s progeny and used these measures, along
et al. 1991;Klieveet al. 1994;NomuraandYonezawa
with all their ancestors’ information, to obtain their BLUP 1994). genetic evaluations. Using this as a criterion, 8 males and 64 Mate selection and all the other optimization meth- females were selected and the next generation established. The same procedure was followed for the remaining selection ods described above, with the exception ofNietoet al.
generations. (1986), have been tested to date only in computer
simu-OPT selection line:In the same way as in the REF line, 4 lation studies that were based on very simple
infinitesi-males and 4 feinfinitesi-males from the progeny of 64 feinfinitesi-males were mal, additive genetic models, which do not take proper measured in every generation, but the selection procedure account of inbreeding depression (Quintonet al. 1992). was different. In this line, we searched for the set of matings between the selection candidates that maximized the expected As this inbreeding depression is a manifestation of
inter-selection response in the following generation, under a restric-actions such as dominance and epistasis, models that
tion on the inbreeding increase. The allocation of matings include only additive effects and covariates for
inbreed-can be treated as a linear programming problem (Jansenand ing are rough approximations (SmithandMaki-Ta¨n- Wilton1985;Kinghorn1987) by using an X matrix, where ila1990), and the computer simulation studies based xij {i5 1, 256, j5 1, 256} is a decision variable indicating whether male i and female j are (xij51) or are not (xij50)
on them cannot provide a final test of the performance
to be mated. Following the mate selection method, we tried of any new mating or selection scheme. An empirical
to find, among all possible X mating matrices, the maximizing assay with a real trait in a real population is needed to
objective function, prove its usefulness.
oo
xij(aˆi1aˆj)/2,In this work, we tested Toro and Perez-Enciso’s
(1990) mate selection method by applying it to a labora- that is, the expected genetic gain in the next generation, in which aˆiand aˆjare the BLUPs for the breeding values of male
tory population of Drosophila melanogaster, and by
mea-i and female j. In thmea-is expermea-iment, to save computatmea-ional suring the selection pressure, the inbreeding
depres-resources, we did not apply the method to the whole array of sion, and the changes in genetic variability obtained.
2563256 possible matings, but made a preselection of the 32 males and 64 females having the highest genetic evaluation and selected a set of matings between them. The objective MATERIALS AND METHODS
function was subjected to the following restrictions: Selection lines were developed from a D. melanogaster labora- 1. RRx
ij564
tory population taken from the wild in Santiago de Compost- 2. Rx
ij50 or 1 (for every j )
ela in 1992 and kept since then at 258in a culture medium 3. Rx
ij#12 (for every i)
made up of 250 g whole corn flour, 180 g live baker’s yeast, 4. RRx
ijfij/64,(F1 dF),
18 g agar, 3 g ClNa, 3 g Nipagin, 33.3 ml ethanol, and 9.4 ml
propionic acid in 2.2 liters water. The same conditions were where F and fijare the average population inbreeding in the
previous generation and the coancestry coefficient between used in this experiment. Every female in the selection lines
laid eggs in a 23.7-cm3plastic vial. the ith male and the jth female, and dF is the maximum
additive increase in inbreeding allowed per generation. We The experiment had three nonsimultaneous replicates.
Each one was started with 64 virgin pairs sampled from the used an additive increase in F as the restriction because we wanted a criterion that was simple and did not depend on base population. Two sets of four males and four females were
taken from the progeny of every pair, and each set was used the changes in inbreeding in the previous generations. Thus, mate selection maximized the expected response while re-to start one selection line. The mate selection method was
applied in one of them (OPT line), and a standard selection specting some reproductive restrictions (1 to 3) and a restric-tion (4) on the inbreeding increase, and did it by using non-plan was applied in the other (REF line). We made six
genera-tions of selection in each line. The selected trait was pupa random mating, a variable number of sires, and a variable mating ratio. In all replicates, the solution matrix X was ob-length, measured in arbitrary micrometer length units (mlu)
by means of a micrometer introduced in one of the oculars tained with linear programming computer programs that were written in the computer center of the Instituto Nacional de of a binocular microscope. The females’ fecundity was also
measured, as the number of eggs laid by every selected female Investigaciones Agrarias (Madrid) following the algorithms given byLandandPowell(1979).
in its culture vial after 24 hr in replicates 1 and 2. In replicate
3, every selected female laid eggs on a black plastic rectangle The magnitude of the restriction on the inbreeding increase was not constant throughout the experiment. In replicate 1 that was covered on one of its sides by a layer of medium and
introduced into the vial. After 48 hr, the eggs were counted and in generations 1–4 of replicate 2, the limit value fordF
the increase in F per generation that was predicted for the REF step of Markov chains, there is an autocorrelation between their successive elements, so that an original chain can be line by theRobertson(1961) effective population number
expression. This value of 0.03 is higher than those typically reduced to a shorter one having lower autocorrelation without loss of information. We saved a sample of the parameters of used in large populations of livestock, which arez0.01 (Wray
andGoddard1994), but was appropriate for a smaller and interest every 500 iterations, so that we had 1000 saved samples
per replicate. We obtained Gibbs samples for (co)variance intensively selected population as was used in this experiment.
From generation 5 of replicate 2, we changed our procedure components, breeding values, and inbreeding depression ef-fects for both characters, while samples for the slope of the to fix the maximum F increase allowed in the OPT line,
be-cause in that generation the observed F in the REF line was not regression of the mean EBV on generation number were ob-tained for pupa length only.
only less than the average value predicted with theRobertson
(1961) expression, but even less than that observed in the A summary of the computer programs and theoretical models used in the data analysis can be seen in Table 1. We used a OPT line, which was respecting the restriction fixed on its F
increase. This can happen in practice, as a particular popula- heritability of 0.3 for pupa length in the analyses made in replicate 1 with JAA. The programs DFREML and MTGSAM tion can be above or below its expected F value. To avoid this,
we first set up the random matings in the REF line, and use the actual data set to estimate the parameters required to obtain the genetic evaluations.
then calculated the expected F increase for these particular
matings. This value was used as a reference to fix the maximum The theoretical model used for the data analysis included the effect of generation and, as long as the data reflect the increase in F that was allowed in the OPT line in that
genera-tion. We kept using this new procedure in the rest of the true genetic situation, they allow us to separate realized genetic changes from environmental changes between generations experiment (i.e., in generations 5 and 6 of replicate 2 and in
all of replicate 3). Thus, we made sure from that moment within a selection line. In any case the aim of the experiment was to compare the OPT and REF selection lines; the genera-that the OPT line had lower inbreeding than its corresponding
REF line. tion environmental effects would not affect the comparison,
because the OPT and REF lines in the same replicate were Data analysis:We obtained two genetic evaluations for every
individual. The first, EBV1, was an animal-model BLUP based maintained simultaneously and therefore shared these effects. We measured the effect of mate selection on response as the on all the information available on every animal at the time
of making selection decisions, and included its phenotypic difference in phenotypic response between the OPT and REF lines. We used the expression given byAggreyet al. (1995) for
value and that of its sibs and ancestors. It was used as a selection
the expected variance of this difference between two selection criterion. The second, EBV2, was the BLUP evaluation used
lines, which takes into account both drift variance and mea-in the fmea-inal analysis of the results, and was obtamea-ined by usmea-ing
surement error, all the information available at the end of the experiment,
which included all the individual’s descendants in addition
to the information used for EBV1. The genetic evaluations s2 R5
2s2 A Ne
5
t1 4
(11 b)h2
3
c21 bpm 11 a(12c
22h2/2)
46
, for the OPT and REF lines in a given replicate of theexperi-ment were obtained with a single execution of the
correspond-wheres2
Ais the additive variance, Nethe effective population ing program as both lines descended from the same set of
size, which was calculated taking into account the different founders, and it was possible to include them in a single
numbers of male and female parents, t is the number of genealogical file.
generations, pm is the proportion of males selected, a the As the experiment advanced, we used more complete
theoreti-number of females scored for every male,b the number of cal models and more recent computer programs to obtain
females selected for every male, h2the trait’s heritability, and the EBV1s. In replicates 1 and 2 we used JAA, the univariate
c2the environmental correlation between full sibs. We used BLUP program byMisztalandGianola(1987), and in
repli-the estimated variance for environmental vial effects as repli-the cate 3 we obtained these EBV1s with DFREML(UNI), the
environmental covariance between full sibs. However, this ex-univariate version of the derivative-free program for BLUP
pression is but an approximation that does not take into ac-genetic evaluation and variance component estimation by
count all the effects of directional selection on genetic
vari-Meyer(1991, 1993). This was also used to obtain the EBV2s
ance (Aggreyet al. 1995). To complement this test and to
in all replicates.
obtain a more empirical value for the standard deviation of We obtained additional estimates for the EBV2 and variance
selection response, we also carried out 100 runs of a computer components using a Bayesian approach. There are multiple
simulation of selection lines with the features of the REF lines advantages to this approach: use of prior information (when
in our experiment. available), elimination of nuisance parameters, exact finite
We studied nonrandom mating in the selection lines by means sample analyisis and integrated estimation, prediction, and
of Wright’s F statistics (Wright1969), decision (Gianola et al. 1989). Markov chain Monte Carlo
methods such as Gibbs sampling allow us to draw Bayesian (12F
IT)5(12FST)(12FIS), inferences about genetic parameters and responses (Wang
et al. 1994). The MTGSAM set of programs byVan Tassell where FITis the average inbreeding of animals born in a given generation and was calculated with the genealogical
informa-andVan Vleck(1996) accomplished Gibbs sampling analysis
for multitrait models. In our case the model included pupa tion, FSTis the average coancestry coefficient between the sires and dams of all possible mates and provides a measure of the length and fecundity. We assumed flat prior distributions for
fixed effects and normal distributions for all random effects contribution of limited population size to inbreeding, and FIS measures that of nonrandom mating.
in the model, including residuals. For the genetic effects it is
additionally assumed that there is a known covariance struc- In addition to inbreeding coefficients, we used methods based on the genetic contributions from founders and probabilities ture corresponding to the numerator relationship matrix.
Fi-nally, we also assigned flat prior distributions for all (co)vari- of gene loss to study the maintenance of genetic variability in the experiment. First, we calculated the “number of founder ance components. The Gibbs sampler was run once for every
replicate in the experiment, with 500,000 iterations in each equivalents” (Lacy 1989), which is a measure of the bal-ancedness of the contributions from the different founders, run, the first 2000 iterations being discarded (“burn in”). As
fe51/
o
M1Fi51
c2
i,
where M and F are the numbers of male and female founders and ciis the total contribution of founder i to the gene pool
of the population or the probability that a gene randomly sampled in this population originates from founder i. It was calculated as
ci5
o
Nj51
(aij/N),
where a(i,j) is the additive relationship coefficient between the founder i and the current animal j and N the number of animals of the current population (Rci51). The sum of c2i
can be calculated in every generation, and after several genera-tions, the distribution of c stabilizes, and then the sum of c2
i
predicts the asymptotic rate of inbreeding asDF5(1⁄ 4)Rc2i
(Wray and Thompson 1990; Woolliams and Thompson
1994). We observed this stabilization at the end of our experi-ment, and used the sum of c2
iin the last generation to calculate
the asymptotic rate of inbreeding.
Figure1.—Phenotypic selection response and phenotypic
cumulated selection differentials for pupa length in mlu in
TA BL E 1 Statistical models and computer programs used in the data analysis Replicate 1 Replicate 2 Replicate 3 EBV1 model y 5 X1 b1 1 Z1 s 1 ey 5 X1 b1 1 X2 b2 1 Z1 s 1 ey 5 X1 b1 1 X2 b2 1 X3 b3 1 Z1 s 1 Z2 p 1 e CP JAA JAA DFREML(UNI) v2.1 EBV2 model y 5 X1 b1 1 X2 b2 1 X3 b3 1 Z1 s 1 Z2 p 1 ey 5 X1 b1 1 X2 b2 1 X3 b3 1 Z1 s 1 Z2 p 1 ey 5 X1 b1 1 X2 b2 1 X3 b3 1 Z1 s 1 Z2 p 1 e CP MTGSAM MTGSAM MTGSAM The matrix y contains the phenotypic measures, the X ’s are design matrices, the b ’s, vectors of fixed effects, with subindices 1 for the effect of sex (not considered for fecundity), 2 for the effects of the generation number, and 3 for the inbreeding depression covariable; s is the vector of breeding values, p is a vector of random environmental vial effects, Z1 and Z2 are their corresponding design matrices, and e is the error vector. See the text for information about the computer programs. CP, computer programs.
We calculated also a direct measure of the amount of genetic tailed test). This increase in selection pressure was ac-variability remaining in each line at the end of the experiment. companied by a relative reduction in inbreeding (Figure This was the “founder genome equivalent” (Lacy1989),
2). The restriction on average inbreeding coefficient resulted also in more homogeneous inbreeding coeffi-fg51/
o
M1F
i51
(c2
i/ri),
cients in the OPT line (Figure 2). Reducing the variance in F is very desirable in practice, because the number where riis the probability of a given gene from founder i to
be retained in the population of descendants. It was calculated of highly inbred individuals is also reduced.
with the gene drop computer simulation technique (Mac- A summary of the MTGSAM-estimated parameters
Clueret al. 1986), which simulates the transmission of a gene can be seen in Table 2. All the results obtained with
from every founder parent through the genealogy, assuming
the DFREML analysis were very similar to those found that the probability of a parent’s gene being transmitted to a
with MTGSAM, so that they are not shown. The herita-descendant is 50%. The value of riis taken as the proportion
of runs in which the gene is present in the descendants’ gener- bility estimates were in accordance with published values ation. The founder genome equivalent may be defined as the for fecundity (Rose and Charlesworth 1981) and number of equally contributing founders, with no random body size (CoyneandBeecham1989) in this species. loss of founder alleles in the offspring, that would be expected
The estimates for the genetic correlation between pupa to produce the same genetic diversity as in the population
length and female fecundity were negative, in contrast under study. In contrast with the founder equivalent, it takes
into account the effect of genetic drift and population bottle- with the positive values obtained in other experiments
necks on gene loss (Lacy1989). (Robertson1957;Mackay1985). It is expected,
how-ever, that estimates of fitness and its resolution into components depend heavily on the experimental condi-RESULTS
tions of measurement (Mackay1985).
The significantly increased selection differentials in
Selection pressure and inbreeding: The OPT lines
showed increases in phenotypic selection differential of the OPT lines would result in increased responses in pupa length, which had a medium to high heritability 7.9, 11.9, and 12.4% over the corresponding REF lines
in replicates 1, 2, and 3, respectively (Figure 1). The in our population, and in fact the average pupa size was greater in the three OPT lines at the end of the increases of EBV2 selection differential were 28.4, 31.0,
and 9.0% in the same replicates. A Wilcoxon signed rank experiment (Figure 1). But given the limited size of the experiment, it was difficult to detect as significant these test comparing the phenotypic selection differentials
applied in the OPT and REF lines in every replicate observed differences. We had, however, some evidence of greater selection response in the OPT lines. First, and generation found a significant advantage for the
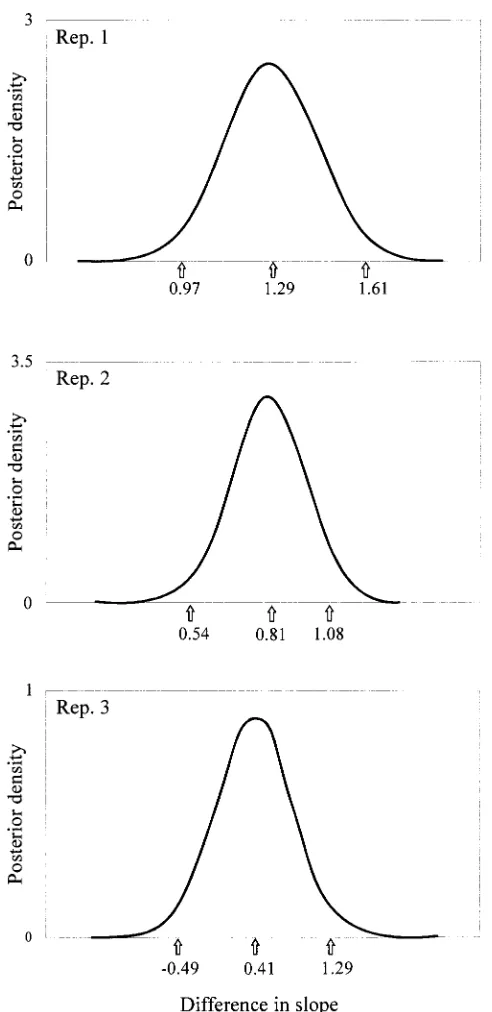
OPT lines (18 observations, S5 44.5, P,0.027, one- the Gibbs sampling analysis of selection response per
Figure2.—Inbreeding
TABLE 2
Gibbs sampling estimates (6standard error in the marginal posterior distribution)
Replicate 1 Replicate 2 Replicate 3
h2(1) 0.37860.067 0.30460.071 0.39960.051 rG 20.09160.199 20.31260.213 20.40360.199 h2(2) 0.26560.076 0.29160.090 0.20960.074 c2(1) 0.30160.027 0.28960.030 0.22960.019 c2(2) 0.00760.010 0.00760.008 0.02460.025
Estimates of heritabilities (h2) and of ratios: variance of vial effect/phenotypic variance (c2) for the characters’ pupa length in micrometer length units (1) and fecundity as num-ber of eggs laid (2), and genetic correlation (rG) between them.
generation found a significant advantage for the OPT lines in replicates 1 and 2 (Figure 3). Second, the across-replicates average difference in total phenotypic re-sponse between OPT and REF lines (Table 3) was found to be significant when compared with its expected stan-dard deviation, as calculated with the Aggrey et al. (1995) expression. This expected standard deviation was 2.14 mlu, so that the average difference of 5.48 mlu would be equal to 2.56 standard deviations, and therefore significantly greater than zero (P,0.01) in a one-sided test for a normal distribution. The standard deviation of total response obtained with 100 simula-tions resulted also in a significant difference between the OPT and REF lines. It was equal to 2.86 mlu, so that the expected standard deviation of the difference between two means of three lines each would be 2.863
√
2⁄35 2.34 mlu. This value was used to compare the observed average difference of 5.48 mlu with zero in a one-sided t -test (t995 2.35, P,0.025).
It is also possible to do a nonparametric test for the basic result in this experiment: the three OPT lines attained a higher average pupa length and a lower in-breeding coefficient than their corresponding REF lines. Under the null hypothesis of no effect of mate selection, the probability of an OPT line being above its corresponding REF line in pupa length would be
Figure3.—Gibbs sampling analysis of selection response.
0.5, and that of being below it in inbreeding would also
Represented are the Gibbs sampling marginal posterior distri-be 0.5. Assuming that the results for both variables are
butions of the difference between the slopes of the regression independent, the probability of obtaining such a result of pupa length average EBV2 in mlu on generation number at random would be (0.5)65 0.0156. In fact these two
in the OPT and REF lines. In the horizontal axis are the variables were not independent in our experiment, as distribution mean and the two values defining the 95% highest posterior density intervals. These values mark a 95% two-tailed there was a positive correlation between them. Within
confidence interval for the mean. treatments, the lines and generations with more
re-sponse tended to have more inbreeding, and therefore the described test would be conservative.
Mate selection effects on mating structure:The differ- given as an example. The differences were smaller in
TABLE 3
Cumulated selection response in mlu in generation 6
Replicate
Average
1 2 3 difference
Phenotypic response
OPT 20.26 26.07 33.36
5.48
REF 13.79 19.14 30.32
EBV2 response
OPT 29.25 20.99 29.49
5.11
REF 22.92 15.10 26.38
differences in the accuracy of BLUP genetic evaluations, and therefore in selection response. The Gibbs sam-pling produces a complete set of genetic evaluations for all the genealogies in every iteration, and thus we had a posterior distribution of estimated breeding values for every individual in the experiment. We used the within-individual variance in EBV1 as a measure of the preci-sion of its genetic evaluation. We compared the average of these variances between lines by generation with F-tests, but found no consistent advantages for any line. However, in the F-tests that were significant, the OPT lines had a disadvantage in precision more often than the reverse (not shown).
The analysis of nonrandom mating revealed that there was some avoidance of mating between relatives in the OPT lines, as the FIS were always negative in
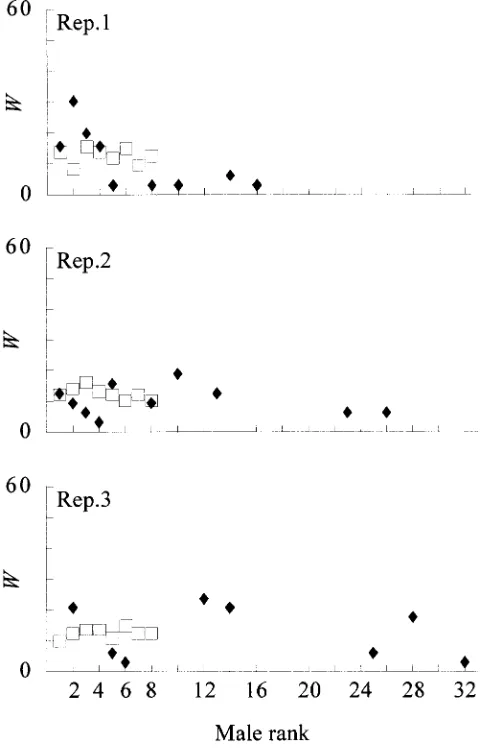
Figure4.—Male contributions in offspring in generation
them (Figure 5). The FSTfor these lines were higher in
6. The contribution by every selected male in the OPT (r) replicates 1 and 2, but this could be due to their smaller and REF (h) lines is expressed as a percentage W of the total average census number. On average along the experi- number of descendants. The males are ordered according to ment, the census numbers in the OPT lines were 85, their EBV1 ranking position, from the highest evaluation (1)
to the lowest (32). 96, and 97% of that in the REF lines in replicates 1, 2,
and 3. The relative reduction in census in replicate 1 was greater than the increase in FST (0.85 3 1.09 5
Inbreeding depression: The effect of inbreeding on
0.93), and the reverse happened in replicate 2 (0.963
fecundity was negative for the three replicates (Figure 1.0751.03).
6). There was an average reduction of 0.31 eggs laid The reduction in census number in the OPT lines
(0.96% of the mean) with every 1% increase in F, and could be related to a negative genetic correlation
be-this indicates that the OPT lines, which had less inbreed-tween pupa length and fecundity (Table 2) and also to
ing, also had less inbreeding depression. However, this the negative genetic correlation between body size and
reduction in inbreeding depression was not enough to larval viability found byPartridgeandFowler(1993)
compensate for the negative correlated responses in in this species. If the OPT lines had greater increases in
fecundity and viability to the selection applied on pupa pupa length, they would have suffered stronger negative
length, and as seen above, the census number in the correlated responses in fecundity and viability, thus
fail-OPT line was on average somewhat lower than in the ing more often to produce the required number of
REF line. adult descendants from the selected individuals.
The results for pupa length were more unexpected, The observed avoidance of mating between relatives
as the effect of the inbreeding coefficient on this trait did not clearly result in disassortative mating in the OPT
was negative and significant in replicate 3, but positive lines. We detected some significant mate correlations,
and nonsignificant in replicates 1 and 2 (Figure 5). On positive and negative, for the EBV2 in both OPT and
average we estimated a 0.01% increase in pupa length REF lines, but the between-line differences in
inbreed-Figure5.—Measures of the degree of nonrandom mating in OPT (continuous) and REF (discontinuous) selection lines. (A) Wright’s F-statistics. Repre-sented are FIS (boldface lines) and FST values. (B) Correla-tion in EBV2 between mating males and females. The aster-isks mark correlations signifi-cantly (P,0.05) different from zero in REF (bottom row of asterisks) and OPT lines (top row of asterisks).
ing on pupa size have also been found in Tribolium the selection plan (Verrieret al. 1994). In accordance with this, we found that the distribution of genetic con-(Groenet al. 1995a). We have no explanation for these
apparent differences between replicates. It is known tributions from founders, measured as the number of founder equivalents, stabilized in the last generations that the use of genealogical information does introduce
biases in the estimation of the inbreeding depression of the experiment (Table 4). As explained inmaterials and methods,this stabilization made it possible to use in characters under selection (Burrow 1993; Groen
et al. 1995b), so that our inbreeding depression mea- the genetic contributions from founders observed in
generation 6 to calculate the asymptotic rates of in-sures for pupa length are less reliable than those
ob-tained for fecundity. However, it is not obvious to us breeding. These were very similar for the OPT and REF lines, and there was even an overall advantage for the how different biases could have been introduced in
replicate 3 than in replicates 1 and 2. Perhaps the fact OPT lines (Table 5). In the case of the OPT lines, the asymptotic rates of inbreeding should be taken as that replicate 3 had a different treatment of egg laying
and a different theoretical model for its analysis, or that measures of the amount of genetic variability remaining at the end of the experiment, instead of true predictions it had a lower final inbreeding coefficient (Figure 2),
could be relevant for the introduction of some differen- of their long-term behavior, because the Wray and Thompson (1990) method to calculate them assumes tial bias between replicates. In any case, the OPT lines’
advantage in pupa length cannot be explained by a random mating, and of course, there was no random mating in the OPT lines.
lesser inbreeding depression caused by their lower
in-breeding coefficients, as the estimates of the effect of The advantage found for the OPT lines was reversed in the next measure of genetic variability, the founder inbreeding on the character were positive in replicates
1 and 2. genome equivalent (Table 5). This difference in results could be explained by the OPT lines’ average inferiority Pedigree analysis and long-term genetic variability
ex-pectations: Mate selection could be considered as a in census number, because, as seen inmaterials and
methods, the founder genome equivalent is sensitive method to optimize artificial selection in the short term,
as all the restrictions considered in it refer only to the to population bottlenecks. However, on average the founder genome equivalent of the OPT lines was less next generation (De BoerandVan Arendonk 1994).
However, it is known that often most gene losses in a reduced than their census number, and perhaps this could be taken as a sign of better management of genetic population occur in the first generations of selection,
so that the maintenance of genetic variability is not a variability in the OPT lines. Finally, the population aver-age coancestry at the end of the experiment was overall long-term issue only, and it makes sense to study the
Figure 6.—Inbreeding de-pressions. Represented are the Gibbs sampling marginal pos-terior distributions of the slopes of the regression of phe-notype for pupa length (in mlu) and fecundity (in num-ber of eggs laid per female) on inbreeding coefficient, mea-sured from zero to one. In the horizontal axis are the distribu-tion mean and the two values defining the 95% highest pos-terior density intervals. These values mark a 95% two-tailed confidence interval for the mean.
measurements together, there was no clear evidence of selected lines had at the same time an increased selec-a worse long-term mselec-anselec-agement of genetic vselec-ariselec-ability by tion differential and a reduced rate of inbreeding. The mate selection. advantages of reducing inbreeding refer not only to a better use of the genetic variability available in the base population and to a reduced inbreeding depression in DISCUSSION
the selected trait, but also to a reduced depression of fitness-related traits, which may be at present the most The experiment showed that it is possible to improve
do-TABLE 4
Number of founder equivalents by generation
Generation
Replicate Line 0 1 2 3 4 5 6
1 OPT 120 17.19 12.56 10.81 10.15 10.38 10.48
REF 120 11.83 10.74 10.65 10.63 10.78 10.85
2 OPT 106 16.35 10.53 9.87 10.39 10.62 10.71
REF 106 13.26 13.12 10.85 10.17 8.39 8.22
3 OPT 112 21.73 16.01 15.55 15.26 14.96 15.20
REF 112 19.15 16.04 13.21 14.43 14.61 14.31
mestic populations (MeuwissenandWoolliams1994; in later generations. For example, the OPT line had lost its initial advantage in inbreeding in generation 3 BrisbaneandGibson1995). These fitness-related traits
are not often subjected to direct selection due to their of replicate 2 and had a higher F than the REF line, for reasons explained above. In that situation, mate low heritability, but have nevertheless great economic
importance. selection made it possible to increase the emphasis put on inbreeding, and still obtain a higher cumulated selec-In our results, most of the OPT lines’ reduction in
inbreeding was obtained in the first generation of selec- tion differential and a lower F in the last generation of this replicate. Thus, mate selection could generate an tion by avoiding sib mating. In the remaining
genera-tions, mate selection maintained the inbreeding differ- advantage in selection and inbreeding in generations different from the initial one. This highlights the ability ence while increasing the selection differential in the
OPT lines. But this situation was a by-product of the of mate selection to trade to some extent selection dif-ferential for inbreeding coefficient, while producing a mate selection ability to obtain a considerable lag in
inbreeding coefficient at the start of the experiment, final result that is better in both respects than a conven-tional selection line. It is flexible also in applicability, rather than an intrinsic incapacity to control inbreeding
and depending on the restrictions involved, it could be used to optimize a selection scheme either hierarchical TABLE 5 or factorial, with a variable number of males, females, or offspring per mating, or with overlapping generations. Measures of the genetic variability remaining in
Furthermore, different restrictions can be used in differ-generation 6
ent generations or years (Toro et al. 1991).
Replicate The improved management of inbreeding depression
Average
provided by mate selection could permit reductions in
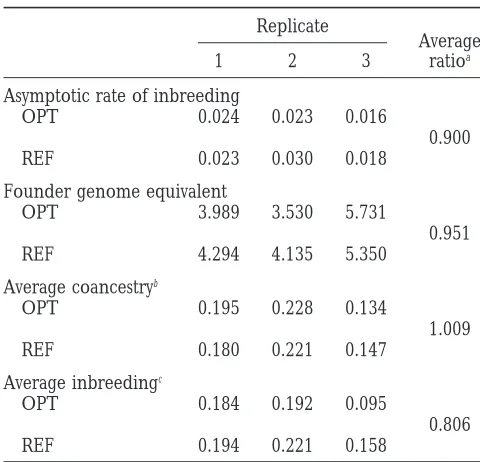
1 2 3 ratioa
census number in a selection nucleus in which very
Asymptotic rate of inbreeding complicated or expensive selection criteria are
mea-OPT 0.024 0.023 0.016 sured. It could also be useful for the genetic
conserva-0.900 tion of rare breeds or species. Templeton andRead
REF 0.023 0.030 0.018
(1984) proposed applying artificial selection on
fitness-Founder genome equivalent related traits in small populations, to eliminate
deleteri-OPT 3.989 3.530 5.731 ous recessive genes and thus reduce the inbreeding
0.951 depression. This selection should be accompanied by a
REF 4.294 4.135 5.350
restriction on the inbreeding rate, because too rapid Average coancestryb
increases in inbreeding could result in the loss of the
OPT 0.195 0.228 0.134 population. Mate selection would be a good method to
1.009
implement these conservation plans, as it enables
con-REF 0.180 0.221 0.147
trol of the relative weight given to selection and inbreed-Average inbreedingc
ing in every generation.
OPT 0.184 0.192 0.095 Among the optimizing methods of artificial selection
0.806
that have been proposed to date, mate selection is the
REF 0.194 0.221 0.158
most short-term one, because it is the only method
con-aThe across-generations average of ratios: OPT line values/
trolling simultaneously the selection and mating
pro-REF line values. cesses, and thus makes it possible to exert maximum
bThe population average coancestry between males and
fe-control on the next generation results. Mate selection males.
does not directly control the selection results beyond
cThe average inbreeding coefficient in each line in
populations, pp. 76–111 in Population Management for Survival and
maintenance of genetic variability is not clearly worse
Recovery, edited by J. D. Ballou, M. Gilpin andT. J. Foose.
than in a standard selection line, and concluded that Columbia University Press, New York.
Belonsky, G. M.,andB. W. Kennedy,1988 Selection on individual
it does not minimize the short-term inbreeding
depres-phenotype and best linear unbiased predictor of breeding value
sion at the expense of long-term genetic variability. This
in a closed swine herd. J. Anim. Sci. 66: 1124–1131.
result is consistent with that found byToroet al. (1988b) Brisbane, J. R.,andJ. P. Gibson,1995 Balancing selection response
and rate of inbreeding by including genetic relationships in
in a computer simulation study using phenotypic
selec-tion decisions. Theor. Appl. Genet. 91: 421–431.
tion, in which the mate selection lines had less
inbreed-Burrow, H. M.,1993 The effects of inbreeding in beef cattle. Anim.
ing than the standard, randomly mated selection lines Breed. Abstr. 61: 737–751.
Caballero, A., E. SantiagoandM. A. Toro,1996 Systems of
mat-after 30 generations.
ing to reduce inbreeding in selected populations. Anim. Sci. 62:
In any case, a general comparison of the different
431–442.
methods proposed to optimize the long-term results of Coyne, J. A.,andE. Beecham,1989 Heritability of two
morphologi-cal characters within and among natural populations of Drosophila
selection plans is still lacking, even under computer
melanogaster. Genetics 117: 727–737.
simulation. This comparison could be difficult to carry
De Boer, I. J. M.,andJ. A. M. Van Arendonk,1994 Additive
re-out, because its results could depend on the particular sponse to selection adjusted for effects of inbreeding in a closed
dairy cattle nucleus assuming a large number of gametes per
selection scheme, the genetic model and parameters
female. Anim. Prod. 58: 173–180.
assumed, the time horizon objective, and the possible
Falconer, D. S.,andT. F. C. Mackay,1996 Introduction to
Quantita-future use of the selected lines in crosses (Quinton tive Genetics, Ed. 4. Longman, London.
Gianola, D., S. ImandF. W. Macedo,1989 A framework for
predic-andSmith1995;Caballeroet al. 1996). In addition,
tion of breeding value, pp. 210–238 in Advances in Statistical
Meth-new methods might be developed in the future. For
ods for Genetic Improvement of Livestock, edited byD. Gianolaand
example, it would be possible to use simultaneously K. Hammond.Springer-Verlag, Berlin.
Groen, A. F., W. F. FikseandP. J. Berger,1995a Effects of data
restrictions on the inbreeding in the next generation
structure and selection on estimated inbreeding trend and
de-and on some prediction of the expected amount of
pression in experimental Tribolium castaneum lines. Paper
pre-genetic variability after t generations (as those described sented at the 46th Annual Meeting of the European Association
for Animal Production, Prague 1995.
inWoolliamsandThompson1994;Wrayet al. 1994;
Groen, A. F., B. W. KennedyandJ. J. Eissen,1995b Potential bias
SantiagoandCaballero1995). This would combine
in inbreeding depression estimates when using pedigree
relation-the short-term minimization of inbreeding depression ships to assess the degree of homozygosity for loci under selection.
Theor. Appl. Genet. 91: 665–671.
provided by mate selection with a more direct
long-Grundy, B., A. Caballero, E. SantiagoandW. G. Hill,1994 A
term control of genetic variability (WrayandGoddard
note on using biased parameter values and non-random mating
1994). These two kinds of restrictions are not intrinsi- to reduce rates of inbreeding in selection programmes. Anim.
Prod. 59: 465–468.
cally antagonistic, and depending on the relative weight
Jansen, G. B.,andJ. W. Wilton,1985 Selecting mating pairs with
given to each, the emphasis on short- or long-term
re-linear programming techniques. J. Dairy Sci. 62: 1302–1306.
sults could be varied. Perhaps the main difficulty in Kinghorn, B.,1987 On comparing strategies for mate allocation.
J. Anim. Breed. Genet. 104: 12–22.
developing such a method lies in the combination of
Klieve, H. M., B. KinghornandS.A. Barwick,1994 The joint
the nonrandom mating that is used in mate selection
regulation of genetic gain and inbreeding under mate selection.
and the prediction of the properties of the population J. Anim. Breed. Genet. 111: 81–88.
in future generations, because, as explained above, the Lacy, R. C.,1989 Analysis of founder representation in pedigrees: founder equivalents and founder genome equivalents. Zoo Biol.
present-day methods used to make these predictions
8:111–123.
assume random mating or some rather restricted cir- Land, A.,andS. Powell,1979 Computer codes for problems of cumstances. integer programming. Ann. Discr. Math. 5: 221–269.
Lush, J. L.,1946 Chance as a cause of gene frequency change within
We conclude that the efficiency of artificial selection
pure lines of livestock. Am. Nat. 80: 318–342.
plans can be improved, and that the advantages ob- MacCluer, J. W., J. L. VandeBerg, B. ReadandO. A. Ryder,1986 tained by doing so may be big enough to be detected Pedigree analysis by computer simulation. Zoo Biol. 5: 147–160. Mackay, T. F. C.,1985 A quantitative genetic analysis of fitness and
in rather small selected populations. However, no
de-its components in Drosophila melanogaster. Genet. Res. 47: 59–70.
finitive general method seems to have been proposed Meuwissen, T. H. E.,1997 Maximizing the response of selection up to date, and this remains a promising area of research with a predefined rate of inbreeding. J. Anim. Sci. 75: 934–940. Meuwissen, T. H. E.,andJ. A. Woolliams,1994 Required effective
that might provide many tangible benefits in animal
sizes of livestock populations. Theor. Appl. Genet. 89: 1019–1026.
and plant breeding. Meyer, K.,1991 Estimating variances and covariances for
multivari-ate animal models by restricted maximum likelihood. Genet. Sel. We thank R. Rekaya for his help with data analysis. This work was
Evol. 23: 317–340. funded by the Comisio´n Interministerial de Ciencia y Tecnologı´a,
Meyer, K.,1993 DFREML user notes, v2.1. In ftp site: metz.enu. Spain, with grant AGF92-1017-C03-02. Leopoldo Sa´nchez was
sup-edu.au/pub/agbu/DFREML. ported by a predoctoral fellowship from the Xunta de Galicia.
Misztal, I.,and D. Gianola, 1987 Indirect solutions of mixed model equations. J. Dairy Sci. 70: 1113–1121.
Nicholas, F. W.,andC. Smith,1983 Increased rates of genetic change in dairy cattle by embryo transfer and splitting. Anim. LITERATURE CITED
Prod. 36: 341–353.
Nieto, B., C. SalgadoandM. A. Toro,1986 Optimization of artifi-Aggrey, S. E., C. Y. LinandK. M. Cheng,1995 Size of breeding
cial selection response. J. Anim. Breed. Genet. 103: 199–204. populations required for selection programs. Theor. Appl. Genet.
Nomura, T.,andK. Yonezawa,1994 The merits of mate selection
91:553–556.
with a limited maximum inbreeding coefficient for progeny ani-Ballou, J. D.,andR. C. Lacy,1995 Identifying genetically important
Partridge, L.,andK. Fowler,1993 Responses and correlated re- Toro, M. A., L. SilioandM. Perez-Enciso,1991 A note on the sponses to artificial selection on torax length in Drosophila melano- use of mate selection in closed MOET breeding schemes. Anim.
gaster. Evolution 47: 213–226. Prod. 53: 403–406.
Perez-Enciso, M.,andM. A. Toro,1992 Classical and mixed-model Van Tassell, C. P.,andL. D. Van Vleck,1996 Multiple-trait Gibbs analysis of an index selection experiment for fecundity in Drosoph- sampler for animal models: flexible programs for Bayesian and
ila melanogaster. J. Anim. Sci. 70: 1060–1067. likelihood-based (co)variance component inference. J. Anim. Sci. Quinton, M.,andC. Smith,1995 Comparison of evaluation-selec- 74:2586-2597.
tion systems for maximizing selection response at the same level Verrier, E., J. J. ColleauandJ. L. Foulley,1994 Genetic variability of inbreeding. J. Anim. Sci. 73: 2208–2212. when selecting on the animal model BLUP. Proceedings of the Quinton, M., C. SmithandM. E. Goddard,1992 Comparison of 5th World Congress on Genetics Applied to Livestock Production
selection methods at the same level of inbreeding. J. Anim. Sci. IXX, Guelph, Canada, pp. 139–142.
70:1060–1067. Villanueva, B.,andJ. A. Woolliams,1997 Optimization of
breed-Robertson, A.,1961 Inbreeding in artificial selection programmes. ing programmes under index selection and constrained
inbreed-Genet. Res. 2: 189–194. ing. Genet. Res. 69: 145–158.
Robertson, F. W.,1957 Studies in quantitative inheritance. XI.
Ge-Villanueva, B., J. A. WoolliamsandB. Gjerde,1996 Optimum netic and environmental correlation between body size and egg designs for breeding programmes under mass selection with an production in Drosophila melanogaster. J. Genet. 55: 428–443.
application in fish breeding. Anim. Sci. 63: 563–576. Rose, M. R.,andB. Charlesworth,1981 Genetics of life history
Wang, C. S., D. Gianola, D. A. Sorensen, J. Jensen, A. Christensenet
in Drosophila melanogaster. Genetics 97: 173–186.
al., 1994 Response to selection for litter size in Danish Landrace Santiago, E.,andA. Caballero,1995 Effective size of populations
pigs: a Bayesian analysis. Theor. Appl. Genet. 88: 220–230. under selection. Genetics 139: 1013–1030.
Woolliams, J. A.,andR. Thompson,1994 A theory of genetic contri-Smith, S. P.,andA. Ma¨ki-Tanila,1990 Genotypic covariance
matri-butions. Proceedings of the 5th World Congress on Genetics ces and their inverses for models allowing dominance and
in-Applied to Livestock Production IX, Guelph, Canada, pp. 127– breeding. Genet. Sel. Evol. 22: 65–91.
134. Templeton, A. R.,andB. Read,1984 Factors eliminating inbreeding
Wray, N. R.,andM. E. Goddard, 1994 Increasing long-term re-depression in a captive herd of Speke’s gazelle. Zoo Biol. 3:
sponse to selection. Genet. Sel. Evol. 26: 431–451. 177–199.
Wray, N. R.,andR. Thompson,1990 Prediction of rates of inbreed-Toro, M. A.,andB. Nieto,1984 A simple method for increasing the
ing in selected populations. Genet. Res. 55: 41–54. selection response to artificial selection. Genet. Res. 44: 347–349.
Wray, N. R., J. A. WoolliamsandR. Thompson,1994 Prediction Toro, M. A.,andM. Perez-Enciso,1990 Optimization of selection
of rates of inbreeding in populations undergoing index selection. response under restricted inbreeding. Genet. Sel. Evol. 22: 93–
107. Theor. Appl. Genet. 87: 878–892.
Toro, M. A., L. Silio, J. Rodrigan˜ ez and M. T. Dobao, 1988a Wright, S.,1969 Evolution and the Genetics of Populations. Vol. 2.
Inbreeding and family index selection for prolificacy in pigs. The Theory of Gene Frequencies. The University of Chicago Press,
Anim. Prod. 46: 79–85. Chicago.
Toro, M. A., B. NietoandC. Salgado,1988b A note on
minimiza-Communicating editor:R. G. Shaw tion of inbreeding in small-scale selection programmes. Livest.