Digit-Type Mechanisms in Cell Differentiation Process: a Theoretical Study Strokovskyy Yaroslav
R&D Department, Haga Electronics Co, Seoul, South Korea
.
Abstract
According to inductive conception, the interference of neighboring cells causes a production of broken spatial symmetry in an initially homogenous system (cell differentiation process) during embryo development. A concentration gradient of a specific substance (morphogen), which serves as an analog-type control signal, is proposed as an agent to provide this process. It is known fact, that genes’ activity are of a discreet-type (digit) and, therefore, cell differentiation mechanism based on the control digit-type signals in comparison with the analog-type signals is more or less probable.
A model presented here simulates the cell differentiation process. The model is based on the assumption that only the digit-type interactions take place between adjacent cells (not analog-type interactions that are typical for the concentration gradient field). Within model assumptions, the genes’ interaction algorithms and boundary condition are postulated.
Under the model assumptions, the cell differentiation process starts with the homogeneous blastula formation and comprises three consecutive stages. 1) The loop-like inhomogeneous cell formation development and corresponding set of the self-blocking genes activation - the set of the asymmetric pattern genes governs the process. 2) The line-type inhomogeneous cell formations, with their origins at different cells of the loop-type formation, development and corresponding self-blocking genes activation - the sets of the symmetric pattern genes govern the process. 3) The variety of the function genes activation in the complex inhomogeneous cell formation - the sets of the self-blocking genes govern the process. Under model assumptions the multi level tree-type inhomogeneous cell structures creation is possible. The number of the pattern genes limits the complexity of the inhomogeneous structure. According to the model, in order to provide the further blastula development process, the concentration gradient fields may appear after the initial stages of the cell differentiation process. As simulated by the model, results qualitatively coincide with some of the experimental facts.
Introduction.
According to inductive conception, an interference of neighboring cells causes a production of broken spatial symmetry in an initially homogenous system (cell differentiation process) during embryo development. A concentration gradient of a specific substance (morphogen) is proposed as an agent to provide the process.
Correspondence [email protected]
In the concentration gradient models, the cells have to respond differently to various concentrations of the morphogen. Thus, during the cells’ interference processes, the morphogen serves as an analog-type control signal.
It is known fact, that genes’ activity are of the discreet-type (digit) – the genes’ state can be either ON or OFF and a gene’s expression has quantum character – a complicated, yet single molecule of a substance at a time. Such being the case, a cell differentiation mechanism based on the control digit-type signal in comparison with the analog-type signal is more or less probable. The point is that, in general, digit-type mechanisms are more accurate (less copying errors if to compare with analog-type mechanisms) and, in the case in question, have to be simpler – a digit-to analog signal conversion and vice-versa phases are absent.
Therefore, it may be of interest to develop a model of spatial homogeneous-to-broken spatial cell distribution transformation (cell differentiation) process referring to digit-type interactions only, to analyze as simulated by the model, a cells transformation process, to compare results with well-known experimental facts and so to evaluate plausibility and a potency of the model. The solutions of the tasks above are presented in the paper.
The model assumes that all information on cell differentiation process is enciphered in some chain-type relationships between the enhancer state and the silencer state on the one hand, and the genes’ expressed substance on the other hand. The latter, in one’s turn, becomes an activator (or prohibition) substance of either another gene or the same gene. Therefore, it has to be specified in the model how, in this case, the information is stored, the necessary boundary conditions and a way the information is deciphered during the cell differentiation process. A specification on the model components, the boundary conditions and the cells’ interaction rules are given.
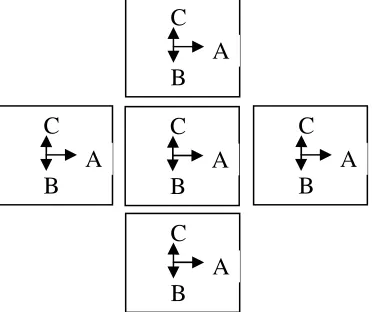
interaction process between adjacent cells, 1) the control substance lifetime is assumed to be about its travel time between cells and 2) the control substance is assumed to disintegrate shortly after corresponding enhancer (silencer) activation. To ensure boundary conditions at the starting time each cell must meet four postulated conditions. 1) Expressed by the asymmetric pattern genes, the signal substance should move to an adjacent cell in one authorized direction (an asymmetric movement, vector A in Figure 1). 2) Expressed by the symmetric pattern genes, the signal substance should move to adjacent cells in directions, which are perpendicular to the vector A (vectors B and C in Figure 1). 3) To stick to adjacent cells in such a manner that their authorized vectors A have to be parallel (Figure 1). 4) A set of initially identical M cells must create a spheroid that is enclosed into a tight non-stretchable spheroidal shield. Such a structure hereinafter is called a blastula (Figure 2, to simplify the drawing some of cells are shown). For identification purposes, a unique number is assign to each cell.
Rules of Genes’ Activity, the Asymmetric Pattern Genes.
The set of N asymmetric pattern genes are renumbered G0 through GN-1. Each asymmetric pattern
gene Gi+1 includes two input areas that hereinafter are
called enhancer (Ai+1,i) and silencer (Ii+1,i-1). The first
index (i+1) corresponds to the asymmetric pattern gene number Gi+1, the second index points to the substance Si
(Si-1) which activate the asymmetric pattern gene’s
enhancer (silencer). Table 1 represents the relationships between index of the enhancer activator substance, index of the silencer activator substance and index of the substance expressed by the asymmetric pattern gene. The asymmetric pattern gene Gi+1 expresses the
substance Si+1 under two conditions only: on presence
of the substance Si and on absence of the substance Si-1
In Table 1 the index variation i=0 through N-1 determines the property of genes’ activity. Note the special cases for i=0 and i=N-1. The asymmetric pattern gene G0 (i=N-1 in Table 1) expresses the
substance S0 on presence of the substance SN-1 at its
enhancer A0,N-1 and on absence of the substance SN−2 at
its silencer I0,N-2. The asymmetric pattern gene G1 (i=0
in Table 1) expresses the substance S1 on presence of
the substance S0 at its enhancer A1,0 and on absence of
the substance SN-1 at its silencer I1,N-1. In other words,
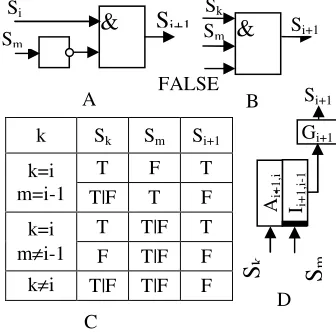
the control substances of the given set of the asymmetric pattern genes comprise the substances expressed only by the same set of the asymmetric pattern genes. A block diagram of asymmetric pattern gene (D), its logic circuit representation (A and B) and the truth table (C) are shown in the Figure 3. A graphical representation of the rules above for a special, simplified, case concerning 4 cells and 4 genes is given in the Figure 5.
i Enhancer Silencer Exp.
0 A1,0 I1,N-1 S1
1 A2,1 I2,0 S2
2 A3,1 I3,1 S3
: ⋅⋅⋅⋅⋅⋅⋅⋅⋅⋅⋅⋅ ⋅⋅⋅⋅⋅⋅⋅⋅⋅⋅⋅⋅ ⋅⋅⋅⋅⋅⋅⋅⋅⋅⋅⋅⋅
N-2 AN-1,N-2 IN_G,N-3 SN-1
N-1 A0,N-1 I0,N-2 S0
Table 1. Asymmetrical pattern genes properties. Si i– index of substance expressed by gene Gi;
Ai,k enhancer of gene Gi, k – index of substance
which activate gene Gi;
Ii,j silencer of gene Gi, j – index of substance which
prohibit activation of gene Gi. 1rd
2ru
9
11
7
6
1
17
1lu
0ld 0ru
1ru
3ru
0rd
12
13
14
16
19
0
2rd
3rd 1ld
2ld 3ld
x
z
y
Figure 2. An initial positional
C
A
B
C
A
B
C
A
B
C
A
B
C
A
B
Rules of Genes’ Activity, the Symmetric Pattern Genes.
In each set the symmetric pattern genes Gsji
have the same properties as the asymmetric ones but 1) their expressed substances movement vectors B and C are perpendicular to the vector A (Figure 1); and 2) each set may be activated by corresponding external substance only. 3) Expressions of different self-blocking genes, in their own turn activated by different asymmetric genes (see rules on self-blocking genes’ activity below), serve as the external substances for different sets of the symmetric pattern genes. I.e. the symmetric pattern gene Gsj0 expresses the substance
Ssj0 on presence of an external substance Sext≠Ssji at its
enhancer Asj0,ext and on absence of the substance
SsjNsj−2 at its silencer Isj0,Nsj-2. Ssji – substances
expressed by a set of the symmetric pattern genes within set #j, Nsj – the number of the symmetric gene in the set #j
Rules of Genes’ Activity, the Self-Blocking Genes.
The self-blocking gene Gbi has two enhancers
Abi and Abei . Each enhancer can activate the gene’s
expression regardless of the another enhancer state (logical OR). The gene’s expressed substance Sbi can
activate one of its own enhancers Abi. To prevent
self-blocking gene Gbi activation by spontaneous signals,
Abei enhancer should react to the series of the input
signals only (self-blocking gene does not react to irregular activation signals). Therefore, 1) the inactive self-blocking gene switches to its active state after being affected by a series of external signals at enhancer Abei and 2) the active self-blocking gene
remains active after the external signal loss. A block diagram of the self-blocking gene is shown in Figure 4A. Each asymmetric pattern gene and еру symmetric one have their corresponding self-blocking genes. The pattern genes’ expressions activate the corresponding self-blocking genes.
Rules of Genes’ Activity, the Function Genes. The function gene has one, two or more enhancers Afi and the appropriate substances of Sbk
(expressed by the corresponding self-blocking genes) may activate them. A block diagram of the function genes are shown in Figure 4B (with two enhancers) and in Figure 4С (with one enhancer). Function genes Gfi
are intended to provide a cell the specified physical properties (say, to increase a cell’s dimensions or other property, which are defined properly in the below example).
Discussion on the Assumptions.
The authorized direction postulate bases on an experiment of asymmetry movement of protein in the Epidermis of Drosophila (van den Heuvel et al., 1989; Gonzales et al., 1991). Several hypotheses have been put forth to explain this (Kerszberg and Wolpert, 1998; Gonzales et al, 1991; Pfeiffer et al, 2000). The gene’s activity representation as Boolean logic unit is widely used in various models. Blastula representation as a set of initially uniform cells of the one type does not limit the model possibilities. In case of more than one set of initially uniform cells, the model capabilities have to expand. The algorithm of the pattern genes’ interactions is postulated.
Sm
Sk
FALSE
S
i+1Si
&
Sm
Si+1
Ii+1
,i
-1
Ai+
1
,i
Gi+1
S
kS
mFigure 3. The block diagram of the pattern genes, that provide the cell differentiation process (D), their logical schematic for the case k=i (A), for the case k≠i (b); and the truth table (C).
k Sk Sm Si+1
T F T k=i
m=i-1 T|F T F T T|F T k=i
m≠i-1 F T|F F k≠i T|F T|F F
&
Si+1A B
D C
Sb
iA
b
e
i,k≠
k
A
b
i,iGb
iS
iS
k≠i
A
Sf
iA
f
i,kGf
iS
kC
A
f
j,nSf
iA
f
i,kGf
iS
kS
nB
Figure 4.The block diagrams of the self-blocking gene (A). The block diagram of the function genes that assign the certain cell functionality: (B) with two activators (enhancers), (C) with one activator (enhancer
)
A
f
j,nSf
iProcess Description, the Loop-Type Inhomogeneous Cell Formation Development.
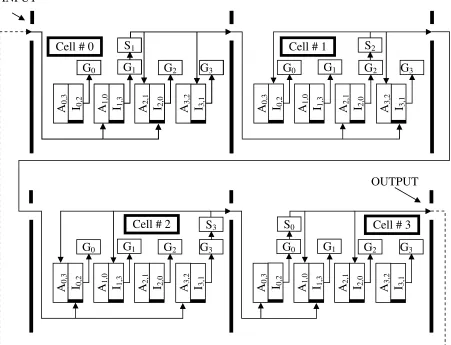
A graphical representation of the above rules and process description for two cases N=M=4 and N=4, M=3 is shown in Figure 5.
Let us assume a line of four initially uniform cells (M=4) which stick together according to the specified above rules. Suppose each cell comprises four asymmetric pattern genes (other genes will be in use later). In Figure 5 (the asymmetric pattern genes are showed only), the component indexes correspond to Table 1 where N=4. Without any external signal (no activator substance at the corresponding enhancers), there is no asymmetric pattern genes expression and a functional state of all cells is equal. For a start (step #0 assume a source of substance S0 is connected to the left
(input) of Cell#0. According Table 1 and Figure 5 it have to activate in the cell#0 enhancer A1,0 of gene G1
gene G3 and prohibits expression of the gene G3 caused
by the substance S2 which (as it will be shown later) is
produced in the adjacent cell #1. Therefore, the substance S1 is the only one, which is expressed in the
cell #0 and moves from the cell #0 to the adjacent cell #1. Here, in the cell #1, (step #1) the substance S1
repeats the above cycle concerning the enhancer A2,1 of
the gene G2 and the silencer I3,1 of the gene G3. The
gene G2 expresses the substance S2. In one’s turn, in the
cell #2 (step #2) the substance S3 is emerged and in the
cell #3 (step #3) the substance S0 correspondingly. If to
create a ring out of the line of the above four cells (to connect the output of the cell #3 to input of the cell #0) at step #4 the substance S0 have to travel to the cell #0
and activate the gene G1 again. Therefore, the four-step
cycle has to repeat in time continuously, establishing: in the cell#0 the activator substance S0 and the
expressed substance S1 only, in the cell #1 the activator
substance S1 and the expressed substance S2 only, and
so on. The unique interchange of the active asymmetric
S
i+1I
i+1,i
+
3
A
i+1
,i
G
i+1I
i,i+2
A
i,i+
3
G
iI
i+2,i
A
i+2
,i
+
1
G
i+2I
i+3,i
+
1
A
i+3
,i
+
2
G
i+3S
1I
1,3A
1,0
G
1I
0,2A
0,3
G
0I
2,0A
2,1
G
2I
3,1A
3,2
G
3S
2I
1,3A
1,0
G
1I
0,2A
0,3
G
0I
2,0A
2,1
G
2I
3,1A
3,2
G
3S
3I
1,3A
1,0
G
1I
0,2A
0,3
G
0I
2,0A
2,1
G
2I
3,1A
3,2
G
3S
0I
1,3A
1,0
G
1I
0,2A
0,3
G
0I
2,0A
2,1
G
2I
3,1A
3,2
G
3Cell # 0
Cell # 1
Cell # 2
Cell # 3
INPUT
OUTPUT
be at any value of M=N (or for higher modes M=2N, M=3N,…) On the contrary, if M≠N (M≠2N, M≠3N,…) then every cells’ state would be changed every M-step cycle. For example on M=3 and N=4 (Figure 5) the initial activator substance S0 in the cell#0 after 3-step
cycle would be changed by the activator substance S3.which have to activate the gene G0 other than G1 as
at the start of the process. To start the process a spontaneous emergence of an initial activator substance Si is needed. An internal and external source of
activator substance is considered. In case of the internal source, the initial spontaneous activator substance Si of
any kind may emerge in any cell (all cells are equal at the starting time). This case, in example above, the unique interchange of the active asymmetric pattern genes may take one of the following forms: (with equal probability) 1) C0→S1, C1→S2, C2→S3, C3→S0,
2) C0→S2, C1→S3, C2→S0, C3→S1, 3) C0→S3, C1→S0,
C2→S1, C3→S2 and 4) C0→S0, C1→S1, C2→S2, C3→S3.
In case of the external source, its location and its expressed substance determine one of the previously defined unique interchange forms.
Process Description, the Line-Type Inhomogeneous Cell Formation Development.
After establishing on M=N time-independent distribution of the active asymmetric pattern genes, the activation of corresponding self-blocking genes enhancer Abei in each cell takes place, creating the
unique loop-like inhomogeneous cell structure (the loop-like coordinate system, cells #0 through cell #19 in the plane z=0, Figure 2). Expressions of the self-blocking genes in each cell of this structure serve as the sources of external substances for activation of the sets of the symmetric pattern genes in the lines of cells connected at one end to the corresponding cell of the loop-like structure. After activation of the corresponding self-blocking genes, four line-type inhomogeneous cell structures are established. (four line-type coordinate systems, cells #0ru through #3ru and cells #0lu through #3lu with their origins at cell#10; cells #0rd through #3rd and cells #0ld through #3ld with their origins at cell#0, plane x=0, Figure 2). In the inhomogeneous cell structures above, the active self-blocking genes will activate various function genes in different cells so assigning various physical properties to the corresponding cells.
Example.
The example is intended only to demonstrate how the information is stored and a way the information is deciphered during the cell differentiation process. Therefore, to ease the process description, the oversimplified synthesized function genes’ physical properties are employed in lieu of the real ones.
In general, according to the model, after the first two stages various self-blocking genes are active in different blastula cells. A physical conversion of the initial blastula formation takes place at the third stage of the cell differentiation process. At this stage, a variety of active self-blocking genes activates
corresponding function genes, which, in their own turn, provide a physical transformation of corresponding cells. This way a nominal living creature arises.
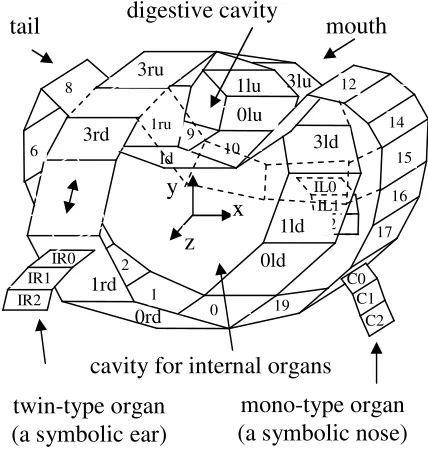
Let us apply the argumentation above to the blastula (Figure 2). The asymmetric movement is assumed for the cells in plane z=const=0. Let us assume that external source of the initial spontaneous activator substance locates around cell #10. This case, for the given set of N=20 asymmetric pattern genes the unique and time-independent distribution of the expressed substances would be established when the number of the blastula cells in plane z=0 reaches M=N=20 (Cells #0 through #19). At this moment (stage #1), the set of corresponding self-blocking genes Gb0 through Gb17
would to be activated by the asymmetric pattern genes and so the loop-like inhomogeneous cell formation (coordinate structure) is created. At the same stage in the cell #10 (cell #0), the expressed substance of the self-blocking gene Gb10 (Gb0) activates the symmetric
pattern gene Gss10 (Gss0). Its expressed substance Sss10
(Sss0_ moves to neighboring cells #0ru (#0rd) and #0lu
(#0ld) and serves as the external substance Sext to
activate the set of the symmetric pattern genes. The next stage #2 starts with activation in the cells #0ru (#0rd) and #0lu (#0ld) the symmetric pattern gene Gsu0
(Gsd0), sequential activation the symmetric pattern
genes Gsu1 (Gsd1) through Gsu3 (Gsd3) in the
corresponding cells #1ru (#1rd) through #3ru (3rd) and #1lu (#1ld) through #3lu (#3ld), and the final activation of the corresponding self-blocking genes Gsubi (Gsdbi).
Thus, four line-type inhomogeneous cell formations (coordinate systems) are created.
At the next stage #3a the initial blastula should be converted into the two-box formation. A deformation, caused by the appropriate increasing of some cells’ sizes (for example, cells #3ru, #3lu, #1 and #19) inside the non-stretchable shield may provide the process. Hence, let us assume 1) that active self-blocking genes Gsdb3, Gb1 and Gb19 in the
corresponding cells #3rd, #3ld, #1 and #19 activate the enhancers of the function genes Gfst and Gfstt, 2) these genes express substances that cause the growth of corresponding cells. The term “the appropriate increasing of cells’ sizes” here means that: 1) final sizes of cells #3td and #3ld are greater than the sizes of cells #1 and #19 (provided by Gfstt≠Gfst) and 2) the sizes of the modified cells are large enough. This case a deformation process inside the non-stretchable shield convert the initial blastula into a two-box spatial structure (Figure 6) that hereinafter is called a nominal living creature.
Thus, the function genes Gfst and Gfstt expressed substances and the enhancers’ receptivity to the substances expressed by the specific self-blocking genes’ contain the information on the blastula conversion into the two-box formation. The loop-type inhomogeneous cell formation (coordinate system) and the line-type ones govern the deciphering, i.e. provide the appropriate self-blocking genes activation at the appropriate place.
2) the free space availability signal and 3) the new cell identity signal. The concentration gradient of the specific substance may represent the limb size signal (for example the expression of the gene Gf1). In that
case, the source of the substance determines the origin of the limb, and the distance, at which its concentration level is sufficiently large, determines the limb size. The free space availability signal (for example the expression of the gene Ga) is intended for prohibition of the cells’ fission process inside a solid cell formation and for authorization of the cells fission on its surface (peripheral cells fission only). The new cell identity signal (for example the expression of the supporting self-blocking gene Gsup) intends for the newly created cells marking. Thus, in order to create a limited number of the new cells (the limb); the above-mentioned three signals have to control the function gene, which initiate the cell fission (for example Gf3). Hence, let us assume
the following. 1) The supporting self-blocking gene Gsup expression may penetrate into the newly created cells only, and activate in the new cells the same supporting self-blocking gene Gsup. 2) In active state, the gene Ga, expresses substance Sa that serves as the free space availability signal. Two conditions are needed to activate this gene in a cell: a) the availability of a free space on the cell’s surface to attach a new cell and b) the supporting self-blocking gene Gsup (the new cell identity signal) is active inside the cell. Thus, the same identity (active state of gene Gsup) is assigned to all newly created cells. 3) In the cell #17 the Gb17
self-blocking gene’s expression activates the function gene Gf1 so creating the concentration gradient substance.
4) The function gene Gf3 induces the cell fission when
its triple enhancer is activated by expressions of the genes Gsup, Ga and Gf1. The concentration level of the
gene’s Gf1 expression (with the origin in the cell #17)
should be large enough. 5) The self-blocking gene Gb18
activates the supporting self-blocking gene Gsup in the cell #18. Under the above-determined conditions, at the stage #3b in the cell #18 the first cell fission takes place, creating the new cell #C0. At the stage #3c, out of the cell #18, the gene’s Gsup expressed substance penetrates into the newly created cell #C0 and activates its supporting self-blocking gene Gsup. In the cell #C0 the supporting gene’s Gsup expression activates the gene Ga. Thus, in the cell #C0 genes Gsup and Ga are in the active state, and, if in the same cell #C0 the concentration level of the gene’s Gf1 expression is large
enough, the second cell fission takes place, creating the new cell #С1. The same processes go for the cell #C1 and so on, till the moment the concentration of activator substance, expressed in cell #17, becomes insufficient to activate the gene Gf3 in the last created cell (in the
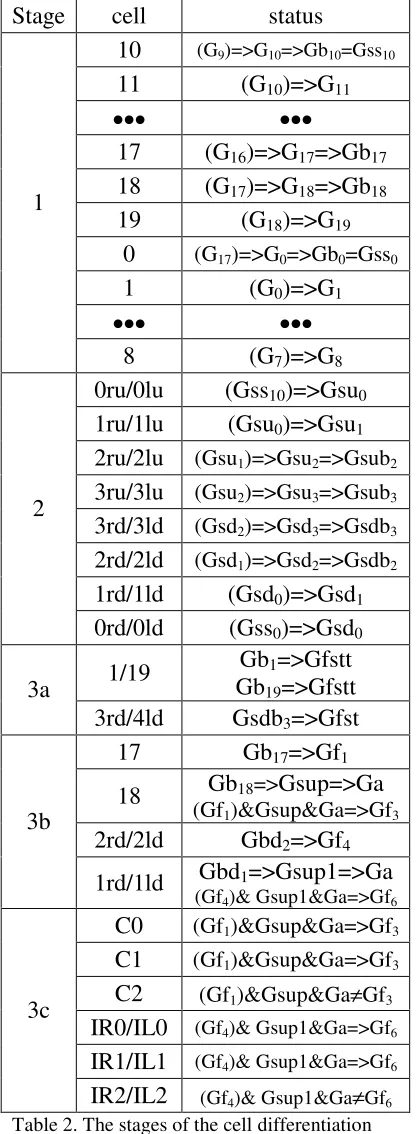
example it is the cell #C2). Thus, a monotype limb – a nominal nose is created. The similar processes take place in the cells #IR0, #IR1 and #IL0, #IL1 which result in creating a twin-type limb – a nominal ears. Table 2 presents the summary of the 3-stage cell differentiation process. The notations in Table 2 mean the following. 1) (Gi)=>Gk means: the substance,
the Table 2. 2) (Gfi)&Gsup&Ga=>Gk means the
substance, expressed by the gene Gfi in the adjacent cell,
plus the expressed substance of the gene Gsup plus the expressed substance of the gene Ga activate three enhancers of the gene Gk in the cell#m.
Discussion.
In the example above, let us reject the asymmetry movement requirement (all others remain the same). This case, the external spontaneous expression (near the cell #10), causes in the loop-like cell structure the sequential activation of the asymmetry pattern genes both right and left of the activation source. This case, at stage #1, on M=N, the mirror symmetry inhomogeneous cell formation arises across the plane x=0. Then, after the stage #2 the inhomogeneous cell formation with two mirror symmetries arises: across the plane z=0 (as in the above example) and across the plane x=0. Thus, the asymmetry movement requirement ensures the bilateral symmetry for the simulated samples. The variety of real living creatures possesses this kind of symmetry.
In the example above the cells of the loop-type inhomogeneous formation (coordinate system) serve as the origins for the type ones. The cells of the line-type inhomogeneous formations, in their own turn, may become the origins of the new line-type inhomogeneous formations of the higher orders. Therefore, the multi level tree-type inhomogeneous cell formations (coordinate systems) are available. On appearance, these formations may look like the L-system pattern (Lindenmayer, 1968). The number of sets of the symmetric pattern genes limits the complexity of the tree-type cell formations.
16
3ru
17
0ld 1lu
1rd
9
C2 C1 C0 IL2
IL1 IL0
IR1 IR2
IR0
3lu
ld
19 2
0rd
x
y
z
0 1 6
8
10
12
14
15
3rd 1ru 3ld
0lu
1ld
mouth
tail
cavity for internal organs
twin-type organ
(a symbolic ear)
mono-type organ
(a symbolic nose)
digestive cavity
organ
facts. According to the model, active self-blocking genes govern the further cell fate. Therefore, if the transplantation of cells takes place after the
self-blocking genes are locked in; the physical property of the cells should remain unaltered at any place. In this situation, the model results fit the limb transplantation experiments of Harrison (1918).
If to amputate, say, across the cell #C1, it has to activate in the cell #C0 the process at the stage #3c and so to regenerate the cells #C1 and #C2. The function gene Gf1 in the cell #17, the function genes Ga and Gsup in the cell #C0 provide the needed information (after amputation the cell #0 becomes peripheral). The model simulates a tissue recovery process.
Let us assume, that “wounded” cell has property to generate the non-specified cells (the cells with inactive state of all their self-blocking genes) until the wound is “healed”. This case, if to amputate a cells, say, the cell #15 through cell #18 together with the cells #C0, #C1, #C2 (a limb amputation), the “wound” should be filled in with the non-specialized cells. Then the asymmetric pattern genes may restart the cell differentiation process (stage #1 and stages #3b, #3c). This will result in the limb regeneration. In this case, the asymmetric pattern genes provide the information for the regeneration process. The model result fits the experiments on the limb regeneration.
If, in the case above, to amputate the limb bud after the self-blocking genes lock in, but before the limb creation (stage 1), rotate the limb bud 1800 and replace it on the cells #12 and #17, the processes at stages #3b and #3c have to create the rotated 1800 limb (the self-blocking genes govern the process). In addition, let us assume that during the after-rotation “healing” some amount of the new non-specialized cells emerge. The asymmetric pattern genes may restart the cell differentiation process for the new non-specialized cells. As a result, two limbs emerge. The normal limb – out of the cells emerged during the second “healing” and the mirror one – out of the rotated cells. The asymmetric pattern genes provide the information on the regeneration for the normal limb. The self-blocking genes in the amputated limb bud provide the information on the mirror limb creation. The model results qualitatively fit the limb bud rotation experiments (Bryant and Iten, 1976)
Conclusions.
Based on the assumption on the discreet, Boolean type genes’ activity, the algorithm of genes’ interaction within some sets of genes are postulated and used for the cell differentiation process simulation.
Under the model assumptions, the cell differentiation process starts with the homogeneous spheroid cell formation (blastula) and comprises three consecutive stages. 1) The loop-like inhomogeneous cell formation development and corresponding set of the self-blocking genes activation - the set of the asymmetric pattern genes governs the process. 2) The line-type inhomogeneous cell formations, with their origins at different cells of the loop-type formation, development and corresponding self-blocking genes activation - the sets of the symmetric pattern genes govern the process. 3) The variety of the function genes activation in the complex inhomogeneous cell
Stage
cell
status
10
(G9)=>G10=>Gb10=Gss1011
(G
10)=>G
11•••
•••
17
(G
16)=>G
17=>Gb
1718
(G
17)=>G
18=>Gb
1819
(G
18)=>G
190
(G
17)=>G
0=>Gb
0=Gss
01
(G
0)=>G
1•••
•••
1
8
(G
7)=>G
80ru/0lu
(Gss
10)=>Gsu
01ru/1lu
(Gsu
0)=>Gsu
12ru/2lu
(Gsu
1)=>Gsu
2=>Gsub
23ru/3lu
(Gsu
2)=>Gsu
3=>Gsub
33rd/3ld
(Gsd
2)=>Gsd
3=>Gsdb
32rd/2ld
(Gsd
1)=>Gsd
2=>Gsdb
21rd/1ld
(Gsd
0)=>Gsd
12
0rd/0ld
(Gss
0)=>Gsd
01/19
Gb
1=>Gfstt
Gb
19=>Gfstt
3a
3rd/4ld
Gsdb
3=>Gfst
17
Gb
17=>Gf
118
Gb
18=>
Gsup=>Ga
(Gf
1)&Gsup&Ga=>Gf
32rd/2ld
Gbd
2=>Gf
43b
1rd/1ld
Gbd
1=>Gsup1=>Ga
(Gf4)& Gsup1&Ga=>Gf6
C0
(Gf
1)&Gsup&Ga=>Gf
3C1
(Gf
1)&Gsup&Ga=>Gf
3C2
(Gf
1)&Gsup&Ga
≠
Gf
3IR0/IL0
(Gf4)& Gsup1&Ga=>Gf6IR1/IL1
(Gf4)& Gsup1&Ga=>Gf63c
IR2/IL2
(Gf4)& Gsup1&Ga≠
Gf6Table 2. The stages of the cell differentiation process.
Stage #1 – the loop-like inhomogeneous cell structure creation.
Stage #2 –the line-type inhomogeneous cell structures creation.
formation - the sets of the self-blocking genes govern the process.
Under model assumptions the multi level tree-type inhomogeneous cell structures creation is possible. The number of the pattern genes limits the complexity of the tree-type inhomogeneous cell structure. According to the model, in order to provide the further blastula development process, the concentration gradient fields may appear after the initial stages of the cell differentiation process
As simulated by the model, results qualitatively coincide with some of the experimental facts.
References.
Van den Heuvel, M., Nusse, R., Johnston, P., and Lawrence, P. 1989. Distribution of the wingless gene product in Drosophila embryos: a protein involved in cell-cell communication. Cell 59: 739-749.
Kerszberg, M. and Wolpert, L. 1998. Mechanisms for positional signalling by morphogen transport: a theoretical study. J Theor. Biol. 191: 103-114.
Gonzalez, F., Swales, L., Bejsovec, A., Skaer, H., and Arias, A. 1991. Secretion and movement of wingless
protein in the epidermis of the Drosophila embryo.
Mech Dev 35: 43-54.
Pfeiffer, S., Alexandre, C., Calleja, M., and Vincent JP. 2000. The progeny of wingless-expressing cells deliver the signal at a distance in Drosophila embryos. Current Biol. 10: 321-324.
Aristid Lindenmayer, "Mathematical models for cellular interaction in development." J. Theoret.
Biology, 18:280--315, 1968 (see
http://en.wikipedia.org/wiki/L-system )
Harrison, R.G. 1918. Experiments on the development of the forelimb of Amblystoma, a self-differentiating equipotential system. J. Exp. Zool. 25: 413-461. (see http://www.devbio.com/article.php?ch=3&id=18 ). Bryant, S.V. and Iten, L.E. 1976, Supernumerary limbs in amphibians: Experimental production in
Notophthalamus viridescens and a new interpretation of their formation. Dev. Biol. 50: 212-234. (see