VOLUME 2
April 1949
Number 2
In this Issue
What's Ahead for the Range Society?-Presidential Address,
Annual Meeting, 1949... ...
Joseph F. Pechanec
39
Spraying 2, 4-D by Airplane on Sand Sagebrush and other
Plants of the Southern Great Plains ... ...
E.H. McIlvain and D.A. Savage
43
Methods of Determining Utilization of Range Forage...
Harold F. Heady
53
Machinery of Seedbed Preparation and Seeding on
South-Western Ranges ... ... ...
Darwin Anderson and A.R. Swanson
64
Getting Better Records of Vegetation Changes with the
Line Interception Method... ...
A.L. Hormay
67
A Proposed Reclassification of Range Forage Types ...
R.R. Humphrey
70
News and Notes ... ... ... ... 83
Current Literature... ... Robert A. Darrow
88
Annual Meeting, 1949... ... ... ... 93
Published Quarterly by
Journal
of
Volume 2, Number 2, l April, 1949
RANGE- MANAGEMENT
WHAT'S AHEAD FOR THE RANGE
SOCIETY?-
PRESIDENTIAL
ADDRESS,
ANNUAL MEETING, 1949
JOSEPH F. PECHANEC
423 U. S. Court House, Portland, Oregon
vv
ITH this, the Second Annual Meet- ing, it is not too early to examine what the future may hold for the Ameri- can Society of Range Management. Since what the future holds depends largely upon us as members, we must de- termine what we want the Society to be, lay plans to that end, and then see that these plans are carried out.What do we want the Society to be? We have two alternatives. First, we can ride along on our laurels and become a society of paper-readers, and technique- perfecters forever doomed to mediocrity. Or second, we can accept the challenges presented by the objectives of our So- ciety, so ably stated in our Constitution, and become a constructive force in mold- ing the management of the grassland re- source and in shaping the future of this country.
It would be easy to follow the first’ al- ternative, and would require but little effort on our part. On the other hand, to accept the challenges presented by our objectives will require considerable per- sonal effort, imagination, leadership and participation by all members. Which shall it be? If each of you were asked this question, I am sure you would un- hesitatingly say, “Let’s make something
worth while out of our Society. Let’s fulfill our objectives.”
Accordingly, let us review our objec- tives, examine how well we are achieving them, and plan our course for the future. Our Constitution states “The objectives of the Society shall be to foster advance- ment in the science and art of grazing land management, to promote progress in the conservation and greatest sustained use of forage and soil resources, to stimu- late discussion and understanding of scientific and practical range and pasture problems, to provide a medium for the exchange of ideas and facts among So- ciety members and with allied technolo- gists, and to encourage professional im- provement of its members.” These objectives map a course that requires ag- gressive action.
It is too much to expect that we can report complete attainment of the objec- tives within the one short year of our existence. We can, however, report no- table progress. You have now seen two issues of our Journal, we are starting our second annual meeting, one Section is or- ganized, we have cooperated with the American Society of Agronomy in present- ing a joint session on range at their annual meeting, and our organization is begin- ning to function rather smoothly. From
40 JOSEPH F. PECHANEC
these achievements it can be seen that we have progressed farthest in providing a medium for the exchange of ideas and facts among Society members and with allied technologists, and in encouraging professional improvement of our mem- bers. Now where are we going?
Humbly, and I hope without being pre- sumptuous, I would like to suggest several goals toward which we might work. The attainment of these will carry us a long way toward fully satisfying the objectives of our Society.
We must strive to make our Society a smoothly functioning, business-like organ- ization, worthy of respect.
We must build the Journal into the stature it justly deserves. We have made a magnificient start, but it will require constant vigilance and never-ending care on the part of all of us to bring it to maturity, to make it a tool no range man can afford to be without.
One of the greatest challenges we have is to determine how by research, and to prove by practice that grazing livestock and big game in our forests and on our grasslands need not necessarily be dam- aging to the land, ruinous to the water- sheds, and destructive of civilizations.
One cannot, in reading Fairfield Os- born’s book “Our Plundered Planet” es- cape the realization that in the history of the world grazing by livestock has played an important part in the destruction of many ancient civilizations. In Palestine, in northern Syria, and in northern Africa nomadic herds of sheep and goats assisted in the almost complete destructions of civilizations that thrived there.
Not only the ancient civilizations have suffered; within the last century, or even a shorter period havoc has been wrought by grazing in Australia, New Zealand, Africa, South America, Mexico, and in places in our own country.
The inference that grazing by livestock
is destructive need not be. It is a re- flection, not on grazing by livestock, but on the consequences of lack of intelligent management. It is a tragic testimonial to the fact that in grazing native vege- tation we must work with and not against Nature. It is convincing proof that con- siderable knowledge is needed regarding growth requirements of plants and main- tenance requirements of soils in correctly managing native ranges.
We know that utilization of forage by livestock and big game can be and is com- patible with conservation of soil and water, and can contribute materially to an enduring civilization. We have nu- merous examples covering a short period of time showing that this is true. Un- fortunately, the use of grazing practices which are compatible with conservation is far from universal. In most instances the proper methods are known, but have not been used. In other instances more knowledge is needed. It is a worthy chal- lenge to our Society and to you as mem- bers to develop by research the needed procedures and encourage by education and practice use of the proper methods. We must take every opportunity to point out what good range manage- ment on half of our land area means to the Nation. The range livestock indus- try, the welfare of hundreds of com- munities dependent upon the livestock industry, the maintenance of satisfactory watershed conditions, the maintenance of satisfactory big game habitat and a hunt- able population of big game animals, all these are dependent upon how well we achieve this goal.
PRESIDENTIAL ADDRESS 41
with a Society crystallized representing our own profession, we might well con- sider striving toward an organization of all workers dealing with grass and grass- lands.
One needs but to look over the 1948 Yeakbook of Agriculture “Grass” to be forcibly impressed by the importance of grass to this country. Nearly 60 percent of the land area of the United States is used for hay and pasture. This area pro- vides about half of the feed for all live- stock, and nearly all of the forage for large numbers of big game animals. A resource of such magnitude needs a national society concerned with its preservation and use.
A move to develop a Grassland Society of America would be extremely timely. There has been a rapidly growing aware- ness of the importance of grass, either native or cultivated, as a crop. Several other societies have pasture sections deal- ing with the problems of grassland man- agement as influencing their particular interests. Numerous conferences and demonstrations have been and are being held dealing with grass and grasslands. In other countries there are several grassland societies, whose aim and pur- pose are the same as ours might be. But the manner of organization of a Grass- land Society for America might be differ- ent. It might be, as suggested by Dr. Aamodt in his address to the American Society of Agronomy, “a coordinating or- ganization of the specialized groups and regional interests in grassland agricul- ture.” As such it would not replace the American Society of Range Management, or any of the pasture sections in existing societies. It would effectively serve as a common meeting ground.
As the major professional society whose objectives deal entirely with grassland problems, we should take the lead in the formation of a Grassland Society of America.
There are still other ways in which we can weld this Society of ours into a potent force, other goals we must set and reach. We must, in the future, take a stand on matters of national importance pertaining to range conservation and utilization and express our views. We have not done so up to the present time primarily because we were in the throes of getting our So- ciety to functioning more smoothly and a Journal published. With these activi- ties well advanced we can more nearly fill the obligation stated in the objectives of our Society “to promote progress in the conservation and greatest sustained use of forage and soil resources, (and) to stimu- late discussion and understanding of sci- entific and practical range and pasture problems.”
Another way in which we can improve our Society, especially as a medium for the interchange of ideas and to encourage professional improvement of our mem- bers, is to aggressively encourage the es- tablishment of sections. At the present time we have only the Wyoming Section. It is obviously impossible for more than a small proportion of our members to at- tend the national meeting. All that can keep the Society together under these con- ditions is the Journal, and even the most superior publication can go only so far in this respect. The inability to take part in or attend the national meeting, and to meet with other workers in the field can be overcome by the formation of active local sections. We, as a Society, must en- courage their establishment but you mem- bers in the field must carry the burden, form these Sections and weld them into closely knit units.
42 JOSEPH F. PECHANEC
assist educational institutions in setting ciety affairs, to work in committees or as up curricula. Moreover, we can work individuals for the objectives, and to offer with the Civil Service Commission in set- constructive criticism or suggestions to ting up standards for professional exami-
nations. It does not, however, seem ad- visable to move so far as to set up a list of “accredited institutions” which meet the minimum requirements we set up.
We can continue to cooperate with closely allied societies in presenting joint sessions on range management and thereby extend a fuller realization of the importance of range and its interrelation- ships. This last summer we cooperated with the American Society of Agronomy, and preliminary contacts have been made with the Western Section of the American Society of Animal Production for a joint meeting next summer.
There are many other ways which would assist in developing the Society into an outstanding professional group, but the most important of all is to have an ac- tive, participating membership. Each of you, in taking out membership in the So- ciety has assumed an obligation-an ob- ligation to take an active interest in So-
your officers.
If we do not have an active leadership, well-formulated plans, a far-reaching pro- gram, and an enthusiastic participating membership we are doomed to slip into the role of just another paper-reading society.
Spraying 2,4-D by Airplane on Sand Sagebrush and
Other Plants of the Southern Great Plains
E. H. McILVAIN AND D. A. SAVAGE
Bureau of Plant Industry, U. S. Southern Great Plains Field Station, woodward, Oklahoma
E
XTENSIVE tests were made in May1947 and 1948 of the airplane appli- cation of 2,4-D (2,4-dichlorophenoxyace- tic acid) on sagebrush infested rangeland near the U. S. Southern Great Plains Field Station, Woodward, Oklahoma. These studies followed successful trials of hand spraying 2,4-D on rod-square plots of sand sagebrush (Artemisia filifolia Torr.) in May, 1946.
The testing of chemicals was started after extensive studies by the Station since 1937 had shown conclusively that eradica- tion of sand sagebrush by mowing is an extremely effective range improvement practice. Studies of vegetation and graz- ing tests during the past 10 years have shown that removal of sand sagebrush by mowing in two successive years during June increased grass density 90 percent, carrying capacity 45 percent, gain per head 14 percent, and gain per acre 78 percent, as published in semi-annual prog- ress reports of the Station and else- where (2).
Although mowing was highly effective, it was too slow and costly to be widely used on large tracts of low-priced range- land. The new chemical 2,4-D sprayed by airplane promised to overcome both of these important objections.
The results reported herein are based on investigations conducted by the Divi- sion of Forage Crops and Diseases, Bureau of Plant Industry, Soils, and Agricultural Engineering, and the Bureau of Animal Industry, Agricultural Research Admin- istration, U. S. Department of Agriculture, in cooperation with the Oklahoma Agri-
cultural Experiment Station. In this study, the authors are indebted to J. R. Harlan, Bureau of Plant Industry, who actively participated in all phases of the tests in 1947; to A. L. Brown, formerly of the same agency, who was in charge of the spraying work in 1948; to J. E. Webster and V. G. Heller, Oklahoma Agricultural Experiment Station for conducting root reserve studies of the shrubs; and to W. H. Black, Bureau of Animal Industry, for cooperation in the grazing studies.
DESCRIPTION OF EXPERIMENTS Location, Soils, Vegetation, Precipitation
The tests were made on over 1000 acres of sandy rangeland near Higgins in the Panhandle of Texas and on the Southern Plains Experimental Range near Fort Supply, Okla. These areas are represent- ative of nearly 5,000,OOO acres of land in- fested with sand sagebrush, skunkbush
44 E. H. MCILVAIN AND D. A. SAVAGE
out the sandy areas. Shinnery oak is confined to the Miles series of loamy fine sand where it often makes up more than 75 percent of the foliage density. Dom- inant grasses in the understory are blue grama (Bouteloua gracilis (H.B.K.) Lag.) and sand dropseed (S~orobolus cryptandrus (Torr.) A. Gray). Despite heavy grazing in the past, many of the tall native grasses are present in small quantities. Sufficient grasses occur between and within the shrubs to provide a good basis for rapid natural recovery when the shrubs are killed. Reseeding is rarely necessary.
Average annual precipitation at Wood- ward is 23.06 inches with 70 percent, or 16.20 inches, falling as rain during the 6 months April through September. April, May, and June are the 3 wettest months of the year, and the 1947 precipitation during these months was nearly twice nor- mal. Growing conditions for all shrubs were extremely favorable. Annual pre- cipitation over the region to which these tests are applicable is generally less than 23 inches and drops to 14 inches in eastern Colorado.
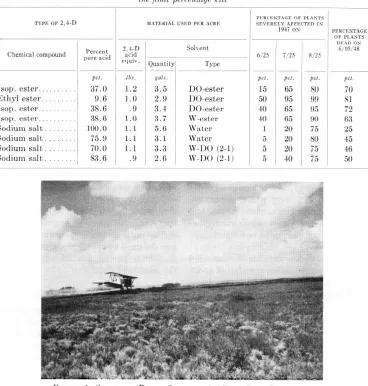
Commercial formulations of ethyl, butyl, and isopropyl esters of 2,4-D were tested in comparison with commercially prepared sodium salts of 2,4-D and with a mixture of the pure acid of 2,4-D in a water solution of sodium carbonate (to be hereafter referred to as a homemade salt). The homemade salt was formulated to provide a product the cost of which would not be prohibitive for use on low- value rangelands. It is made by thor- oughly dissolving 0.5 pound of sodium carbonate in 4 gallons of water, adding 1 pound of pure 2,4-D and then emulsifying with 1 gallon of diesel oil. This is suffi- cient for 1 acre. No amines were included in the 1947 tests, but were used along with the other chemicals in 1946 and 1948. The water used in the tests came from a local well near the landing
strip and did not contain an excess of minerals. The diesel oil was No. 2 grade and was supplied direct to the mixing tank from a tank truck.
Equipment
All flying tests were made by an air- plane provided cooperatively by an agri- cultural flying service company, the Franklin Flying Service, Davis, Calif. The airplane, a converted Stearman, was specifically equipped for spraying. The boom extended the full 30 feet length of the wings and was equipped with nozzles at la-inch intervals. Each nozzle had a spring-loaded shut-off valve. The lOO- gallon supply tank was mounted in the front cockpit, and the liquid was forced out of the nozzles at about 25 pounds pressure by a wind-driven centrifugal pump. A by-pass valve on the pump gave return-flow agitation to the liquid in the tank. By changing the size and number of nozzles and the pressure within the boom, the volume of liquid applied to each acre could be controlled. The pilot, a World War II veteran, was well qualified by several years spraying experience.
In determining the best time or date-of- spraying, ground equipment was used. But this machine lacked efficiency. A small tractor was equipped with a belt- driven gear pump which supplied the liquid from a barrel to a well-braced, lo- foot boom at 30 pounds pressure. The barrel supply tank did not contain a me- chanical agitator, which would have fa- cilitated mixing powder forms of 2,4-D and emulsifying water and diesel oil. At the slow speed which was necessary in traveling over the rough rangeland, the lowest useable volume per acre was 12 gallons. However, this was reduced to 5 gallons with much superior equipment used in 1948.
SPRAYING 2,4-D BY AIRPLANE 45
commercial livestock spraying machine with a gasoline-driven pump and me- chanical agitator. The capacity of the tank was 150 gallons and since no batches over 100 gallons were used a very thorough job of mixing was accomplished. The pump on the spraying machine was used to transfer the mixed material into the supply tank of the plane.
Methods
The plots for the date-of-spraying tests, which were made at two-week intervals, were 20 feet by 719 feet, or one-third of an acre. Duplicate plots were sprayed on each date. Plots sprayed by airplane in testing different brands and formulations of 2,4-D were one mile long and 33 feet wide. The width of these plots was en- tirely too small, however, because cross winds carried an unknown quantity of material away, but not onto adjacent plots since they were widely separated. The plots sprayed by airplane for rate and volume tests were from one-fourth to one- half mile long and up to one-eighth mile wide.
All plane flights were made cross-wind so that a compensating over-lap of spray resulted in the calibrated quantity of ma- terial being applied to the downwind side of the wider plots. Three flagmen were used to mark the plane course over each plot; one at each end of a flight and one in the middle. Each flagman waved a yard-square white flag to enable the pilot to spot his flight line. Measured stakes were used to keep the flagmen in proper alignment. Distribution of the oily spray was checked by the use of white cards. When water was used as a carrier, micro- scope slides darkened with smoke were used to catch the spray.
Early effects of the treatments were ob- served daily for three. days after spray- ings. Thereafter estimates of percentage defoliation and discoloration were made
at monthly intervals. Final results of percentage kill were determined by four observers over a year later. Each observer counted the number of dead and living sagebrush plants in alternate belt transects approximately 6 feet wide and extending either the entire length of the plots or until each observer had counted approximately 100 plants. On the wider plots each observer read two such tran- sects extending a half mile in length. The data collected from the wider plots were subjected to an analysis of variance. There was no significant difference be- tween the readings obtained by any one man on two transects within each plot, nor between men on the same plot. A variation of 5.1 percent was necessary for a statistically significant difference at the 5 percent level between plots.
Several of the plots were situated half on native range mowed in June of 1946 and half on non-mowed native range to determine the effects of mowing before spraying. All plots were grazed in the spring until treated ; thereafter, grazing
was deferred to enable the grass to make maximum growth and to compete with the weakened brush.
46 E. H. .MCILVIN AND D. A. SAYAGE
favorable moisture conditions for growth at less than one pound per acre. l’lants might have accormt,ed for this difference. severely affected were distorted, drying or
TABLE 1
#CL.
Isop. ester... 37.0
Ethyl ester.. 9.6 Isop. ester.. 38.6 Imp. ester.. 38.6 Sodium salt. 100.0 Sodium salt.
O/25
*cr.
15
50 40 40 1 5 5 5
pci. 9ct. #CL.
65 80 70 95 99 x1 65 95 7‘2
65 9” 63
20 75 2.5
20 80 45
29 75 46 40 75 50
Tests of Brands and Formulalions dried, purple-colored, and either partialIy Due to drifting of spray, the applica- or completely defoliated within 1 to tions on the long narrow plots were not 3 months after treatment. DO-ester in as heavy as indicated in table 1. At the the table indicates diesel oil and ester ms- reduced rates of applicat,ion, the esters terial combined; W-ester indicates water killed more sand sagebrush t,han the salts, and es& material combined.
SPRAYING 2,4-D BY AIRPLANE 47
is listed in the table as containing 100.0 percent pure acid, killed only 25 percent of the sagebrush compared to 45 percent for the commercial salts with which it was compared. However, on the wider plots where there was less drifting of spray the homemade salt killed 78 percent as com- pared to 86 percent for the best ester treatment.
1 As shown in Table 1, the esters affected
the sagebrush more quickly than did the salts. The test was not adequate to meas- ure accurately any differences between the various esters. However, other tests in- dicated that the isopropyl ester may be more effective than the butyl ester. The use of diesel oil instead of water as a car- rier for the isopropyl ester increased the kill by 9 percent. The addition of diesel oil to the salt solution used in this test did not increase the percentage kill ma- terially. However, the addition of one gallon of diesel oil per acre increased the effectiveness of the salt solutiop in several other tests made in 1947 with ground equipment.
Ninety-five percent of the.leaves of shinnery oak were distorted, discolored, and defoliated by the ester solution used at one pound per acre, and only about 10 percent of the leaves were similarly affected by the salt solutions. However, the shinnery oak in all plots was root- sprouting vigorously within three months after being treated and only a few stems were actually killed. The many, thick, horizontal roots of this plant do not seem to be greatly affected by 2,4-D in any form. Another test of the chemicals 2,4-D and 2,4-5-T (2,4,5 trichlorophen- oxyacetic acid), both in the form of iso- propyl ester, was made on shinnery oak in May, 1948. Although conclusions can- not be made until a year later, 2,4-5-T appears to injure shinnery more severely than 2,4-D.
Many native range legumes were found
growing in all treated plots one year after treatment. The native legumes do not appear to be as susceptible to 2,4-D as do the common legume crops. Legumes which were either not affected or not com- pletely killed included the vetches and loco weeds (Astragalus sp.) and (Oxytropis sp.), partridge pea (Chamaecrista fasci- culata (Michx.) Greene), bundle flower (Desmanthus illinoensis (Michx.) MacM.), western indigo (Indigofera leptosepalu Nutt.), silky prairie clover (Petalostemon villosus Nutt.), scurfpea (Psoralea sp.), sen- sitive briar (Leptoglottis Nuttallii D.C.), and perhaps most important in this re- gion, sand pea (Tephrosiu virginiana (L.) Pers.).
48 E. H. MCILVAIN AND D. A. SAVAGE
Date of Spraying alent, per acre is sufficient material when Of more importance than the brand or properly applied and in some instances formulation of 2,4-D used to kill sand appears to be more effective than higher sagebrush is the proper time of applica- rates (table 2). In general, the esters can tion and the stage of growth of the plant be used in smaller quantities than the salts (3). Semi-monthly sprayings made in
(4).
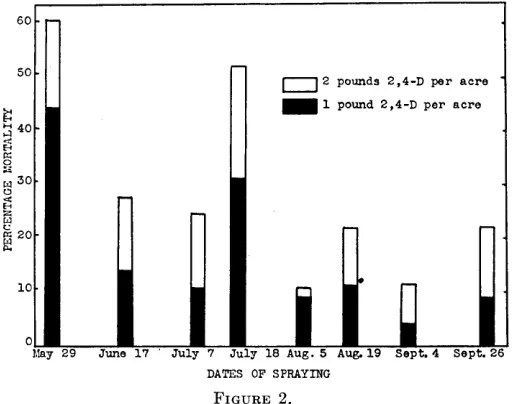
Whereas one pound of the sodium duplicate from May 29, 1947, until Sep- salt is the minimum effective dosage, tember 26, 1947, indicated that applica- three-fourths pounds of the ester, properly tions made when the plants were growing applied, appears to give comparable re- rapidly in May produced the highest per- sults. Some investigators have obtained centage kill (fig. 2). Sufficient soil mois- satisfactory results with as little as one-ay E
n
012 pounds 2,4-D per acre-1 pound 2,4-D per acre
!9 June 17 July 7 July 18 Aug. 5
DATES OF SPRAYING
FIGURE 2.
Aug.19 Sept. 4 Sept. 2 6
Average percentage mortality of sand sagebrush from duplicate plots sprayed with one and two pounds per acre of the homemade salt of 2,4-D, without diesel oil, on the dates indicated in 1947. Results were obtained in August, 1948.
ture and other favorable conditions for half pound of the ester. However, further rapid growth are essential and commonly experimentation is necessary before it can occur in May. Extensive date-of-spray- be definitely stated that one-half pound ing tests being conducted during 1948 by of the ester is sufficient material to give the Woodward Station should yield more consistent kills. Extensive tests con- conclusive information. There is some ducted with airplanes and ground-spray indication that sagebrush can be con- equipment, in 1948, when finally evaluated trolled in April as well as in May. in 1949, should provide more conclusive
Tests of Rates of 2,4-D and volumes information on many phases of the spray work .
of Carriers The kill of sagebrush resulting from
SPRAYING 2,4-D BY AIRPLANE 49
gallons of diesel oil were used. Five flight spacings; hence conclusions as to gallons of total fluid per acre, including its effectiveness cannot be made. It was one gallon of diesel oil, is suggested for noted that even a small quantity of the application of the sodium salt solu- water in the mixture causes crystalliza- tions, and at least 3 gallons when esters tion.
are used. Dense or tall brush requires
more fluid per acre than thin or low-grow- Comparison of Results on Mowed and
ing stands. Nonmowed Land
Test of Flight Spacings dense, succulent, and fast growing. The Regrowth on sand sagebrush is usually Flight spacings of 30, 45, 60, and 100 tests made in 1946 and in 1947 showed feet were tested. There was no essential conclusively that second-growth plants
TABLE 2
Summary of various rates of 2,4-D and carriers as applied by airplane on May 26-29, 1947,showing the e$ects upon sand sagebrush
TYPES OF 2,4-D MATERIAL USED PER ACRE PERCENTAGE OF PLANTS SEVERELY AFFECTED IN
1947 ON PERCENTAGE OF PLANTS
Plots two plane flights wide
pet. lbs. gal>. pet. pet. @ct. pet.
Isop. ester ... 38.6 .5 1.0 DO-ester 30 75 90 59
Isop. ester. ... 38.6 2.4 1.3 DO-ester 50 90 95 67
Isop. ester ... 38.6 1.0 3.0 DO-ester 66 90 99 86
Isop. ester ... 38.6 2 ..2 3.0 DO-ester 66 95 99 64
Plots eight plane flights wide
Butyl ester. ... Butyl ester. ... Butyl ester. ...
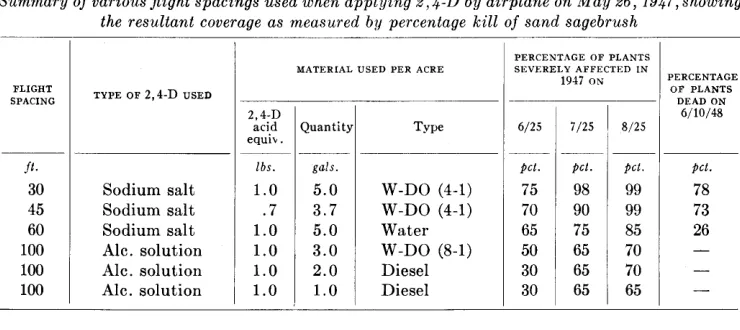
difference in the coverage and resultant kill obtained between 30- and 45-foot flight spacings when the flights were made crosswind in a wind velocity ranging from 10 to 20 miles per hour. Strips of live sagebrush plants were clearly ap- parent on all plots sprayed at 60- or lOO-foot intervals regardless of wind velocity or gallons of spray per acre (table 3). The material applied to the lOO-foot plots consisted of pure 2,4-D acid dissolved in methyl alcohol anti- freeze. This material appears to give good results but was not tested at other
are more susceptible than nonmowed plants to treatment with 2,4-D. The percentage kill resulting from one pound per acre of homemade salt was 78 percent on nonmowed range and 99 percent on second-year growth.
Characteristics of Regrowth of Sprayed Sagebrush
50 E. H. McILVAIN AND D. A. SAVAGE
47-48. These sprouts generally appear 1948 on the sagebrush plants sprayed in in the fall when conditions are favorable 1947 (table 4). From a total of 6778 for plant growth and may reappear the sagebrush plants randomly observed on following spring. Most of these sprouts two plots, nearly 20 percent produced die within a few weeks. Sagebrush shoots from underground parts. Only plants sprayed with one-half, three- 5 percent had regrowth on the stems of fourths, one, and one-and-one-fourth the old plants. The foliage cover on
TABLE 3
Summary of various flight spacings used when applying 2,4-D by airplane on May 26, 1947,showing the resultant coverage as measured b!y percentage kill of sand sagebrush
FLIGHT SPACING ft. 30 45 60 100 100 100
TYPE OF 2.4-D USED
Sodium salt Sodium salt Sodium salt Ale. solution Ale. solution Ah. solution
MATERIALUSED PER ACRE
lbs. gals.
1.0 5.0
.7 3.7
1.0 5.0
1.0 3.0
1.0 2.0
1.0 1.0
Quantit) Type 6/25 7/25 s/25
W-DO (4-l) W-DO (4-l) Water W-DO (8-l) Diesel Diesel
pet. pet. pet. 75 98 99 70 90 99 65 75 85 50 65 70 30 65 70 30 65 65
TYPE OF
TABLE 4.
Summary of the character of regrowth made by June 10, 1948, on 6778 saaebrush plants wh,ich were sprayed ‘by airplane”with sodium salt of
.2,4-D
on May 26-29, 1947. Percentage regrowth as expressed as a percentage of original foliage cover.REQROWTH BY PERCENTAGE CLASSES
REQROWTH
I
o-10 11-20'2L-30~31-40~41-50~"~i 2 I I
--- --~_
Pd. Pet. Pet. Pet. Pet. Pet. Pet.
Root sprouts only-
old stems dead. . 12.9 4.0 1.6 .4 .4 .4 19.7
Live regrowth on old
stems. . .8 1.0 .6 .4 .3 1.6 4.7
pounds of butyl ester per acre on April 19, 1948, became completely defoliated within four weeks and then produced abnormal adventitious shoots on June 29, 1948. These shoots were probably produced as the result of over 6 inches of precipitation falling between June 21 and 29, 1948. The sprou+*s died and disap- peared during July. A study was made of the character of regrowth found in
PERCENTAGE OF PLANTS SEVERELY AFFECTED IN
1947 ON PERCENTAGE
OF PLANTS DEADON 6/10/48 pet. 78 73 26 - - -
over 75 percent of the plants showing regrowth was less than one-fifth the area occupied by the original plants before they were sprayed.
Efects of Rainfall on Sprayed Areas
SPRAYING 2,4-D BY AIRPLANE 51
Precaution
Care should be taken that spray is not accidentally applied or does not drift onto such susceptible plants as cotton, alfalfa, sweetclover, garden crops, orna- mental shrubs and trees, or other crops known to be injured by 2,4-D.
SUMMARY
Brush eradication studies conducted by the U. S. Southern Great Plains Field Station at Woodward, Okla., since 1937 have proved conclusively that removal by mowing of sand sagebrush from sandy native rangeland of the Southern Plains is an extremely effective range improvement practice. However, re- moval of the brush by mechanical means is slow and costly. The use of 2,4-D for the control of sand sagebrush and other noxious plants promised to over- come these objections; hence, a test was started to find a practical means of rapidly applying a relatively low-cost but effective chemical on large acreages thereby killing the brush and increasing the returns from the land. ’
Tests of 2,4-D in the form of esters and sodium salts were made by both air and ground equipment in May of 1947, and date-of-spraying tests were made semi-monthly throughout the sum- mer. The experiments were conducted on more than 1000 acres of sandy native rangeland in the Texas Panhandle and in northwestern Oklahoma. The study areas were representative of nearly 5,000,- 000 acres of similarly infested rangeland in the Southern Great Plains. Although sand sagebrush is the dominant shrub on these lands, other shrubs which are detrimental to the range include skunk- bush, sand plum, and shinnery oak: Precipitation in the region ranges from about 14 inches in eastern Colorado to about 25 inches in southwestern Okla- homa.
Of the brands and formulations of 2,4-D tested, the esters produced effect most rapidly. However, at one pound per acre, which was determined to be sufficient, both the salts and esters pro- duced nearly identical final kills. Al- though the esters were not tested ade- quately at rates lower than one pound, indications were that quantities less than one pound might be found to be satisfac- tory. Extensive tests made in 1948 should yield more conclusive information. A homemade preparation, consisting of 1
pound of pure 2,4-D acid, 0.5 pound of sodium carbonate, 4 gallons of water, and 1 gallon of diesel oil, has proved to be a cheap and effective solution when prop- erly applied. The addition of one gallon of diesel oil per acre increases the effec- tiveness of both ester and salt solutions.
Shinnery oak was not severely affected by any formulation of 2,4-D. Othkr hard-to-kill plants were listed, as were those plants easily killed by 2,4-D.
Semi-monthly sprayings made during 1947 indicated that sand sagebrush was most susceptible to 2,4-D in the early spring when it was growing rapidly. The month of May is considered the best time to spray sand sagebrush in the Southern Great Plains.
Three gallons of total fluid per acre were much more effective than one gallon as a carrier for the ester solutions. The suggested minimum quantity of material for the application of 2,4-D is 3 gallons per acre when using esters and 5 gallons per acre when using sodium salt.
Flight spacings of 30 and 45 feet proved superior to wider spacings. The width of the boom on the plane was 30 feet; therefore, a spacing not more than one and one-half times the width of the boom should be considered maximum.
52 E. H. McILVAIN AND D. A. SAVAGE
used. However, manv of the sprouts die LITERATURE CITED
and disappear. About 20 percent of the (I) KEPHART, L. W., AND EVANS, L. S. 1948. plants sprayed with sodium salt of 2,4-D Killing weeds with 2,4-D. Plant Industry, Beltsville, Bureau of Maryland. at one pound per acre in 1947 produced 20 pp. (Processed)
root sprouts by June of 1948. Many of (5’) SAVAGE, D. A., HARLAN, JACK R., BROWN, these sprouts were still dying at that Mechanical and chemical control of range ALRERT L., AND MCILVAIN, E. H. 1948.
time. brush and weeds. Southern Great Plains
Rain falling within a few hours after Field Station, Woodward, Oklahoma. ester solutions and within 12 hours after (3) THORTON, BRUCE J. 1947. The use of 5 pp. (Mimeo.)
salt solutions have been applied may reduce or nullify effects of the treatments. Adequate precautions must be taken to
2,4-D in weed control. Colorado Agri- cultural Experiment Station. Miscl. Series Paper No. 371. 11 pp. (Mimeo.)
(4) TIMMONS, F. L. 1948. Controlling weeds with 2,4-D in the southern great plains. Bureau of Plant Industry, Hays, Kansas. 13 pp. (Mimeo.)
insure against accidental application or
Methods of Determining
Utilization
of Range
Forage
HAROLD F. HEADY
Agricultural and Mechanical College of Texas, College Station, Texas
A
CCORDING to the Society of American Foresters (1944) “uti- lization” is the degree to which animals have removed the current growth of herbage and is expressed in percentage of the growth within reach of livestock. The units of measurement, as percentage of weight or height, are not mentioned. The concept may be applied to a single plant or species, to a group of plants or species, or to the whole of a range area. This article is primarily concerned with the measurement of utilization. How- ever, a few comments on the interpreta- tion and standards of proper 1 use aregiven. Sustained production of forage plants is dependent for the most part on a moderate degree of cropping and tram- pling each year. Measurement,. interpre- tation, and control of the use of forage plants is one of the most important phases of range management.
No doubt utilization has been es- timated by stock raisers since man began controlling livestock. The oldtime west- ern stockman judged how near his feed was fully used or how many more days of grazing he could get from a particular pasture. These estimates were merely ocular and were influenced greatly by the man’s judgment and experience. No doubt many of the estimates were ac- curate. However, lack of knowledge of how much grazing a range could with- stand was a contributing factor to wide- spread range depletion.
Probably the first organized attempt to control utilization was by U. S. Forest Service officials. They believed that 15 to 20 percent of the volume of herbage
should remain if the forage production was to be maintained. In 1926, Samp-’ son and Malmsten made the statement: “It is generally conceded that if from 10 to 25 percent of the herbage of the more important palatable species remains in the fall, proper utilization has been affected.” Others applied the same per- centages on a strictly height basis. Several authors in recent years (Lom- masson and Jensen, 1938; Crafts, 1938; Parker and Glendening, 1942 ; ’ Costello
and Turner, 1944) have shown that most of the volume of grass herbage is produced in the lower few inches of the plants and that grazing to a certain percentage of the height may result in either under, proper, or over utilization depending upon the climate, site, or plant species. Some held the belief that 20 percent of the seed stalks should remain ungrazed on short- grass ranges (Costello and Turner, 1944) and 25 per cent on southwestern ranges (Parker and Glendening , 1942a). The U. S. Forest Service in its revised codes in 1936 required that 10 to 25 percent of the palatable vegetation be left at the end of the grazing season and approximately 25 percent of the seed heads be allowed to reach maturity. A few range men thought that height and volume were analogous and that it made little dif- ference whether the percentages referred to height or weight. This idea has proven fallacious.
54 HAROLD F. HEADY
such terms as proper use, resistance level, and use factor came into use. No at- tempt is made here to clarify that ter- minology.
METHODS BASED ON ESTIMATES
General reconnaissance
In the general reconnaissance method the inspector looks over a range area in more or less detail and makes an estimate of utilization. This may be one estimate which covers the entire area or it may be an average of estimates on small areas or by individual species. However, no plots are taken nor are individual plants meas- ured. The estimates may be of the percentage of height or volume removed or both or it may be in general terms such as light, moderate, or heavy utilization. The accuracy of the estimates depends largely upon the experience and judg- ment of the inspector. It has been shown (Smith, 1944) that estimates of density vary between individuals and for one individual between days and within the same day. Presumably estimates of use would vary in somewhat the same manner.
Several variations or refinements of the reconnaissance method have been devised. For example, Pechanec and Pickford (1937) describe a weight es- timate method to determine range pro- duction in which they were able to appraise very closely the actual mean herbage weights of the important species and to calculate stocking rates by this method more closely than with other methods. Presumably then the estima- tion of weight remaining after grazing could be accomplished with similar ac- curacy.
Ocular estimate by plot
The ocular estimate by plot method is a refinement of the general reconnaissance method and was developed on the U. S.
Sheep Experiment Station in 1933. Ac- cording to Pechanec and Pickford (1937a) : “It differs from the general
reconnaissance method in that each es- timate is made on a plot of such limited area that the entire plot is clearly visible from one point, and percentage utilization is the average of estimates from a series of plots selected at random. As with the general reconnaissance method, percen- tage utilization of height, volume, or weight is estimated. By confining ob- servations to smaller areas, adequately replicated, rather consistent results be- tween individual workers have been obtained.” In addition to the replication obtained when small plots are used, Stapledon (1931) has shown experimen- tally that small plots concentrate your efforts on small areas and thus make your estimates more intensive.
Ocular estimate by average of plants This method is a refinement, by Pechanec and Pickford (1937), of the ocular estimate by plot method. The percentage removal of weight is estimated for each plant within the plot and the average of the estimates is taken as per- centage utilization for the plot. After comparison with the volume-by-weight, stem count, and ocular-estimate-by-plot methods, Pechanec and Pickford (1937a) prefer this method because of its relative freedom from personal error and its high correlation with volume of forage re- moved. The method is sufficiently rapid so that numerous replications can be made. It was designed for plants with a bunch growth-habit.
Primary forage plant
DETERMINING UTILIZATION OF RANGE FORAGE 55
information about each of the main species and also be based upon all the forage plants which carry the principal noticeable features of management and load of grazing on a range area. Briefly use. These figures were then multiplied described are other factors which in- by the percentage composition of each fluence use, such as composition of the species in the stand and the products vegetation, abundance and vigor of totaled. The percentage composition plants, mortality of reproduction, poison- was also multiplied by the palatability, ous plants, soil erosion conditions, topog- or the percent of the species that will raphy, water, rodent infestation, fires, be eaten under proper range management, and season of use. After considering all and the products totaled. The two sums factors, an area is then assigned to one of were then divided to obtain the percent nine described classes of degree of use, utilization of the forage available under
as follows : proper use.
1.
2. 3. 4.
5.
6.
7.
8.
9.
Unused.
Slight. Casual grazing only. Light. Best plants “topped.”
Moderate. Choice plants fully used; poor plants unused.
Proper. Primary forage plants correctly used; grazing as uniform over most of area as natural features will allow.
Close. Some repetition of grazing; slight use of low value plants.
Severe. Hedged or mown appearance; choice and good forage plants injuriously used; low value plants carrying much of grazing load.
Extreme. “Stripped” appearance with close use of low value plants.’
Destructive. Range appears “grubbed;” some death loss of primary forage plants; active soil movement; low value plants closely and universally used.
A sufficient number of observations are made within an administrative unit to afford a picture of what is happening to the whole area under existing conditions of use. To give an opportunity for subsequent examinations for comparative purposes, the location of each observation station is described and plotted on a map. These map locations also show diagram- matically the approximate portions of the unit subjected to different degrees of grazing use, which gives a key to where corrective management adjustments are necessary.
tion be estimated separately for several Lantow (1939) suggested that utiliza-
Beruldsen and Morgan (1934) in Aus- tralia used a method of determining percentage utilization which necessitates two clippings of the forage. Briefly the authors clipped 25 and 35 well-dis- tributed random samples before graz,ing and after grazing, respectively. Grazing was done by sufficient numbers of sheep on small pastures so that only one day elapsed between the clippings. Growth of the pasture plants, therefore, was not a factor. Presumably the difference in air- dry weight between the two clippings, or the percentage of volume reduction, was the percentage of forage utilized by the animals. Further, the clinnings were I Utilixation by comparison of range with
standard photographs
Hormay and Fausett (1942) described a method of judging range utilization of annual-type ranges in California which is based on standard photographs. In this method the object is to match the range against a set of photographs to determine degree of use. Other points considered in making a decision include litter, stubble height, use of poor species, visi- bility of rocks, hoofprints, squirrel mounds, bare soil, and erosion.
METHODS BASED ON MEASUREMENTS
56 HAROLD F. HEADY
separated by species so that preferential over several weeks and the grasses differences between the species were also respond well after close cutting, forage determined. If enclosures are used, production and forage utilization may clippings on the grazed and ungrazed be determined by 2-week periods by a plots may be made after grazing. When
grazing continues over a period of several days or more, the procedure must include enclosures because growth of the forage plants become a factor.
The method possesses two very desir- able features-simplicity and reduction of personal error. However, the necessity of a fenced area or a mature vegetation prohibits its use on most range land ex- cept for experimental studies. The he- terogeneity of range vegetation and the variations in use would necessitate a large number of plots to attain sufficient accuracy for changing management. The method has little promise on the millions of acres of range land but is well adapted to a short grazing period on small pastures.
Cassady (1941) suggests a modification of the weight method for determining . utilization on sheep range. A predeter- mined number of units (one twig, one stem, one leaf, or some other distinctive plant part) is collected and weighed im- mediately before and another group immediately after grazing. The dif- ference in weights is used to determine percentage utilization. The units col- lected must be by randomized technique and the weighings should not be more than a few hours apart; otherwise dif- ferences in moisture content and growth will cause errors in determinations. From tests not described, the author claims accuracy without undue expense. There was close agreement between re- sults for two years, but differences be- tween the actual utilization and the. proper use factors were great for many species.
When the soil moisture and grass species are such that growth continues
method suggested by a Joint Committee of the Am. Sot. of Agronomy, Am. Dairy SC. Association, and the Am. Sot. of Animal Production (1943). In this method a series of 2 one-meter square enclosure cages are placed at random in each pasture. A third square meter, unprotected, plot is located within 10 feet of the enclosures, that had as near as possible the same density and growth of vegetation as that in the enclosure. These plots are clipped at 2-week in- tervals and moved to new locations. The total of the calculated differences of the dry weight of forage produced on these paired plots should closely approxi- mate the quantity of herbage eaten by the grazing animals. Similar methods have given good results in pasture studies in the midwest (Fuelleman and Burlison, 1939; Van Doren, et al., 1940; and Gard,
et al., 1943). Klingman, Miles, and Mott
(1943) show statistically that the caged units should be located at random but the unprotected plot should be selected for its likeness to the first to give the most accurate results.
The following is a summary of treat- ment for each set of 3 one-meter square plots :
Treatment Beginning of During End of period period period
A Clipped Protected Clipped B None Protected Clipped C None None Clipped
DETERMINING UTILIZATION OF RANGE FORAGE 57
Height measurements
According to Pechanec and Pickford (1937a) the height measurement method is based on the premise that percentage utilization of grass is equal to the reduc- tion in average leaf height as a result of grazing. Enclosures are necessary if grazing occurs for any considerable length of time during the period of rapid growth of the grasses. When grazing is com- pleted, the difference in average leaf heights of the grazed and ungrazed areas is considered the removed portion and is used to calculate percentage utilization. If the grasses are mature or growth is negligible, differences in leaf height be- fore and after grazing or of grazed and ungrazed plants may be used for the calculation of percentage utilization. Due regard must be given the different degrees of use of different species and the percentage composition of various species in the stand. Collecting the data may involve the use of either plots or transects. Two variations of the height measure- ment method based on stubble height follow :
Canfield (1944) measured stubble heights and diameters along a 50- or lOO-foot line transect and then arranged the data according to species and stubble height classes. The measurements along the line were converted to percentages so that the final summary sheet shows the part of the stand contributed by each species, the proportion of each species in each stubble height class, and weighted mean-use by stubble height classes. The costs and results from this method were not greatly different from other methods of intensive utilization surveys. It is hardly applicable to other than ex- perimental areas.
Canfield (1944a) described a method developed at the Southwestern Forest and Range Experiment Station which is based on the premise that the percentage
of the grass stand grazed closer than a two-inch stubble height is proportional to the percentage grazed to a height above two inches and to the ungrazed portion. The percentage grazed to two inches or less may be estimated or counted de- pending upon the desired accuracy and experience of the inspector. After this percentage is determined the other two percentages are read from a graph. The authors claim accuracy to within 10 per cent even by untrained personnel, and that it is a speedy one-man method. A chart or graph must be constructed for each area or new grass type. Details were given for the construction of the graph in an earlier publication (Canfield, 1942).
Conversions of stubble height to weight removed
Lommasson and Jensen (1938) were the first to correlate height removal with weight removal in range grasses. The leaves and culms of grass plants were held in place by first wrapping a string spirally around the plant from the base upward and then removing the herbage slightly above ground level. The entire plant was cut into l-inch segments which were dried and weighed. Percentage of the total weight was calculated for each l- inch interval of height. These authors found that each species had a more or less definite form if data were grouped according to overall 2-inch height classes of the plants. By a series of graphs and one-cycle semi-log paper the data were transformed onto sliding scales, similar to the Mannheim slide rule, whereby stubble height could be converted to percentage of weight removed. A detailed descrip- tion of the method of constructing the tables, sliding scales, and the field applica- tion is given by Lommasson and Jensen
58 HAROLD F. HEADY
Crafts (1938) initiated a study of the height-weight relationships in 11 impor- tant grasses in Arizona and New Mexico. He found, as did Lommasson and Jensen (1938), that the major portion of the weight was near the ground level. The accuracy of using height measurement to determine weights as influenced by en- vironmental factors was not studied. However, height-weight scales were pre- sented for blue grama (Bouteloua gracilis), sideoats grama (B. curtipendula), roth- rock grama (B. rothrockii), Arizona fescue (Fcstuca arizonica), mountain muhly (Muhlenbergia montana), curly mesquite (Hilaria belangeri), and tobosa (H. mu- tica). The data were for 2 to 20 in- dividual plants for one year. Individual species writeups following this method were given by Campbell and Crafts (1938) for black grama (Boutelouu erio- podu), by Crafts (193813) for blue grama, and another (Crafts, 1938a) for western wheatgrass (Agropyron smithii). These publications also include descriptions or guides to proper use of the plants for Southwest conditions. Crafts and Wall (1938) set forth certain definitions and concepts about proper use, utilization indicators, range types, soil, class of stock, when to judge use, utilization panels, and key species that are necessary in the use of height-weight scales. Such a statement of fundamentals is necessary in the successful use of any method that is to be followed year after year with various personnel.
Lommasson and Jensen (1942) tested their method and at the same time com- pared results with a weight estimate method. They concluded that the “form factor” or height-weight principle was sound and that more accurate and more uniform results could be obtained by the method than by ocular estimate, pro- vided proper instructions were given. Also that height alone could be used as
the variable for the determination of the required number of plants to be used in constructing height-weight tables.
Parker and Glendening (1942) sug- gested a modification in the field pro- cedure of the height-weight method to make it more applicable to mixed grass stands. All the important species were used rather than one to three “key species.” The percentage composition was determined by the number of plants recorded of each species in a transect of 100 observations. The percentage of proper use of the type was then cal- culated by using the actual use, percent- age composition, and the proper use factor. The method has limitations in that the composition is based on the num- ber of plants rather than the percentage of ground cover. This difference may be important in some types and not in others. The figures must be substan- tiated with observations on erosion, dis- tribution of livestock, forage production, and other indicators of range use or misuse.
The height-weight method, including several variations, necessitates linear measurements of both stubble height and ungrazed height, averaging ungrazed height, converting stubble height of each plant to percentage utilization, and averaging utilization. Valentine (1946) has scaled the percentages of utilization on a card which is placed by the side of a plant so that the stubble height indicates the percentage of weight that has been removed. The average ungrazed height still has to be calculated but the amount of calculations is greatly reduced in that linear stubble heights are not measured. Another advantage of this refinement is
‘that the examiner associates stubble
height with utilization because he sees both on each plant at the same time.
DETERMINING UTILIZATION OF RANGE FORAGE 59
is sufficiently constant between years, seasons, and sites to allow the use of height-weight tables with accuracy of plus or minus 5 per cent in the utilization determination. In fact, Lommasson and Jensen (1942) found that no member of a 6-man crew varied more than plus or minus 3.5 percent in his estimate of utilization when he used the height- weight method. However, the same crew varied from a plus 8 to a minus 7 percent in ocular estimates of the ut’iliza- tion. The standard was an actual weight comparison of the herbage removed by artificial grazing to that remaining.
Beid and Pickford (1941) compared the ocular-estimate-by-plot method with the height-weight method on green fescue range in the Wallowa mountains. The first method was described by Pechanec and Pickford (1937) and the height-weight relationships were deter- mined by using graphs by which stubble height was converted to percentage of weight removed. Both met,hods gave substantially the same estimate of the degree of utilization when the stubble height was quite uniform. The stubble height method gave low estimates when use was ragged or uneven. About the same number of observations or plots were required in both methods but the increased speed in the ocular method led them to recommend it as the best met)hod available for field use.
Not all workers have found the form factor principle to be fundamentally sound. Clark (1945) in 4 years of work in the oakbrush, aspen-fir and spruce-fir zones of Utah found that composite samples of all years and all zones would in many instances show errors of 10 to 25 percent when average height-weight tables were used. The study was con- cerned with 10 species and the data showed variations between samples from different years, from different elevational
zones, and from different sites. Each of the 10 species exhibited its own variation in growth form as a result of differences in such factors as soil, exposure, shading, moisture conditions, and temperature. Clark found that the grasses conformed more nearly to a single pattern and had greatest variability in height in favorable years, and that there was less difference in growth form between zones in one year than in one zone between years. The conclusion was reached from field tri- als that the ocular-estimate-by-plot method is more accurate and more suit- able for estimating degree of forage utilization than the height-weight method.
Collins and Hurtt (1943) after testing the available methods for determining utilization, used a stubble height method in which the remaining height of grazed plants, a tally of grazed and ungrazed plants, and certain other information were recorded. The work was done with 3 key species on shortgrass range at Miles City, Montana. From the data, average stubble height and percentage of grazed plants were calculated. By means of height-weight curves, average stubble height was converted to percentage of use. The percentage of use multiplied by the percentage of all stems that had been grazed gave the total percent to which the species had been removed. Species like western wheatgrass may be either culmed or culmless and the ratio between the two types varied greatly from year to year. The height-weight curves were constructed each year from weight data of culmed and culmless plants in the same proportion as they occurred in the pastures. Plants with growth habits different than western wheatgrass required variations in the procedure.
60 HAROLD F. HEADY
grazed portion rather than the grazed portion. Furthermore no direct method of measuring utilization has been devised. Collins and Hurtt (1943) state that dif- ferences in degree of use show a close relationship with calf gains under 3 dif- ferent intensities of grazing. Intensive use of this method at Miles City revealed differences in utilization too slight to be noticed by ocular estimation.
Results obtained by various workers have contributed much to the knowledge of height-weight relationships. How- ever, the results have not been consistent. Yet, this method has more promise than any developed so far because it is based on sound experimental procedure.
Stem count
Stoddard (1935) used the stem-count method in which he showed that percent- age utilization was a direct function of the total number of stems grazed. The work was done with western wheatgrass. The method required a count of grazed and ungrazed stems from a randomized plot or transect procedure. ‘It is a simple method with little error resulting from personal or procedural causes. If proper grazing is attained when 80 percent of the stems have been grazed it is a simple calculation to determine whether use has been under, proper, or over. Pechanec (1936) tested this method with thickspike wheatgrass (Agro- pyron dasystachyum) at Dubois, Idaho, and found it insufficiently accurate to
‘merit its use. The percentage utilization
by the stem-count method was found to be consistently higher than when percent- age utilization was based on the volume of forage removed. The difference was due largely to the fact that all the stems. grazed .were not completely grazed. The error was greater with light grazing than with heavy grazing.
SPECIAL PROBLEMS WITH BROWSE AND WEED SPECIES
The problems of determining the utilization of woody species are much different than with grasses because of the growth habit of browse species. Hormay (1943) in his work with bitterbrush in California found he could get percentage utilization by (1) multiplying the area of each plant crown by the average es- timated ungrazed twig growth of each plant and add the results for all plants on the plot; (2) multiplying the products of each plant in step one by the estimated percentage utilization of the twig growth of each plant and add all the results for the plants on the plot; and (3) divide the sum in step two by the sum in step one and multiply by 100 to obtain the per- centage utilization.