Open Access
Proceedings
The role of heritability in mapping expression quantitative trait loci
Song Huang
1, David Ballard
1and Hongyu Zhao*
2,3Address: 1Program of Computational Biology and Bioinformatics, Yale University, New Haven, Connecticut 06520, USA, 2Department of Epidemiology and Public Health, Yale University, New Haven, Connecticut 06520, USA and 3Department of Genetics, Yale University, New Haven, Connecticut 06520, USA
Email: Song Huang - [email protected]; David Ballard - [email protected]; Hongyu Zhao* - [email protected] * Corresponding author
Abstract
Gene expression, as a heritable complex trait, has recently been used in many genome-wide linkage studies. The estimated overall heritability of each trait may be considered as evidence of a genetic contribution to the total phenotypic variation, which implies the possibility of mapping genome regions responsible for the gene expression variation via linkage analysis. However, heritability has been found to be an inconsistent predictor of significant linkage signals. To investigate this issue in human studies, we performed genome-wide linkage analysis on the 3554 gene expression traits of 194 Centre d'Etude du Polymorphisme Humain individuals provided by Genetic Analysis Workshop 15. Out of the 422 expression traits with significant linkage signals identified (LOD > 5.3), 89 traits have low estimated heritability (h2 < 10%), among which 23 traits have an estimated heritability equal to 0. The linkage analysis on individual pedigree shows that the overall LOD scores may result from a few pedigrees with strong linkage signals. Screening gene expressions before linkage analysis using a relatively low heritability (h2 < 20%) may result in a loss of significant linkage signals, especially for trans-acting expression quantitative trait loci (49%).
Background
Gene expression has been studied as heritable and com-plex traits in genetic linkage studies [1]. To dissect such traits, a fundamental question is what proportion of the variation of the gene expression can be attributed to genetic factors. Broad heritability, the proportion of a phenotypic variation explained by genetic factors, can be estimated to address this question, especially for selecting traits of interest before mapping [2]. Evidence for a signif-icant heritable component of expression traits has been found in heritability studies on humans [3,4], yeast [5]
and mice [3]. Various aspects of heritability in gene expression were systematically reviewed by Stamatoyan-nopoulos and about 10% to 50% of transcripts' between-individual variation was found to be heritable differences [6]. Most recently, Petretto et al. studied the influence of heritability on the detection of cis- and trans-acting expres-sion quantitative trait loci (eQTLs) using the BHX/HXB panel of rat recombinant inbred strains in a tissue specific context [7] and concluded that heritability alone is not a reliable predictor of whether an eQTL will be detected for an expression trait. However, compared to the rat crosses
from Genetic Analysis Workshop 15
St. Pete Beach, Florida, USA. 11–15 November 2006
Published: 18 December 2007
BMC Proceedings 2007, 1(Suppl 1):S86
<supplement> <title> <p>Genetic Analysis Workshop 15: Gene Expression Analysis and Approaches to Detecting Multiple Functional Loci</p> </title> <editor>Heather J Cordell, Mariza de Andrade, Marie-Claude Babron, Christopher W Bartlett, Joseph Beyene, Heike Bickeböller, Robert Culverhouse, Adrienne Cupples, E Warwick Daw, Josée Dupuis, Catherine T Falk, Saurabh Ghosh, Katrina A Goddard, Ellen L Goode, Elizabeth R Hauser, Lisa J Martin, Maria Martinez, Kari E North, Nancy L Saccone, Silke Schmidt, William Tapper, Duncan Thomas, David Tritchler, Veronica J Vieland, Ellen M Wijsman, Marsha A Wilcox, John S Witte, Qiong Yang, Andreas Ziegler, Laura Almasy and Jean W MacCluer</editor> <note>Proceedings</note> <url>http://www.biomedcentral.com/content/pdf/1753-6561-1-S1-info.pdf</url> </supplement>
This article is available from: http://www.biomedcentral.com/1753-6561/1/S1/S86
© 2007 Huang et al; licensee BioMed Central Ltd.
in inbred lines, human samples may have more experi-mental variability due to cell line handling and more extreme allele frequencies at the loci of interest. Thus, whether a similar conclusion can be drawn for human samples deserves further investigation. Using data for the 14 Centre d'Etude du Polymorphisme Humain (CEPH) Utah families provided by Genetic Analysis Workshop 15 (GAW15), we explored the relationship between the her-itability of a gene's expression level and the power to iden-tify regions regulating its expression. We also investigated the contributions from each individual family [8].
Methods
Data setWe used 3554 expression profile traits together with marker data on 2819 autosomal single-nucleotide poly-morphisms (SNPs) from the 14 CEPH families, consisting of 194 individuals, provided by GAW15. Sex-specific Rut-ger's genetic maps were provided by Sung et al. [9].
Heritability estimates and genome-wide linkage analysis
To study the relationship between the heritability of a gene expression and the detection of eQTLs, we estimated narrow-sense trait heritability assuming no dominance effect using the standard variance-component model [10]. Genome-wide linkage analysis was conducted using MER-LIN-REGRESS and MERLIN variance-components method without covariate adjustment [10,11]. The esti-mated heritability of each expression trait, sample mean, and variance from all 14 pedigrees were used as popula-tion trait distribupopula-tion parameter estimators in the linkage analysis with MERLIN-REGRESS. The error-checking algo-rithm implemented in MERLIN was applied before link-age analysis was conducted.
To study whether heritability can be a reliable predictor for linkage signals, we selected gene expression traits that show linkage signal but with low heritability estimates. We applied permutation procedures to examine whether the observed linkage signals are false signals. To adjust for multiple comparisons, the observed genome-wide maxi-mum LOD score for a gene expression was compared to the genome-wide maximum LOD score for the gene expression from a permuted sample. The p-value is the number of times that the genome-wide maximum LOD score from permuted data is greater or equal to the observed genome-wide maximum LOD score out of 1000 permutations. To preserve pedigree structures, permuta-tions were performed within each pedigree.
Results
Genome-wide linkage analysis
LOD > 5.3 was used as the significance threshold (corre-sponding to a point-wise p-value < 3.9 × 10⁻⁷, and a
genome-wide p-value = 0.001) as in [8]. We identified 422
gene expressions with significant linkage signals, 25 of which have h2 > 50%. A positive correlation (0.68) was
observed between the heritability estimates and the LOD scores for these 25 gene expressions. However, this corre-lation dropped to 0.12 when all 3554 gene expressions were considered. Moreover, among the 880 gene expres-sions that have h2 < 10%, 89 have significant linkage
sig-nals, including 23 traits with an estimated heritability of 0 (Fig. 1).
Heritability as predictor for linkage analysis
We broadly defined the eQTLs that locate on the same chromosome as the mapped gene expressions as cis-acting eQTLs, and trans-acting eQTLs otherwise. Therein, 422 gene expressions with linkage signals were grouped into a
cis-acting group of 49 expressions and a trans-acting group of 373 expressions. Ten percent of the cis-acting gene expressions and 23% of the trans-acting gene expressions had an estimated heritability less than 10%. For gene expression in the cis-acting group, the estimated heritabil-ity has a mean of 0.35, which is higher than the 0.22 mean of the trans-acting group. If we screened gene expressions using h2 > 20% as the first step before linkage analysis, 183
out of the 373 (49%) gene expressions with trans-acting eQTLs and 13 out of the 49 (27%) gene expressions with
cis-acting eQTLs would be excluded at the screening stage (Fig. 2). Permutation analysis on gene expressions with the bottom five heritability estimates (all with h2 = 0)
among the 422 gene expression with linkage signals
indi-Genome-wide maximum LOD scores vs. heritability esti-mates
Figure 1
cated that the observed linkage signals are not false posi-tives at the 0.05 significance level (Table 1).
Between-pedigree and within-pedigree variation
Based on the heritability estimation, we separated out 89 gene expressions with significant linkage signals but that have h2 < 10%. We further assessed the contribution of
each pedigree to the LOD score of the selected 89 gene expressions through the regression-based linkage analysis, where population trait mean, variance, and heritability estimations obtained from all 14 pedigrees were used. We found that 72 out of the 89 selected gene expressions had at least one pedigree contributing a LOD score greater than one (Table 2). This suggests that some pedigrees con-tribute to the overall significance and explains why high LOD scores were observed for these gene expressions with low heritability estimates.
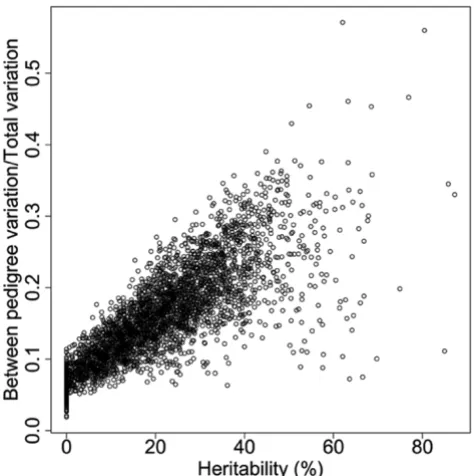
We also separated out 25 gene expressions with significant linkage signals but that have h2 > 50%, and further studied
the heritability difference between the two groups. We cal-culated the ratio of between-pedigree variation to the total variation, defined as the sum of between-pedigree varia-tion and within-pedigree variavaria-tion, and compared it to the heritability estimation (Fig. 3). A mean ratio of 0.09 was found for the group with h2 < 10% (89 gene
expres-sions), and a mean ratio of 0.30 for the group with h2 >
50% (25 gene expressions). For all 3554 gene expressions, the mean ratio is 0.09 for the 880 gene expressions with
h2 < 10%, and 0.25 for the 108 gene expressions with h2 >
50%. The heritability difference between these two groups suggests that the within-pedigree variation (e.g., environ-mental variance), may affect the heritability estimation more than the between-pedigree variation [12]. Therefore, heritability estimates without appropriate considerations of potential environmental contributors may lead to biased estimates of genetic contribution to a complex trait.
Discussion
In this study, we have investigated the relationship between the estimated heritability of gene expression
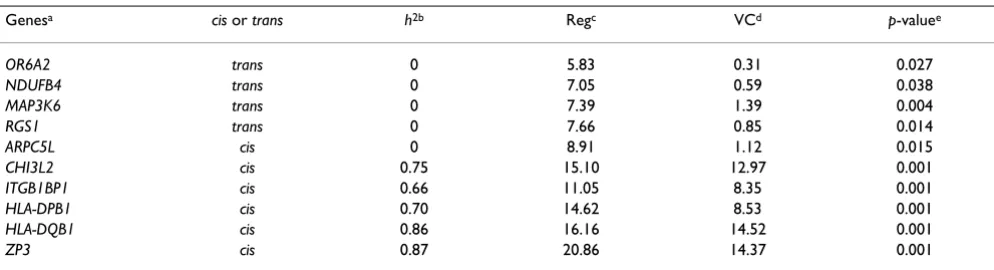
Table 1: Linkage analysis with all 14 pedigrees
Genesa cis or trans h2b Regc VCd p-valuee
OR6A2 trans 0 5.83 0.31 0.027
NDUFB4 trans 0 7.05 0.59 0.038
MAP3K6 trans 0 7.39 1.39 0.004
RGS1 trans 0 7.66 0.85 0.014
ARPC5L cis 0 8.91 1.12 0.015
CHI3L2 cis 0.75 15.10 12.97 0.001
ITGB1BP1 cis 0.66 11.05 8.35 0.001
HLA-DPB1 cis 0.70 14.62 8.53 0.001
HLA-DQB1 cis 0.86 16.16 14.52 0.001
ZP3 cis 0.87 20.86 14.37 0.001
aFrom the 23 genes with heritability estimates equal to 0, five genes with the highest MERLIN-REGRESS LOD scores are shown in the top five rows;
from 422 genes with significant MERLIN-REGRESS LOD scores, five genes with the highest heritability estimates are shown on the bottom five rows as a comparison.
b The trait heritability estimations.
c The genome-wide maximum LOD scores obtained from MERLIN-REGRESS method.
d The genome-wide maximum LOD scores obtained from MERLIN variance component method. ep-value from the permutation procedures.
The proportion of traits with significant eQTL(LOD > 5.3) excluded if filtered by heritability
Figure 2
traits and the corresponding linkage signals using the CEPH population data provided by GAW15 Problem 1. This was motivated by a recent study using heritability as a filter for traits selection before conducting linkage anal-ysis in a rat cross [7]. The rationale for this filtering is that the estimated heritability may be a good indicator of the statistical power to detect significant linkage regions for complex traits. The highly heritable traits may have more genetic effect contributing to their total phenotypic
vari-ance, hence significant linkage regions tend to be detected more easily. However, we found 89 expression traits with significant linkage signals that actually have small esti-mated heritability (h2 < 10%). Among the 89 expression
traits, 23 of them have estimated heritability of 0. Our study suggests that significant genome regions can be identified even for genes with low heritability estimates, indicating that heritability may not be a reliable predictor for linkage mapping results. A significant portion of eQTLs may be filtered out by a relatively low heritability cut-off, especially for trans-acting eQTLs (49%). Based on our analysis, we also found that in general, MERLIN-REGRESS gave a higher genome-wide maximum LOD score compared to the MERLIN variance-component method (Table 1), although a positive correlation (0.60) exists between the results from the two methods. How-ever, for the subset of genes chosen in Tables 1 and 2, we did not observe any obvious potential influential factors, e.g., outliers, that cause the difference in results.
The results from linkage analysis on individual pedigrees indicate that a significant LOD score may result from a few individual pedigrees with strong linkage signals on gene expression traits with an overall low trait heritability esti-mation, i.e., the proportion of between pedigree variation to the total variation is small, while the linkage analysis is not affected by between pedigree variation.
Conclusion
Highly heritable genes have a greater proportion of phe-notypic variation explained by genetic effects and tend to have genomic regions showing significant linkage scores. However, some genes with low heritability also show high linkage scores, indicating that heritability is not a consist-ent predictor of eQTL mapping. Caution should be taken
Comparison of the estimated heritability and the ratios of between pedigree variation versus total variation for 3554 genes (correlation = 0.81)
Figure 3
Comparison of the estimated heritability and the ratios of between pedigree variation versus total variation for 3554 genes (correlation = 0.81).
Table 2: Linkage analysis on each individual pedigree
Genome-wide maximum LOD score obtained from MERLIN-REGRESS by Pedigreeb
Genea 1333 1340 1341 1345 1346 1347 1362 1408 1416 1418 1421 1423 1424 1454
OR6A2 0 0 0.29 0 0.11 0.56 0 0 0.18 0.21 1.33c 0 0.47 0
NDUFB4 0.07 0.36 0 0 0 0.37 0.08 0.04 0.06 0.33 3.08 0 0 1.13
MAP3K6 0.05 1.56 0.13 0 0 0 1.03 0 0.66 0.13 0 0 0.55 0.12
RGS1 0 0.14 2.87 0 0.69 0.29 0.21 0 0 0.86 0 0 0.05 0.14
ARPC5L 0 0.01 3.81 1.14 0.14 0.02 0 0.25 0.19 1.11 0 0 0 0
CHI3L2 1.15 0.49 2.78 4.52 0 2.21 0.03 0.27 2.06 1.95 0.05 0.30 0.79 0
ITGB1BP1 4.75 0.02 0 0.32 2.59 0 0.10 0 0 0.08 0 2.60 0.46 0.22
HLA-DPB1 0.08 0.13 0.07 0 0.77 1.15 1.03 0.30 1.99 0 0.69 0 0.40 1.51 HLA-DQB1 0 0 0.11 1.18 0.22 0 0.11 0.18 0.33 0 0.60 0.79 0.22 0.36
ZP3 0.29 0.8 0.01 0.21 0 0.39 0.14 0.78 4.72 0 0 1.50 3.53 1.82
a Genes were selected as in Table 1.
b The same SNP that mapped to the genome-wide maximum LOD score for each gene expression with all 14 pedigrees was used in linkage analysis
on each individual pedigree
Publish with BioMed Central and every scientist can read your work free of charge "BioMed Central will be the most significant development for disseminating the results of biomedical researc h in our lifetime."
Sir Paul Nurse, Cancer Research UK
Your research papers will be:
available free of charge to the entire biomedical community
peer reviewed and published immediately upon acceptance
cited in PubMed and archived on PubMed Central
yours — you keep the copyright
Submit your manuscript here:
http://www.biomedcentral.com/info/publishing_adv.asp
BioMedcentral
if we use inferred heritability as a filter of genes to conduct genome-wide linkage analysis.
Competing interests
The author(s) declare that they have no competing inter-ests.
Acknowledgements
This research was supported in part by NIH grant GM 59507. DB was sup-ported by the NIH Institutional Training Grant for Informatics Research.
This article has been published as part of BMC Proceedings Volume 1 Sup-plement 1, 2007: Genetic Analysis Workshop 15: Gene Expression Analysis and Approaches to Detecting Multiple Functional Loci. The full contents of the supplement are available online at http://www.biomedcentral.com/ 1753-6561/1?issue=S1.
References
1. Gibson G, Weir B: The quantitative genetics of transcription. Trends Genet 2005, 21:616-623.
2. Chesler EJ, Lu L, Shou S, Qu Y, Gu J, Wang J, Hsu HC, Mountz JD, Baldwin NE, Langston MA, Threadgill DW, Manly KF, Williams RW:
Complex trait analysis of gene expression uncovers poly-genic and pleiotropic networks that modulate nervous sys-tem function. Nat Genet 2005, 37:233-242.
3. Schadt EE, Monks SA, Drake TA, Lusis AJ, Che N, Colinayo V, Ruff TG, Milligan SB, Lamb JR, Cavet G, Linsley PS, Mao M, Stoughton RB, Friend SH: Genetics of gene expression surveyed in maize, mouse and man. Nature 2003, 422:297-302.
4. Cheung VG, Conlin LK, Weber TM, Arcaro M, Jen KY, Morley M, Spielman RS: Natural variation in human gene expression assessed inlymphoblastoid cells. Nat Genet 2003, 33:422-425. 5. Brem RB, Yvert G, Clinton R, Kruglyak L: Genetic dissection of
transcriptional regulation in budding yeast. Science 2002,
296:752-755.
6. Stamatoyannopoulos JA: The genomics of gene expression. Genomics 2004, 84:449-457.
7. Petretto E, Mangion J, Dickens NJ, Cook SA, Kumaran MK, Lu H, Fischer J, Maatz H, Kren V, Pravenec M, Hubner N, Aitman TJ: Her-itability and tissue specificity of expression quantitative trait loci. PLoS Genet 2006, 2:e172.
8. Morley M, Molony CM, Weber TM, Devlin JL, Ewens KG, Spielman RS, Cheung VG: Genetic analysis of genome-wide variation in human gene expression. Nature 2004, 430:743-747.
9. Sung YJ, Di Y, Fu AQ, Rothstein JH, Sieh W, Tong L, Thompson EA, Wijsman EM: Comparison of multipoint linkage analyses for quantitative traits in the CEPH data: parametric LOD scores, variance components LOD scores, and Bayes factors. BMC Proc 2007, 1(Suppl 1):S93.
10. Abecasis GR, Cherny SS, Cookson WO, Cardon LR: Merlin – rapid analysis of dense genetic maps using sparse gene flow trees. Nat Genet 2002, 30:97-101.
11. Sham PC, Purcell S, Cherny SS, Abecasis GR: Powerful regression-based quantitative-trait linkage analysis of general pedi-grees. Am J Hum Genet 2002, 71:238-253.
12. Lynch M, Walsh B: Components of environmental variation. In