Study and analysis the BER performance of linear
multiuser detectors in non-Gaussian noise channel
Mohammed.H.Essai,
2 1Mohammed.M.Zahra,
3Mohammed.Anbar.Mohammed
Electrical and Electronics Engg, Al-Azhar University
1[email protected],2[email protected],3[email protected]
Abstract- In many wireless systems where multiuser detection techniques may be applied, The known linear multiuser detectors are designed for communication systems with additive white Gaussian noise(AWGN) assumption. In this regard, the question about the possibility and efficiency of their use in systems with non-Gaussian noise remains an open question. In the case of an external noise, there are no serious reasons for accurately determining its probability distributions. In this paper the performance analysis of many multiuser detectors in the presence of access interference, Gaussian, and non Gaussian noise in code-division multiple-access(CDMA) communication systems have been investigated. Simulation results show that the linear multiuser detector provide poor performance in the presence of non Gaussian noise than in AWGN.
Index Terms – multiuser detection, matched filter, decorrelating, MMSE, CDMA.
I. INTRODUCTION
During recent years multiuser detection techniques (MUD) have attracted significant attention to improve the performance of direct sequence code-division multiple-access (DS-CDMA) communications.. Multi-user detection algorithms mitigate structured multiple access interference in CDMA communication systems. A key assumption of these works has been the use of the Gaussian model for the ambient noise[1]. Unfortunately In many physical channels, such as wireless radio channels and underwater acoustic channels the ambient noise is known through experimental measurements to be decidedly non-Gaussian[2]. It is known in the single user context that the presence of impulsive noise can be harmful to the performance of conventional systems based on Gaussian assumption, whereas it can actually be useful to performance if appropriately modeled while In the context of multiple-access capability, this can be translated to the reduction of the user capacity. the bit error rate performance for linear multiuser detectors depend heavily on the shape of the ambient noise distribution. In this paper the performance of liner multiuser detectors using noise model that is known as ε-mixture or ε–contaminated Gaussian mixture model can be examined and analyzed. This model can model signals and noise or interference which is impulsive in nature.
The following sections of this paper, overview of noise models, System model, conventional detector, and linear multiuser detectors. The simulation model applied for this work is described. The BER performance results are presented. Finally, we conclude.
II. NOISE MODELS
The appearance of the noise and its effect is related to its characteristics. Noise signals can be either periodic in nature or random. Usually observed noise signals during signal transmission are random in nature resulting in abrupt local changes in the transmitting sequence. These noise signals cannot be adequately described in terms of the commonly used Gaussian noise model. the ambient noise is known through experimental measurements to be non-Gaussian due to the impulsive nature of man-made electromagnetic interference , such as car ignition systems and industrial machines in the vicinity of the signal receiver. and a great deal of natural noise as well, such as lightning in the atmosphere and ice cracking in the antarctic region which generate non-Gaussian, long-tailed type of noise.
Combined man-made and natural radio noise in analytical model serves following purposes [3]:
a) It provides a realistic and quantitative description Of man-made and natural electromagnetic (EM) Interferences, b) It guides experimental protocols for the measurement of such interferences,
c) It can be used to identify optimal communication systems and their performance comparison with the sub optimal systems.
A. Middleton's Model
This model has been used in telecommunications and other domains including underwater acoustics, radar, and optics. According to this model, the additive noise is classified into three broad categories, Class A, Class B and Class C. The distinction between the three models is based on the relative band-width of noise and receiver.
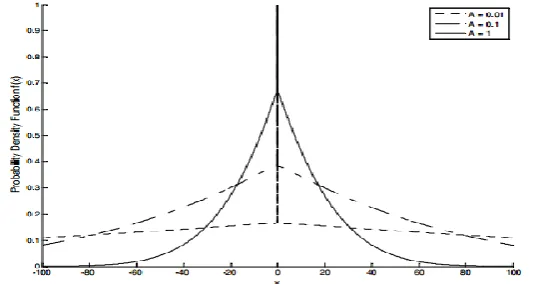
Class A: Narrowband Noise Interference Spectrum is narrower than the receiver bandwidth. Its probability density function (pdf), derived in [4], and is:
( ) ∑
√
( )
Class A model [5] is uniquely determined by the following two parameters:
,
is “overlap index”.It is the product of the average number of emissions events (mean impulse rate) impinging on the receiver per second and mean duration of a typical interfering source emission, and
[10-2, 1] in general.
A, is the ratio
G2/
2A, where
G2 is the intensity of the independent Gaussian component,
2Ais intensity of the impulsive non-Gaussian component, and
A [10-6, 1] in general.By increasing impulse index, , the noise can be made arbitrarily close to Gaussian and by decreasing it can be made arbitrarily close to a conventional Poisson process as shown in Figure 1[3].
Class B:Broadband Noise Interference Spectrum is wider than the receiver bandwidth.
Class B noise produce transients in the receiver. Although it can accurately model a broadband impulsive noise environment its practical applications are limited because of the complicated form of its PDF which has five parameters [5].
Class C: Mixed case: sum of Class A and Class B. In practice class C noise can often be approximated by Class B [5].
B. Symmetric Alpha Stable (S S) Model
Many authors have considered Symmetric Alpha Stable (S α S) model [6] as an approximation to Middleton Class B model. This approximation is particularly accurate for the case of narrowband reception without Gaussian component and the case of a symmetric PDF without a Gaussian component.
symmetric Stable (S S) distribution is best defined by its characteristic function:
( ) ( | | )
( ) Hence the following three parameters uniquely identify a (S S) distribution,
is the characteristic exponent and is a measure of the "thickness" of the tail of the distribution, where[0, 2]in general. is the localization parameter. It is the mean when 1
2 and the median when,0
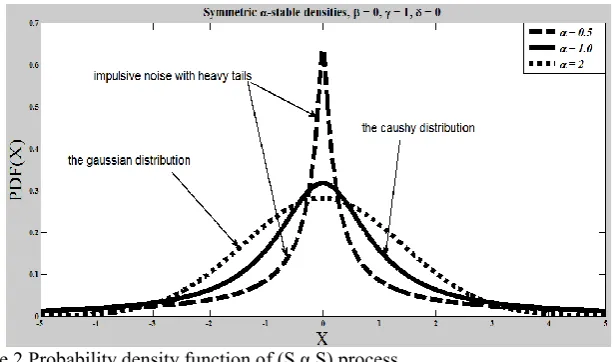
1, where ( , ) in general. is scale parameter or the dispersion and is similar to the variance of the Gaussian distribution, where 0 in general. The characteristic p nent α is the most important parameter of the (S α S) distribution and it determines the shape of the distribution. The standard(S S) density functions for a few values of the characteristic exponent are shown in Figure 2. By letting take the values 1 and 2 we get two important special cases of (S S) distribution, namely, the Cauchy ( ) , and the Gaussian ( )Unfortunately no closed form expressions exist for general ( ) distributions other than the Cauchy and the Gaussian. However power series expansions can be derived for ( ) in the following, we shall assume that all ( ) distributions are centered at the origin, i.e., this is equivalent to the zero-mean assumption for Gaussian distributions. Then, the standard (S S) density function is given by [7].
( )
{ ∑
( )
( )
. /
( )
∑
( )
( )
√ 0 1
( )
Although the (S S) density behaves approximately like a Gaussian density near the origin its tails decay at a lower rate than the Gaussian density tails. the smaller the characteristic exponent is the heavier the tails of the (S S) density. This implies that random variables following (S S) distributions with small characteristic exponents are highly impulsive. The heavy tail characteristic makes the (S S) densities appropriate for modeling signals and noise or interference which is impulsive in nature.
C. -mixture or –contaminated Gaussian mixture model
The most commonly used empirical model is the -mixture or –contaminated Gaussian mixture model in which the noise pdf has the form of:
( ) ( ) ( ) ( ) ( ) Where the following parameters identify the distribution,
, - is the mixture weighting coefficient. The mixing parameter regulates the contribution of the non-Gaussian component and usually it varies between 0,01 to 0,25.
( ) PDF is usually taken to be a Gaussian PDF representing background noise.
( ) Most often is taken to be Gaussian with variance taken to be many times the variance o . The ratio has generally been taken to be between 1 and 10,000.
The flexibility of the model allows for the approximation of many different naturally occurring noise distribution shapes. This approach has been used to model non-Gaussian measurement channels in narrowband interference suppression, a problem of considerable engineering interest [8].
A simple approximation to Middleton Class A Model and contaminated Gaussian mixture model can be formed by taking the PDF as,
( ) ( ) ( ) ( )
Where is the noise variance, with . Here, the term ( ) represents the nominal background noise, and the term ( )represents an impulsive component, with representing the probability that impulses occur. It is usually of interest to study the effects of variation in the shape of a distribution on the performance of the system by varying the parameters ε and with fixed total noise variance.
( ) ( ) This model serves as an approximation to the more fundamental Middleton Class A noise model [9], [10] and has been used extensively to model physical noise arising in radio and acoustic channels.
Figure 2 Probability density function of (S α S) process. III. SYSTEM MODEL
Consider a baseband digital DS-CDMA network operating with a coherent BPSK modulation format. The waveform received by a given terminal in such a network can be modeled as consisting of a set of superimposed modulated data signals observed in additive noise.
( ) ( ) ( ) ( )
Where ( ) and ( ) represent the useful signal and the ambient channel noise, respectively. The ambient noise is assumed to be non-Gaussian. The useful signal is comprised of the data signals of active users in the channel and can be written as
( ) ∑ ∑ ( ) ( ) ( )
For the direct-sequence spread-spectrum (DS-SS) multiple-access format the user spreading code are of the form,
( ) ∑ ( ) , - ( )
Where N is the processing gain, ( ) is a signature sequence of assigned to the and is a normalized chip waveform of duration , where .it has assumed that For simplicity.
consider the demodulation of the * ( )+
( ) ∑ ( ) ( ) ( ) , ( ) - ( ) IV. CONVENTIONAL SINGLE USER MATCHEDFILTER
The conventional detector correlates the received signal described in Eq (11) with the locally generated code in a separate detector branch. The outputs of the correlators are sampled at the bit times, which yield “soft” estimates of the transmitted data. The final data decisions are made according to the signs of the soft estimates, As shown in Figure 3 [11].
The conventional detector consists of a K bank of matched filters each matched to the signature waveforms of different users. The detector follows a single-user detector strategy; where each user is demodulated separately without taking into account to the existence of other (K-1) active users in the system. In other words, other users are considered as interference or noise [12].The exact knowledge of the users’ signature sequences and the signal timing is needed in order to implement this detector.
The received signal is processed by the matched filter or correlation and the decision statistic at the output of the k matched filter is given by,
∫ ( ) ( ) ( )
Where,
( ) is the composite received signal off all k-users. ( ) is the signature waveform of the user.
∫ 0∑ ( ) ( ))1 ( )
∫ ∑ ( ) ( ) ∫ ( )
( )
∑ ( )
Where ,
is the desired signal.
∑
.is MAI due to the presence of others users.
∫ ( ) ( ) is the cross correlation between the and the users spreading sequences. is the non-Gaussian noise.
̂ ( ) ( ) Since the codes are generally designed to have very low cross correlations relative to autocorrelations ( ) the interfering effect on user k of the other direct-sequence users is greatly reduced. Multiple-access interference (MAI) is a factor which limits the capacity and performance of DS-CDMA systems. MAI refers to the interference between direct-sequence users. This interference is the result of the random time offsets between signals, which make it impossible to design the code wave forms to be completely orthogonal. While the MAI caused by any one user is generally small, as the number of interferers users or their power increases, the amount of MAI increases and the existence of MAI have a significant impact on the capacity and performance of the conventional direct sequence system.
The conventional detector does not take into account the existence of MAI. It follows a single-user detection strategy in which each user is detected separately without regard for other users.
In matrix form, we present the outputs of the matched filter as
( ) Where
, - is the matched filter output of all K users.
R is a {K x K} correlation matrix, whose entries contain the values of the correlations between every pair of codes. The matrix R is clearly symmetric with diagonal elements are equal to 1.
A is a diagonal matrix containing the corresponding received amplitudes. , - Is the user data.
is a non-Gaussian random vector.
Figure 3. Conventional DS-CDMA detector.
V. MULTI-USER DETECTION
There has been great interest in improving DS-CDMA detection through the use of multi-user detectors. In multi-user detection, code and timing information of multiple users are jointly used to better detect each individual user. The important assumptio n is that the codes of the multiple users and the correlation properties contained in MAI are known to the receiver to extenuate interference among users and subsequently suppress noise [14].
The optimal multiuser detector, or the maximum likelihood sequence detector was proposed by Verdu’s seminal work [15], published in 1986. This detector is much too complex for practical DS-CDMA systems.
There are two categories of the most proposed suboptimal multiuser detectors,
(1) Linear multi-user detectors where a linear mapping (transformation) is applied to the soft outputs of the conventional detector to produce a new set of outputs, which hopefully provide better performance.
(2) Non-linear detection, estimates of the interference are generated and subtracted out.
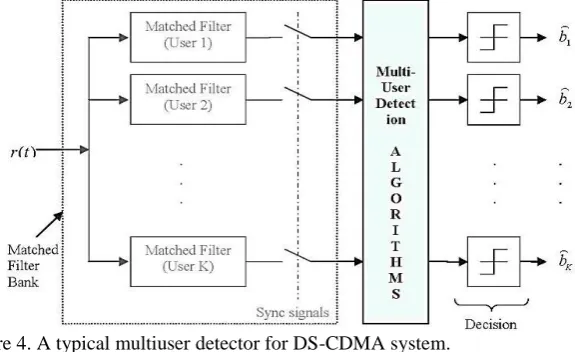
the general structure of MUD systems for detecting each K user’s transmitted symbols from the received signal as shown in figure 4,[11].The detector consists of a matched filter bank that converts the received continuous time signal to the discrete time statistics sampled at chip rate without sacrifices information relevant to demodulation. This is followed by applying multiuser detection algorithm for optimality conditions to produce the soft output statistics [16]. The soft outputs are passed to the single user decoders. With the statistic * + at the output of the matched filter, an estimate for the transmitted bits * + that minimizes the probability of error can be found.
Figure 4. A typical multiuser detector for DS-CDMA system. VI. LINEAR MULTI-USER DERTECTORS
These detectors apply a linear mapping (transformation) to the soft outputs of the conventional detector to produce a new set of outputs, which hopefully provide better performance and reduce the MAI seen by each user.
The two most popular detectors of these are the decorrelating and (MMSE) minimum mean-squared error. A. Decorrelating Detector
The decorrelating detector makes use of the structure of MAI to improve the performance of the matched filter bank.
The soft estimate of this detector is,
̂ ( ( )) ( ) ̂ ( ) ( ) When the background noise is absent PSD
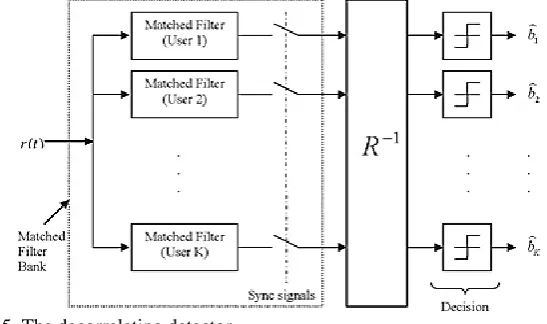
̂ ( ) ( ) ̂ ( ) We observe that the decorrelating detector completely eliminates the MAI.
Some attractive properties of the decorrelating detector[17, 18], Provides substantial performance over the conventional detectors. It does not require knowledge of the received signal amplitudes.
Has computational complexity significantly lower than that of the maximum likelihood sequence detector. Has a probability of error independent of the signal energies.
Disadvantage of the decorrelating detector[17, 18]. It causes noise enhancement.
The computations needed to invert the matrix are difficult to perform in real time. At low SNRs, the matched filter bank performs better than the decorrelating detector.
Decorrelating detector can achieve any given performance level in the multiuser environment regardless of the multiuser interference, provided that the desired user is supplied enough power, Thus, it provides a substantial performance or capacit y gains over the conventional detector under most conditions.
Figure 5. The decorrelating detector. B. Minimum Mean-Squared Error (MMSE) Detector
The MMSE detector takes into account the background noise and utilizes knowledge of the received signal powers. This detector implements the linear mapping which minimizes the mean-squared error between the actual data and the soft output of the conventional detector [19].
From the figure 6, we observe that the MMSE implements the linear mapping
,
-
which minimizes the mean-squared error between the actual data and the soft output of the conventional detector.So the decision for the user is made based on
̂ ((( ) ) ) ( ) ̂ ((( ) ( )) ) ( ) As can be seen, the MMSE detector implements a partial or modified inverse of the correlation matrix. The amount of modification is directly proportional to the background noise. The higher the noise level, the less complete an inversion of R can be done without noise enhancement causing performance degradation. Thus, the MMSE detector balances the desire to decouple the users with the desire to not enhance the background noise [16].
The MMSE detector generally provides better probability of error performance than the decorrelating detector because it takes the background noise into account. As the background noise goes to zero, the MMSE detector converges in performance to the decorrelating detector. On the other hand, as the noise gets very large, or the MAI amplitudes get very small, . In this case, performance of the MMSE detector approaches that of the conventional detector.
Disadvantages of MMSE
It requires estimation of the received amplitudes unlike the decorrelating detector.
Figure 6: MMSE linear detector.
VII.SIMULATION RESULTS
In this section, we provide some simulation results to demonstrate the performance of the conventional, decorrelator and MMSE multiuser linear detectors against MAI and impulsive ambient noise. We consider a synchronous system with K=2, 6, 10 active users. The spreading sequence of each user is a gold code of length N=31.
We first demonstrate the performance degradation of linear multiuser detectors in impulsive ambient noise at different (ε) probability that impulses occur. Then the Bit Error Rate (BER) performance comparison for the conventional, decorrelating and minimum mean-squared error detectors is investigated with increasing number of active users.
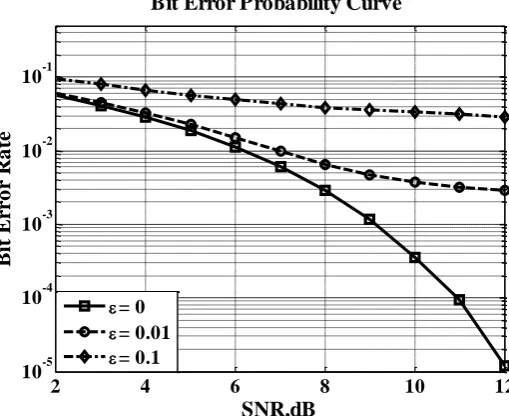
Figure 7: Probability of error versus signal-to-noise ratio (SNR) of the MF detector in a synchronous CDMA channel with various ε -mixture ambient noise probability for number of active users K=2.
Figure 8: Probability of error versus signal-to-noise ratio (SNR) of the decorrelating detector in a synchronous CDMA channel with various ε –mixture ambient noise probability for numbers of active users K=2.
2 4 6 8 10 12
10-5 10-4 10-3 10-2 10-1
SNR,dB
Bi
t
Er
ro
r
R
a
te
Bit Error Probability Curve
= 0
= 0.01
= 0.1
2 4 6 8 10 12
10-5 10-4 10-3 10-2 10-1
SNR,dB
Bi
t
Er
ro
r
R
a
te
Bit Error Probability Curve
= 0
= 0.01
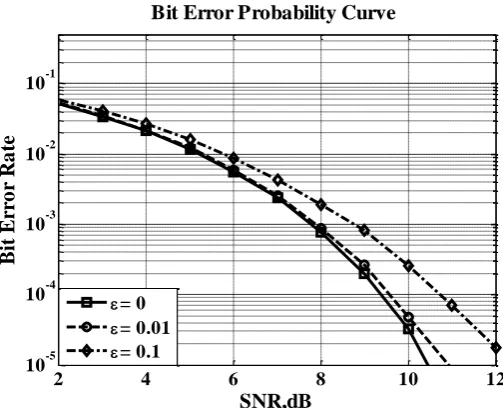
we observe that from figures 7,8 and 9 as the probability of impulsive noise increase the performance of detectors become poor .
Figure 10: Probability of error versus signal-to-noise ratio (SNR) of the MF detector in a synchronous CDMA channel with ε -mixture ambient noise at probability ε=0.01 for various numbers of active users K=2, 6 and 10.
Figure 11: Probability of error versus signal-to-noise ratio (SNR) of the decorrelating detector in a synchronous CDMA channel with ε –mixture ambient noise at probability ε=0.01 for various numbers of active users K=2, 6 and 10.
2 4 6 8 10 12
10-5 10-4 10-3 10-2 10-1
SNR,dB
Bi
t
Er
ro
r
R
a
te
Bit Error Probability Curve at =0.01
MF=2 uses MF=6 users MF=10 users
2 4 6 8 10 12
10-5 10-4 10-3 10-2 10-1
SNR ,dB
Bi
t
Er
ro
r
R
a
te
Bit Error Probability Curve at =0.01
DECOR=2 users DECOR=6 users DECOR=10 users
Figure 9: Probability of error versus signal-to-noise ratio (SNR) of the MMSE detector in a synchronous CDMA channel with various ε –mixture ambient noise probability for numbers of active users K=2.
2 4 6 8 10 12
10-5 10-4 10-3 10-2 10-1
SNR,dB
Bi
t
Er
ro
r
R
a
te
Bit Error Probability Curve
= 0
= 0.01
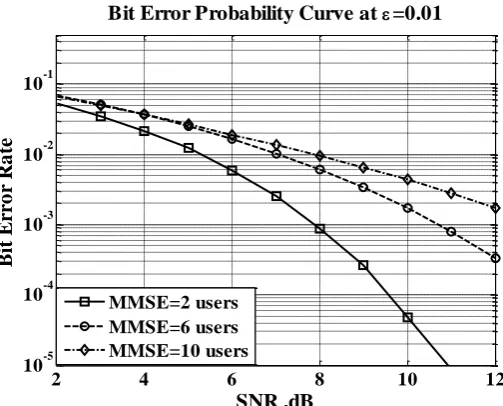
Figure 12: Probability of error versus signal-to-noise ratio (SNR) of the MMSE detector in a synchronous CDMA channel with ε –mixture ambient noise with probability ε=0.01 for various numbers of active users K=2, 6 and 10.
we observe that from figures 10,11 and 12 at specific probability of impulsive noise as the number of active user increase the performance of detectors become poor This is because as the number of interfering users increase, the amount of MAI becomes greater.
Figure 13: Probability of error versus signal-to-noise ratio (SNR) of the MF,DECORRELATOR and MMSE detectors in a synchronous CDMA channel with ε –mixture ambient noise at probability ε=0 for number of active users K= 6 .
2 4 6 8 10 12
10-5 10-4 10-3 10-2 10-1
SNR ,dB
Bi
t
Er
ro
r
R
a
te
Bit Error Probability Curve at =0.01
MMSE=2 users MMSE=6 users MMSE=10 users
2 4 6 8 10 12
10-5 10-4 10-3 10-2 10-1
SNR ,dB
Bi
t
Er
ro
r
R
a
te
Bit Error Probability Curve at =0
Figure 14: Probability of error versus signal-to-noise ratio (SNR) of the MF,DECORRELATOR and MMSE detectors in a synchronous CDMA channel with ε –mixture ambient noise at probability ε=0.01 for number of active users K= 6 .
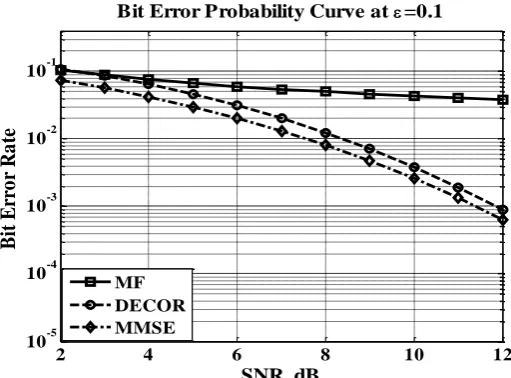
Figure 15: Probability of error versus signal-to-noise ratio (SNR) of the MF,DECORRELATOR and MMSE detectors in a synchronous CDMA channel with ε –mixture ambient noise at probability ε=0.1 for number of active users K= 6 .
we can observe that from figures 13, 14, and 15, the MMSE multiuser detector offers significant performance gains over the linear decorrelating detector and the conventional (MF) detector, especially at low SNRs.
VIII. CONCLUSION
The linear multiuser detectors have more performance gain over the conventional matched filter. MMSE detector generally performs better than the decorrelating detector because it takes the background noise into account. by increasing the number of users, the performance of all detectors will degrade, This is because as the number of interfering users increases, the amount of MAI becomes greater. However also the performance of all detector become poor in the presence of high present of impulsive noise so the non-Gaussian noise can be quite detrimental to the performance of conventional systems based on the Gaussian assumption, whereas it can actually be beneficial to performance if appropriately modeled. In prospective work we will try to develop robust multiuser detection techniques that based on M-Estimator , a class of estimators belong to robust statistics, for combating multiple-access interference , impulsive noise and near-far problem in CDMA communication systems.
2 4 6 8 10 12
10-5 10-4 10-3 10-2 10-1
SNR ,dB
Bi
t
Er
ro
r
R
a
te
Bit Error Probability Curve at =0.01
MF DECOR MMSE
2 4 6 8 10 12
10-5 10-4 10-3 10-2 10-1
SNR ,dB
Bi
t
Er
ro
r
R
a
te
Bit Error Probability Curve at =0.1
REFERENCES
[1] S. Verdú, Multiuser Detection. Cambridge, U.K.: Cambridge Univ Press, 1998.
[2] K. L. Blackard, T. S. Rappaport, and C. W. Bostian , “Measurements and models of radio frequency impulsive noise for indoor wireless communications ”IEEE J. Select. Areas Communication, vol. 11, pp. 991–1001, Sept 1993.
[3] Shahzad A Bhatti, Qingshan Shan, Ian A Glover, Robert Atkinson,Illiana E Portugues,Philip J Moore and Richard Rutherford," impulsive noise modeling and prediction of its impact on the performance of WLAN receiver" 17th European Signal Processing Conference (EUSIPCO 2009),pp. 1680-1684, August 2009.
[4] A. Spaulding and D. Middleton, "Optimum Reception in an Impulsive Interference Environment--Part I: Coherent Detection," Communications, IEEE Transactions on, vol. 25, pp. 910-923, 1977.
[5] D. Middleton, “Non-Gaussian noise models in signal processing for telecommunications: New methods and results for Class A and Class B noise models”, IEEE Transactions on Information Theory, vol. 45, no. 4, pp. 1129-1149, May 1999. [6] G. A. Tsihrintzis and C. L. Nikias, "Fast estimation of the parameters of alpha-stable impulsive interference", IEEE
Transactions on Signal Processing, vol. 44, no 6, pp. 1492-1503, June 1996.
[7] M.Shao and C.L Nikias. Signal processing with fractional lower order moments: Stable processes and their applications.Proc.IEEE,81:986-1010,1993.
[8] L.M. Garth, H.V. Poor, "Narrowband interference suppression in impulsive environment", IEEE Trans. on Aerospace and Electronics Systems, vol. AES-28, pp. 15-33, 1992.
[9] “Channel modeling and threshold signal processing in under-water acoustics: An analytical overview,”IEEE J. Oceanic Eng., vol.OE-12, pp. 4–28, 1987.
[10]S. M. Zabin and H. V. Poor, “Efficient estimation of the class A parameters via the EM algorithm,”IEEE Trans. Inform. Theory, vol.37, pp. 60–72, Jan. 1991.
[11]Linear Multiuser Detectors Study in DS-CDMA System in AWGN Channel, M. H. Essai, 1Novosibirsk State Technical University/Department of the Design and Technology of Electronics, Novosibirsk, Russian.
[12]A. Duel-Hallen, J. Holtzman, and Z. Zvonar (1995), Multiuser Detection for CDMA Systems, IEEE Personal Communications, vol. 2, pp. 46-58.
[13]J.G. Proakis (1995), Digital Communications, 3nd Edition, New York: McGraw-Hill.
[14]Shimon Moshavi (1996), Multiuser Detection for DS-CDMA Communications, IEEE Communication Magazine.
[15]S. Verdu, "Minimum Probability of Error for Asynchronous Gaussian Multiple-Access Channels," IEEE Trans. info. Theory, vol. IT-32, no. 1. Jan. 1986, pp. 85-96.
[16]S. Moshavi, E. G. Kanterakis, and D. L. Schilling (1996), Multistage Linear Receivers for DS -CDMA Systems, Int'l.J, Wireless info.Networks, vol. 3, no. 1, pp.1-17.
[17]S. Verdu, "Multi-User Detection," Advances in Statistical Signal Processing, vol. 2, JAI Press 1993, pp. 369-409.
[18]R. Lupas and S. Verdu, "Near-Far Resistance of Multi-User Detectors in Asynchronous Channels," IEEE Trans. Commun., vol. 38, no. 4, Apr. 1990, pp. 496-508.