Improved estimation of surface
biophysical parameters through inversion
of linear BRDF models
U C L
Mathias Inguar Disney
Remote Sensing Unit
Department o f Geography, University College London 26 Bedford W ay
London W CIH O A P
m d is n e y @ g e o g .u c l.a c .u k
ProQ uest Number: U6427 9 1
All rights reserved
INFORMATION TO ALL U SE R S
The quality of this reproduction is d ep en d en t upon the quality of the copy subm itted.
In the unlikely even t that the author did not sen d a com plete manuscript
and there are m issing p a g e s, th e se will be noted. Also, if material had to be rem oved, a note will indicate the deletion.
uest.
ProQ uest U 642791
Published by ProQ uest LLC(2016). Copyright of the Dissertation is held by the Author.
All rights reserved.
This work is protected against unauthorized copying under Title 17, United S ta tes C ode. Microform Edition © ProQ uest LLC.
ProQ uest LLC
789 East E isenhow er Parkway P.O. Box 1346
Artist's impression of the NASA Terra platform, launched in December 1999 as part of long term efforts to monitor and understand global climatic and circulation processes
(courtesy of NASA).
S e o S urface Temperofure f C )
-2 35
Abstract
An investigation is presented into the ability o f linear kernel-driven models to adequately describe the surface bidirectional reflectance distribution function (BRDF) of vegetation. Such models were developed primarily for deriving albedo from limited angular samples o f reflectance at moderate resolution (100s o f m to km) and are based on semi-empirical approximations to more complex physically-based models. They assume that BRDF can be described by a linear combination o f separate scattering 'shapes' (kernels), each o f which is a function o f purely geometric terms (viewing and illumination angles) only.
The assumptions underlying the linear kernel-driven models were tested using 3D geometric canopy structural models allied to a description o f the radiometric scattering behaviour within the 3D canopy. This is the first time the properties o f the models have been explicitly tested in this manner. The assumption that canopy reflectance can be represented as a linear combination o f volumetric and geometric-optic (GO) scattering terms appears to be well founded. The kernels perform less well when the canopy departs too far (structurally or radiometrically) from the assumptions made in the model formulation. It is shown that the volumetric and GO kernels are not always capable of separating the components o f canopy reflectance and that there can be coupling between the kernels. It is also demonstrated that the model parameters are not purely geometric as intended and that they contain biophysical information (related to leaf area and leaf reflectance). However, this information may require ancillary data if it is to be extracted from the model parameters.
Acknowledgements
Firstly, I want to thank my supervisor, Lewis. He has provided far more inspiration and help than I probably deserve. He taught me that it can actually be fascinating watching (and understanding) grass grow. I owe my interest and continued development in plant modelling (and much else) to him. I would also like to thank colleagues such as Crystal Schaaf and the BU MODIS team, Jean-Louis Roujean, Charlie Walthall and in particular Mike Barnsley, for influence and guidance over the last few years. Thanks also go to colleagues within the Department o f Geography at UCL for stimulating conversation over the years. I owe a debt o f gratitude I can never repay to my M um and Dad for always supporting me and making me realise what an incredible place the world is. Finally, above all else, I must thank Helen. For supporting me (financially and emotionally), for getting me through the bad and for sharing the good. W ithout you, it wouldn't be worth it. Helen, this is for you (maybe one day you'll read it!).
Table of contents
Page
C hapter 1 In trod uction
1
1.1 Change and uncertainty in global clim ate... 1
1.2 Developments in Earth Observation... 3
1.3 Land Surface Processes... 5
1.3.1 Biophysical parameters and vegetation... 6
1.3.2 Shortwave energy budget and albedo... 9
1.3.3 Albedo and surface scattering... 12
1.3.4 Surface scattering and vegetation... 13
1.4 Surface reflectance anisotropy... 15
1.5 Thesis outline... 18
C hapter 2 R eview o f canopy reflectance m od ellin g
21
2.1 Factors affecting surface reflectance anisotropy... 232.1.1 Bidirectional reflectance distribution function (BRDF)... 25
2.1.2 Removal o f reflectance anisotropy effects from observed reflectance 30 2.1.3 Reflectance anisotropy as a source o f information... 32
2.2 Atmospheric effects on measured surface reflectance... 32
2.3 Canopy reflectance: the forward and inverse problem s... 37
2.4 M athematical approaches to model inversion... 39
2.4.1 Linear inversion... 40
2.4.2 Numerical inversion... 41
2.4.3 Multidimensional minimisation... 43
2.4.4 Sum m ary... 45
2.5 Canopy reflectance modelling... 47
2.5.1 Empirical m odels... 48
2.5.2 Physically based models 51 2.5.2.1 Canopy reflectance, the turbid medium and radiative transfer (R T) 52 2.5.2.2 Approximations made possible by the turbid medium approach 55 2.5.2.3 Limitations o f the turbid medium approach... 58
2.5.2.4 Geometric-optic m odels... 61
2.5.3 Computer simulation m odels... 63
2.5.3.2 Radiosity... 65
2.5.3.3 Other numerical CR modelling m ethods... 66
2.5.3.4 B PM S/ararar m odel... 67
2.5.4 Semi-empirical m odels... 69
2.5.4.1 Linear (kernel-driven) semi-empirical kernels... 70
2.5.4.1.1 Volumetric k e rn e ls... 72
2.5.4.1.2 GO kernels... 73
2.5.4.2 Non-linear semiempirical m odels... 77
2.6 Conclusion... 78
C h ap ter 3 D escription o f field -m easu red data
79
3.1 Summary o f data, collection methods and validation... 813.1.1 Plant structural measurements... 83
3.1.2 Ground spectro-radiometric data... 86
3.1.3 Canopy coverage estimates... 89
3.1.4 LAI measurements... 91
3.1.5 Airborne data... 93
3.2 Summ ary... 94
C h ap ter 4 E xam ination o f volu m etric and G O scatterin g
96
b eh aviou r
4.1 Experimental method... 984.2 Exploring the hypotheses behind the linear m odels... 101
4.2.1 Pcanopy &s SL linear combination of volumetric and GO scattering... 101
4.2.2 Volumetric and GO components o f Pcanopy... 106
4.2.3 Discussion o f directional shapes and magnitudes o f a and p ... 113
4.2.3.1 Wolumetric component o f pcanopy, ... 113
4.2.3.2 GO component o f pcanopy, P ... 123
4.3 Conclusion... 125
C h ap ter 5 C an opy scatterin g and the lin ea r m odel p aram eters
127
5.1 Relationships between a and k^/, and p and k c o... 1275.2 Variation o f volumetric component, a against kvoi... 138
5.2.2 Analysis o f regression relationships... 142
5.2.3 Slopes and intercepts avo/, hvoi o f a against kyo/... 143
5.2.4 Summary... 144
5.3 Variation o f GO component, (3 against k c o... 145
5.3.1 R esults... 145
5.3.2 Analysis o f regression relationships... 152
5.3.3 Slopes and intercepts aco, boo o f p against k c o ... 155
5.3.4 S u m m ary ... 156
5.4 Conclusion... 157
C h ap ter 6 Separability o f canopy scatterin g com p on en ts and
160
in form ation content
6.1 Introduction... 1606.2 M ethod... 162
6.3 R esults... 164
6.4 D iscussion... 172
6 . 4 . / B a r le y - 18*'’ A pril... 172
6.4.2 Barley - 13*'’ M ay... 174
6.4.3 Barley - 4"' June... 175
6.4.4 Barley - 24"’ June... 175
6.4.5 W heat - 23’" M arch... 176
6.4.6 W h ea t- 2 3 ’" A pril... 176
6.4.7 Summ ary... 177
6.5 Implications o f coupling between model param eters... 178
6.6 Implications o f negative model param eters... 187
6.6.1 Discussion o f two parameter inversion... 191
6.7 Conclusion... 192
C h ap ter 7 D evelop m en t and app lication o f sp ectral kernels
196 7.1 Introduction... 1967.2 Concept o f spectral kernels... 199
7.3 Derivation o f spectral k e rn e ls... 202
7.3.1 Reflectance features o f vegetation... 204
7 3.3 Vegetation kernels: the vegetation component o f PcanopyQ^)... 210
7.4 Testing the spectral kernels... 211
7.4.1 Demonstration of vegetation spectral kernels against measured spectra ... 217
7.5 A spectral directional kernel-driven model o f Pcanopy... 221
7.5.1 Performance o f spectral kernels against simulated Çfcanopy... 224
7.5.2 Separation o f soil and vegetation components... 228
7.5.3 Reconstruction from limited w avebands... 232
7.5.4 Directional component... 234
7.5.5 Demonstration o f spectral kernels against airborne reflectance d a ta 236 7.6 Conclusion... 239
C h ap ter 8 C onclusions and directions for fu rth er w o rk
241
8.1 Exploring the concept o f linear kernel-driven m odels... 2418.2 Extension o f the kernel-driven modelling concept... 244
8.3 Directions for future research... 245
8.3.1 Application o f full spectral, directional kernel-driven m o d e l... 245
8.3.2 Other canopy ty p e s ... 246
8.3.3 Multiple scatterin g ... 248
8.3.4 Improved fieldwork measurements... 249
8.3.5 Optical and microwave scattering... 250
Appendix 1 Constraint o f linear model parameters for inversion... 251
Appendix 2 Sunlit and shaded scene components for barley and w heat... 255
R eferences... 259
Figures
Page
C h ap ter 1
1.1 MODIS 16-day reflectance image... 5
1.2 Albedo and positive and negative feedback loops o f surface fluxes... 7
1.3 Solar irradiance curve at top and bottom o f atmosphere... 8
1.4 The fate o f incoming solar radiation at the Earth's surface... 9
1.5 Interactions between incoming radiation, the surface and the atmosphere 11 1.6 Schematic representation o f radiation transport processes within a vegetation canopy... 15
C h ap ter 2
2.1 Four examples o f surface reflectance... 242.2 Configuration o f viewing and illumination vectors in the viewing hem isphere... 26
2.3 Angular effects caused by satellite repeat pattern... 31
2.4 Four sources o f atmospheric perturbation to the measured surface reflectance signal... 33
2.5 Schematic representation o f forward and inverse modes o f Pcanopy model operation... 38
2.6 Three extreme types o f error surface that may be encountered in function optimisation... 45
2.7 Canopy geometry contributing to BRDF... 50
2.8 Schematic representation o f the turbid medium approxim ation... 53
2.9 Geometry o f an illuminated cone and its shadow... 61
2.10 Geometry o f spheroid-on-a-stick with shape controlling param eters... 62
2.11 Angular variation o f the Ross and Li kernels... 75
2.12 Family o f Li Sparse GO kernels... 75
2.13 Family o f LiDense GO kernels... 76
C h ap ter 3
3.1 AVHRR image, SPOT image and aerial photograph o f field site... 803.2 W ireframe representation o f barley plant... 83
3.4 Simulated barley canopy (shortly prior to harvest)... 85
3.5 Geometry o f ground radiometer measurements... 86
3.6 Measured and simulated canopy reflectance at four bands... 87
3.7 Scatter o f BPMS against measured pcampy, barley 13“" M ay 1997... 89
3.8 Canopy cover photographs for barley canopy... 90
3.9 %cover estimated from photography and BPMS sim ulations... 91
3.10 M easured and modelled LAI for barley and w heat... 92
3.11 NERC ATM image over Barton Bendish, 2/8/97... 94
C h ap ter 4
4.1 Reflectance from vegetation and soil demonstrated... 1004.2 Simulated images o f measured barley and wheat canopies... 103
4.3 Viewing and illumination geometry and canopy extent for simulations... 104
4.4 Simulated barley reflectance, 0v from -50° to 0°... 105
4.5 Variation with view zenith angle o f BPMS-derived volumetric component o f barley and wheat canopy reflectance for six dates... 107-109 4.6 Variation with view zenith angle o f BPMS-derived GO component o f barley and wheat canopy reflectance for six dates... 110-112 4.7 Proportional contribution o f sunlit scene components to scene reflectance, for barley (four dates) and wheat (two dates)... 114-116 4.8 Cumulative LAD for four barley and two wheat canopies... 117
4.9 Examples o f Bunnik's LAD function... 119
4.10 Correlation o f measured LAD against Bunnik distributions... 119
4.11 Leaf projection function G(Q) in viewing direction Q(0v, 120 4.12 Phase function, for 0/ = 0°... 121
C h ap ter 5
5.1 BPMS-derived volumetric parameter (a ) against kvo/... 129-131 5.2 BPMS-derived GO parameter (P) against kco (LiDense)... 132-134 5.3 BPMS-derived GO parameter (p) against kco (LiSparse)... 135-137 5.4 Perspective view o f barley plants from above... 1525.5 Simulated 'spheroids on sticks' canopy... 154
C hapter 6
6.1 Estimating model parameters f^oi and Ïgo from two directions... 163
6.2 p/gq/ and psou spectra used in BPMS ç>campy sim ulations... 164
6.3 Comparison o f f/^o, Co/ (RossThick) and ioo (LiSparse) parameters derived from BPMS simulations and inversion o f a full linear m odel... 166-168 6.4 Comparison o f Co, Co/ (RossThin) and fco (LiDense) parameters derived from BPMS simulations and inversion o f a full linear m odel... 169-171 6.5 Principal component analysis o f the separate a and p components o f pcanopy for barley (four dates) and wheat (two dates)... 182-184 6.6 Model parameters from 2 and 3 kernel inversions, June barley... 189
6.7 Model parameters from 2 and 3 kernel inversions, 23"^^ April barley... 190
C h ap ter 7
7.1 Direct and diffuse scattering contributions to simulated pcanopy as a function of scattering order... 2007.2 Examples o f fresh, laboratory-measured vegetation reflectance spectra... 203
7.3 Examples o f field-measured soil and vegetation reflectance spectra... 203
7.4 Price's first four basis functions o f observed soil reflectance spectra... 205
7.5 First five vegetation spectral kernels derived from fresh and dry single scattered albedo... 208
7.6 Cumulative relative error o f inversion o f vegetation spectral kernels derived from fresh and dry reflectance and transmittance spectra, against all EPFS spectra. 211 7.7 Cumulative relative error o f inversion o f vegetation spectral kernels derived from fresh single scattering albedo only, against all EPFS spectra... 212
7.8 Cumulative relative error o f inversion o f vegetation spectral kernels derived from fresh and dry single scattering albedo, against all EPFS spectra... 212
7.9 Relative error o f inversion against EPFS reflectance spectra, 1 and 4 kernels.... 214
7.10 Original and modelled lush and dry grass spectra, 1 and 4 kernels, N IR 216 7.11 M easured against modelled grass reflectance, 1 - 5 vegetation kernels 217-218 7.12 Residual error between measured and modelled lush and dry grass reflectance, one and four kernel cases... 219
7.13 Simulated pcanopy, LAI = 0.1... 221
for two LAI cases, for two separate kernel combinations... 224
7.16 Original against modelled reflectance, LAI = 0.1... 226
7.17 Original against modelled reflectance, LAI = 4 ... 226
7.18 Scatter plot o f all view zenith angles and kernels combinations... 227
7.19 Residuals from fitting spectral kernels to reflectance data... 228
7.20 Soil and vegetation model parameters, LAI = 0.1... 229
7.21 Soil and vegetation model parameters, LAI = 4 ... 229
7.22 Scatter plot o f soil components o f ç>canopy, two LAI cases... 231
7.23 Scatter plot o f vegetation components o f pcampy, two LAI cases... 232
7.24 Reflectanee generated from samples at selected MODIS w avebands... 233
7.25 Scatter o f reflectance generated at selected MODIS w avebands... 234
7.26 Angular variation o f inverted spectral kernel parameter values (s lv l case) 235 7.27 Inversion o f spectral kernels against airborne (ATM) data... 237
7.28 Scatter o f original against modelled radiance values (using spectral kernels) for random points within ATM image o f figure 7.27... 238
C h ap ter 8
8.1 Simulated vegetation canopy... 247A p p en d ix 2
A2.1 Proportional contribution o f sunlit and shaded scene components to total 255-257 scene reflectance, for barley (four dates) and wheat (two dates)...Tables
2.1 Values o f r for comparison o f measured to modelled reflectances... 683.1 Values o f r^ for comparison o f measured to modelled reflectances... 88
3.2 Values o f LAI derived from BPMS canopies... 93
4.1 Details o f the canopies used in simulations... 102 5.1 Slopes, intercepts and regression coefficients for volumetric kernels as a
function o f 0/ and ^row (barley and wheat, six dates)... 139-141 5.2 Slopes, intercepts and regression coefficients for the LiDense and LiSparse
GO kernels as a function o f 0, and (|)^ow(barley and wheat, six dates)... 146-148 5.3 Slopes, intercepts and regression coefficients for GC variants o f GO
6.1 values for BPMS-derived against inverted values o f f/^o, fyo/ and fc o... 178 7.1 First five eigenvalues o f PCA o f LOPEX fresh and dry single scattering albedo, and the corresponding percent variance... 209 7.2 RMSE o f inversion o f various kernel combinations against measured spectra... 213 7.3 Comparison o f RMSE to alternative estimates o f model fit (k is kernels)... 220 7.4 RMSE o f inversion o f spectral kernels against reflectance data... 225
List of principal symbols
Each symbol is explained in the text when it is first introduced.
Symbol Description
A g,c.z.t Areal proportions o f illuminated ground and crown, and shadowed ground and crown
a Albedo
a Volumetric component o f canopy scattering P GO component o f canopy scattering
C Canopy clumping factor
E Irradiance arriving at the surface
F^ Downwelling (total) flux
F^ Upwelling (total) flux
fso,fvoi,fco Isotropic, volumetric and GO linear model parameters
G(Q) Leaf projection function in viewing (or illumination) direction g/(Q/) Angular distribution o f leaf normals
F (Q ’->Q ) Leaf scattering phase function
H Sensible heat flux
Downwelling diffuse flux Upwelling diffuse flux
kiso, Koh kco Isotropic, volumetric and GO linear model kernels
LE Latent heat flux
Lc Radiance exitant from the surface
L^ Downwelling radiance
L t Upwelling radiance
X Wavelength
Q (Q ’^ Q ,z ) Joint gap probability
Q(0v, (t)v) or Q Viewing vector (solid angle) Q (6/, (j)/} or Q ’ Illumination vector (solid angle)
Rn N et radiation
p Reflectance
p(â, Q, Q ') Spectral directional hemispherical reflectance Spectral bihemispherical reflectance
ac Extinction coefficient o f the canopy medium
<jg Differential scattering coefficient o f canopy medium X Transmittance (in canopy) or optical depth (in atmosphere) 0„ (|), Illumination zenith and azimuth angles
0y, (|)v View zenith and azimuth angles
w Weighting value
CO Single scattering albedo
^ Phase angle o f scattering
Zo Surface roughness length
z Depth/height within canopy
Acronyms/abbreviations
Each acronym/abbreviation is explained in the text when it is first introduced.
A cronym Definition
ADEOS Advanced Earth Observing System A ER O N ET Aerosol Robotic Network
AIC Akaike information criteria
AM BRALS Algorithm for MODIS bidirectional reflectance and albedo
ANN Artificial neural network
A RARA T Advanced Radiometric Ray Tracer
ARS Airborne Research System
ASAS Advanced Solid state Array Spectrometer
A ST ER Advanced Spacebome and Thermal Emission and Reflection Radiometer
ATSR Along Track Scanning Radiometer
AVHRR Advanced Very High Resolution Radiometer
BPMS Botanical Plant Modelling System
BRDF Bidirectional reflectance distribution function
CASI Compact Airborne Spectrographic Imager
CERES Clouds and Earth’s Radiant Energy System
CHRIS Compact High Resolution Imaging Spectrometer
CR Canopy reflectance
CSAR Coupled Surface-Atmosphere Reflectance
DART Discrete Anisotropic Radiative Transfer
DEM Digital elevation model
EGO European Goniometric Observatory
ENVISAT Environmental Satellite
EG Earth observation
EOS Earth Observing System
EPFS Equipment Pool for Field Spectroscopy
ERS European Remote Sensing Satellite
fAPAR Fraction o f absorbed photosynthetic radiation
FCC False colour composite
GA Genetic algorithm
GARP Global Atmospheric Research Program
GCM General/global circulation model
GO Geometric optic
IFB International Forum on BRDF
IFOV Instantaneous field o f view
IGBP International Geosphere Biosphere Program
IPCC International Panel on Climate Change
IWMMM International Workshop on Multiangle M odelling Methods
IR (NIR) Infrared (near IR)
ISLSCP International Satellite Land Surface Climatology Project
JRC Joint Research Centre
KBS Knowledge-based system
LAI Leaf area index
LAD Leaf angle distribution
LOPEX ESP LUT MISR MODIS MOPITT MSG MTPE MVA MVC NASA NDVI NERC NOAA NPOESS NPP PCA POLDER PROBA PSN RADAR RAM! RMSE RPV RT SAIL SOSA SPOT SVAT SW TOA TIR TM UNFCC
Leaf Optical Properties Experiment Land surface process
Look-up table
Multi-angle Imaging Spectro-Radiometer
Moderate Resolution Imaging Spectroradiometer Measurement o f Pollution in The Troposphere METEOSAT Second Generation
Mission To Planet Earth Multiple view angle
Maximum value composite
National Aeronautical and Space Agency Normalised difference vegetation index Natural Environment Research Council
National Oceanic and Atmospheric Administration National Polar Orbiting Environmental Satellite System Net primary productivity
Principal component analysis
Polarisation and Directionality o f the Earth’s Surface Project for On Board Autonomy
(daily) net photosynthesis Radio detection and ranging
Radiative Transfer Model Intercomparison Root mean square error
Rahman-Pinty-V erstraete Radiative transfer
Scattering by arbitrarily inclined leaves Successive orders o f scattering approximation Système Probatoire d'Observation de la Terra Soil-vegetation-atmosphere transfer
Shortwave
T op-of-atmosphere Thermal infrared Thematic mapper
1 In trod uction
1.1 Change and uncertainty in global climate
The development o f remote sensing as a tool for better understanding the dynamics o f biogeochemical processes controlling the Earth’s climate has been driven by a growing recognition o f the need to determine human impact on the global environment (Global Atmospheric Research Program (GARP) report, 1975; Henderson-Sellers and Wilson, 1983; Sellers, 1994; Trenberth, 1995; Hall et a l, 1995). This need has been exacerbated by the apparent increase in extreme climatic events o f recent years such as the unusually long-lived and severe El Nino event o f 1997-8, the subsequent droughts and tires in South East Asia and flooding in Central America in the latter part o f 1998 (W ebster and Curry, 1998). Such potentially catastrophic climate events have impacted virtually all aspects o f human life around the globe: from minor regional climatic and ecosystem variability to life-threatening fires; the threat o f sea-level rise inundating low- lying coastal regions (Schneider, 1999), to more indirect manifestations such as the instability o f global economic and political conditions.
a result, many governments recognise the necessity o f investing heavily in research aimed at developing a better understanding o f both the underlying mechanisms and the actions o f global climatic processes (Sellers, 1992).
The drive towards a better understanding o f climate processes is exemplified by recent efforts such as N A SA ’s Earth Observing System (EOS) (formerly the Mission To Planet Earth (MTPE)). EOS is an ongoing series o f experiments, instruments and projects, the stated aim o f which is “...is to develop understanding o f the total Earth system, and the effects o f natural and human-induced changes on the global
en viro n m en t (EOS press release, January 1998). As an indication o f the seriousness with
which such aims are being pursued, EOS was allocated a budget o f $ 1.42 billion in the 1998 Congressional spending projections {ibid.). Other projects with similar aims are the Japanese Advanced Earth Observing System (ADEOS), with instruments such as POLDER (Polarisation and Directionality o f the Earth’s Surface) on board, designed to measure land surface reflectance, polarisation, and atmospheric aerosol distributions (Deschamps et a l, 1994; Leroy et a l, 1996), and the next generation meteorological observation programme NPOESS (National Polar Orbiting Environmental Satellite System, www[L5]).
In conjunction with developments in climate modelling such as rapid advances in computing speed and efficiency and sophistication o f algorithms (Hack, 1995), Earth Observation (EO) has emerged as one o f the most powerful tools for improving our understanding o f the surface processes controlling global climate. Such processes operate over a huge range o f spatial and temporal scales - from local and regional weather variations, to long-term warming and cooling trends o f global climate. In order to detect perturbations in the global climate system (such as might be caused by anthropogenic increases in greenhouse gases like CO2) methods o f monitoring large (even global) areas over long time-scales are required (Charlson et a l, 1992). The spatial coverage afforded by EO makes it particularly suited to such a task. Long-term temporal coverage will require successive generations o f EO programmes. This has led to the inception o f major international interdisciplinary projects such as the International Satellite Land Surface Climatology Project (ISLSCP) (Sellers, 1994), which aim to exploit the potential for timely, large-scale coverage offered by remotely sensed data (Sellers, 1992; IPCC
1.2 Developments in Earth Observation
"[To] expand the observational foundation fo r climate studies to provide accurate,
long-term data with expanded temporal and spatial coverage.... there is a need fo r long
term consistent data to support climate and environmental change investigations and
projections. ''
Part o f conclusion o f IPCC Working Group I, 2001 (IPCC, 2001a).
A great deal o f progress has been made in EO over the last thirty years. This has been driven largely by the realisation that the observation o f global climate processes requires the type o f spatial and temporal coverage only afforded by remote sensing. The current sophisticated, versatile and multi-purpose payloads exemplified by the NASA EOS programme (Running et a l, 1994; Kaufman et a l, 1998) represent a significant advance from the days o f Landsat 1, a crude multispectral radiometer launched in 1972. A great deal o f money and effort has been invested in developing remote sensing instruments to probe all aspects o f global climate. This encompasses a wide range of processes including: the role o f atmospheric aerosols and clouds in climate change (Charlson et a l, 1992; Arking, 1991); ocean circulation and exchanges o f latent and sensible heat with the atmosphere (Hsiung, 1985; Randall et a l, 1992); carbon budget calculations (Schimel, 1995; IGBP, 1998; W essman and Asner, 1998); biosphere- atmosphere transfer (Sellers et a l, 1995); the influence o f the cryosphere (Nolin and Stroeve, 1997); and absorption (and reflection/re-radiation) o f incoming solar radiation at the Earth’s surface (Henderson-Sellers and Wilson, 1983; Dickinson, 1983, 1995).
The EOS program is designed to monitor the interchanges o f energy, moisture and carbon, land use, and ocean and atmospheric circulation for at least eighteen years. The EOS era began with the launch o f the EOS-AMI {Terra) platform in December 1999 (Kaufman et a l, 1998. www[1.6]). The follow-up platform, EO S-PM l {Aqua), designed to monitor hydrosphere and cryosphere processes, is due to be launched in 2002. To illustrate the comprehensive nature o f EOS, the various instruments aboard the Terra
platform are listed below:
• ASTER (Advanced Spacebome and Thermal Emission and Reflection Radiometer) for monitoring local and regional processes such as surface temperature, energy balance and mapping o f soils, geology and land cover change (Yamaguchi et a l, 1998);
• CERES (Clouds and Earth’s Radiant Energy System) to determine the radiative forcing effect o f Earth’s cloud cover and quantify the radiative budget (Wielicki et a l , 1998);
• MISR (Multi-angle Imaging Spectro-Radiometer) a pointable instmment with nine look angles designed to observe the angular variations o f scattering from the surface, atmospheric aerosols and clouds (Diner et a l, 1998);
• MODIS (Moderate resolution Imaging Spectrometer) to provide comprehensive monitoring o f land, ocean and atmosphere at moderate resolution, with high temporal coverage and capabilities to provide global estimates o f land cover characteristics such as albedo (Justice et a l, 1998).
• MOPITT (Measurement o f Pollution in The Troposphere) for mapping atmospheric CO and CH4 (Gilles et a l, 1996).
th
Figure 1.1 MODIS 16 day reflectance image (period ending 17 May, 2001). Bands 1, 4 and 3 (620-640nm, 545-565nm, 459-479nm).
advanced quality assurance phase before dissemination to the scientific community. These products represent a great improvement over data from sensors such as the National Oceanic and Atmospheric Administration (NOAA) Advanced Very High Resolution Radiometer (AVHRR). Greatly improved sensor technology and calibration combined with sophisticated processing have resulted in products usable by the wider community rather than just raw radiance data or simple empirical indices. The variety of long-term data from EOS, in conjunction with the Japanese Advanced Earth Observing System mission (www[1.7]) and European missions such as the Environmental Satellite (ENVISAT) (www[1.8]) and the European Remote Sensing satellites ERS-1 and 2 (www[1.9j), will enable a clearer understanding of the complex processes controlling Earth’s climate to be established. Data from a variety o f such remote sensing platforms can also be combined to provide a synergistic view of the Earth’s climate processes.
1.3 Land surface processes
solar radiation are far less spatially and temporally predictable than their ocean surface equivalents. Another major consideration is that human existence is almost exclusively dependent on the state o f the land surface.
Earth observation has been deployed in many ways to improve understanding of land surface processes either by directly observing processes where possible or, in most cases, utilising observations made o f surrogate (dependent) variables. One area where this is extremely important and o f direct relevance to this thesis is the observation o f surface biophysical parameters. Parameters such as total biomass, the fraction o f absorbed photosynthetic radiation (fAPAR), transpiration rates, surface roughness (Z o), and albedo provide linkages between biogeochemical processes such as nutrient availability, soil composition and the transfer o f carbon and climatic drivers such as the fluxes o f moisture and energy at the surface. These linkages take the form o f near-surface atmospheric forcing, which in turn results in exchanges o f water, radiation, and momentum between the surface and atmosphere (Sellers, 1995a). Consequently, much effort has been devoted to measuring and modelling land surface processes and their controlling biophysical parameters (Hall et a l, 1995; Sellers, 1995b; Sellers et a l , 1997).
1.3.1 Biophysical parameters and vegetation
atmospheric energy transport processes such as turbulence, convection and radiation may act (Sellers, 1995a).
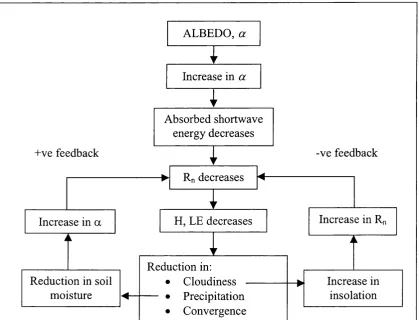
Vegetation is also an important factor in mediating interactions between the biogeophysical system and atmospheric circulation processes through the biophysical parameters mentioned above, such as fAPAR, Zq and albedo^. An example o f the influence o f vegetation and the potential feedback on these surface-atmosphere interactions is illustrated in figure 1.2. This is the feedback cycle for surface roughness under hypothetical conditions o f deforestation and/or desertification. Figure 1.2
emphasises that the energy exchanges between the surface and the atmosphere are heavily influenced by the quantity and activity o f surface vegetation.
-ve feedback +ve feedback
Rn decreases
Increase in a
ALBEDO, a
Increase in a
Increase in R, H, LE decreases
Reduction in soil moisture
Increase in insolation Absorbed shortwave
energy decreases
Reduction in:
Cloudiness -Precipitation Convergence
Figure 1.2 Potential positive and negative feedback loops resulting from large- scale change o f surface albedo, a. Rn = net radiation, Wm'^; H = sensible heat flux
The driver of all climate processes is incoming solar radiation. Consequently, understanding the fate of solar radiation arriving at the Earth’s surface (through retlectance, absorption and/or re-radiation) is the key to understanding many of the major global climate processes. This thesis will concentrate on developments in measurement and modelling of incoming shortwave solar radiation interacting with vegetation. The emphasis is on shortwave radiation i.e. wavelengths from around 350nm up to 2500nm, as the vast majority of the radiant energy emitted from the sun lies in this wavelength range. Figure 1.3 shows the variation of incoming solar radiation with wavelength, in addition to the theoretical blackbody curve for a body at 5900° K (solar surface temperature). The energy distribution is shaiply peaked around 0.55pm, which has driven the evolution of chlorophyll pigments in green vegetation which efficiently facilitate the conversion of incoming solar radiation into carbohydrates used in plant growth.
»"f ' I » T ^ I
E
3 . rvjI
E ? O
S Ol a h C u # v E O t l T S l O C A 7 V i C S P M E R (
l « » « . O i * T t O W C U P V t XT S E A L t V ( L
c i wv c r on 9 L x c K i o o r x r
V CO,
C O .
j " T : I t I ; I [ :
C O ,
0 .2 0 .4 0 .6 O.a 1 .0 1.2 1,4 1.6 1.8 2*0 2 . 2 2 . 4 2 . 6 3 . 5 3 . 0 3.2 W A V E LE N G T H
1.3.2 Shortwave energy budget and albedo
Remote sensing techniques have been applied in a number of areas in an effort to understand the processes affecting the Earth’s climate. One o f the most important of these applications is that of shortwave energy budget studies: the study o f the reflection and absorption of incoming shortwave (SW) i.e. visible and near-infrared (near IR, or NIR) solar radiation at the Earth’s surface, and its subsequent re-radiation into the atmosphere as thermal IR radiation. The role of surface reflectance in the Earth's radiation budget is illustrated schematically in figure 1.4. This demonstrates general mechanisms of solar interaction with the atmosphere and land surface.
Reflection, îscattermg, and Absorption of Incoming Sinilight 4% Reflected Upward Incomiiç Solar Ra<liatioii 6% Scattered Upward 20% Reflected Upward k
f Lost to
J
S])ace T o p o f A tm o sp h ete19% Absorbed in
the Atmosphere
- 16%
Absorbed by Gases’and Dust!
3 %"fjAbsorbed by Clouds
21%
Direct Radiation Absorbed 6% 20% Radiation Radiation
Scattered Reflected Downward Downward^
51% Absorbed at Surface as
Indirect Radiation
Figure 1.4 The fate of incoming solar radiation at the Earth's surface (from www[1.10]).
The absorption of solar energy at the Earth’s surface is the primary driving force behind all climatic processes (Dickinson, 1983). The amount o f energy absorbed at the surface is determined by the surface albedo. Albedo {a) is defined as the ratio between the hemispherical upwelling and downwelling fluxes (F^ and F^) at a point (Wanner et
aA, 1997) Le.
F_
F
Albedo is a unitless quantity lying between 0 (all incoming energy absorbed) and 1 (all incoming energy reflected), and is often expressed as a percentage. Albedo is a measure o f how much o f the radiation incident on a surface is reflected back into the atmosphere, and consequently, how much is absorbed by the surface. If incoming solar radiation is the energy source driving all climate processes, to understand the mechanics o f global climate more accurately it is vital to be able to determine the albedo o f the Earth’s surface as precisely as possible (Henderson-Sellers and Wilson, 1983; Mintz, 1984; Dickinson et a l, 1990). Figure 1.5 is a schematic representation o f the relationships driven by incoming solar radiation, which illustrates the difficulty o f this task. The presence or absence o f surface vegetation and cloud cover, along with atmospheric composition, are some o f the critical factors affecting the rate o f incoming solar radiation and emitted longwave radiation.
A wide variety o f sophisticated numerical models have been developed to represent the circulation and transport processes occurring within the global climate system. Due to the importance o f albedo in determining the amount o f energy absorbed at the lower boundary o f the atmosphere it is desirable that it should be represented as accurately as possible within any general/global circulation model (GCM) (Hall et a l,
1995). Henderson-Sellers and Wilson (1983) provide a detailed review o f the major GCMs in operation at the time and list the variety o f different representations o f albedo that are used within these models. Their conclusion is that subsequent differences between model climatologies (predicted climate outcomes based on a fixed set o f starting parameters) are quite likely due to the differences in albedo. In order to remove these uncertainties, studies to obtain global albedo estimates with an accuracy o f ± 5% should be initiated immediately. Henderson-Sellers and W ilson (1983) also point out that the requirement for accurate estimates o f surface albedo is not a new phenomenon even in 1983, citing the G ARP Joint Organizing Committee report (1975) which concludes that “there is an increasing need for reliable data concerning surface albedo” . More recently, Dickinson (1995) and Bengtsson (1995) have highlighted the continuing requirement for accurate estimates o f albedo for climate models.
Solar radiation
A tm ospheric optical properties
T ransm issivity and reflectivity
N
Cloud cover
Absorbed sunlight
z
Land and water albedo A lbedo "4 ce area
Temperature Snow area
O utgoing IR radiation Precipitation
Latent heat flux
A tm ospheric com position Precipitable
water vapour
Temperature gradient Surface vapour
pressure Soil m oisture
Evaporation
Relative hum idity
Pressure gradient potential energy fluxS ensible heat + V ertical wind
Latitude Horizontal
O cean flux Current
Surface roughness
M ixing
Figure 1.5 An illustration of some of the complex interactions between incoming electromagnetic radiation, the surface and the atmosphere (after Smith, 1985).
Spectral variation of albedo (depending on the physical structure and chemical composition of the surface).
Angular variations o f albedo leading to differences in direct and diffuse albedo. Measured albedo is assumed to lie between the two extreme cases, i) purely directional illumination conditions i.e. assuming no diffuse component o f illumination (clear- or black-sky albedo), and ii) purely diffuse illumination (white-sky albedo). Consequently albedo is estimated as a function of the proportions of direct and diffuse illumination.
Increased estimates of clear- or black-sky albedo due to a scattering atmosphere.
• Heterogeneity o f the surface at various scales.
• Non-linearity o f surface albedo in terms o f spatial scale, necessitating generation o f albedo at the correct scale for the application required (spatial interpolation and averaging are not generally appropriate).
These factors (and a number o f others) combine to make albedo a very difficult parameter to determine accurately. It is still the case, however, as has been widely recognised, that satellite observations provide perhaps the best opportunity to compile global estimates o f surface albedo (Henderson-Sellers and W ilson, 1983; Kimes and Sellers, 1985; Brest and Goward, 1987, W anner et a l, 1997).
1.3.3 Albedo and surface scattering
Albedo describes the ratio o f upwelling to downwelling fluxes, F and F , as expressed in equation 1.1. More exactly, albedo is defined as follows:
/ \ A (^v ’ , ^ )sin 9^ cos e^de^d(j)^
a {x )= \ .--- 1.2
^ LI (^ ,, (j>i, ^ ) s in9. co s9-d9.d(j).
Li(0/, ([)/, X) is the downwelling radiance in the illumination (solar) direction (solar zenith angle 0, and azimuth angle (|),), at wavelength Lt(0v, (|)v, X) is the upwelling radiance from the surface in the viewing direction (view zenith angle 0y and azimuth angle (|)y) at wavelength L t is o f course also dependent on surface reflectance. Because L t is a function o f the angular distribution o f downwelling irradiance, a(À) is a function o f atmospheric state and will be affected by things such as water vapour concentration and aerosol loading. Albedo should therefore not be considered an intrinsic surface property and cannot be measured directly via remote sensing. W hat is required for climate modelling purpose is some average, integrated hemispherical value o f albedo that is independent o f the atmospheric state, and is an intrinsic surface property (Wanner et a l,
1997).
moment any intervening atmosphere between the surface and the sensor). More specifically, some kind o f mathematical model o f the surface scattering behaviour is required. If such a model can be formulated it may be possible to use the model to interpret remotely sensed observations o f the surface radiance. The increasing variety and availability o f remotely sensed data has driven a corresponding increase in the development o f models o f surface reflectance for a wide variety o f applications (Goel, 1988; Asrar, 1989; Myneni e t a l , 1989; Hall et a l, 1995; A ik m g e t a l, 1998; Knyazikhin
et a l, 1998a,b; M artonchik et a l , 1998a,b). This thesis is concerned with one specific
type o f surface scattering model, developed primarily for examining predominantly vegetated land surface types.
1.3.4 Surface scattering and vegetation
o f the primary ways in which this has been achieved has been the development and refinement o f techniques for modelling canopy reflectance {ç>canopy) (Goel, 1989; Privette
et a l, 1997).
If it is possible to compute the radiant energy distribution within a vegetation canopy using a model o f Pcanopy behaviour then a number o f aims may be achieved. It may be possible to compute canopy photosynthetic rates from leaf surface projected irradiances. Hence ç>canopy (the exitant, measurable response o f the canopy to an incident irradiance) may be calculated. This then describes the signal available for measurement from a remote sensing instrument. Models o f Pcanopy rnay also be inverted against remotely measured pcanopy data to enable the estimation o f canopy phytometric attributes and the computation o f absorbed energy (Goel and Strebel, 1983; Goel, 1989; Kustas, 1989; Sellers, 1989; Hall et a l, 1995). Research into remote sensing o f vegetation has long aimed to derive accurate spatial estimates o f important vegetation canopy parameters such as leaf area index (LAI)^, leaf angle distribution (LAD)"^ and fAPAR from observed
Pcanopydata.
Figure 1.6 illustrates some o f the main processes governing radiation transport within a vegetation canopy. These processes must be described accurately in order to
T 1
model Pcanopy bchaviour. Expressions relating I and I in figure 1.6 (upward and downward diffuse radiative fluxes, normalised by incident flux) to observed reflectance can be derived (Ross, 1975). These expressions are based on approximations and assumptions regarding canopy structural properties (3D arrangement o f scattering elements within the canopy), LAI, LAD and cumulative leaf area, as well as radiometric properties (leaf reflectance, p jea f, and transmittance, %/g^). Canopy reflectance modelling
methods are discussed in more detail in chapter 2.
i) Re-scattering of an upward diffuse flux into an upward direction (function of / ^ ).
I
ii) Scattering of a downward diffuse flux into an upward direction (function o f/^ ).
t
iii) Scattering of a downward direct beam flux into an upward direction (related to canopy optical depth and leaf projection amongst other things).
Figure 1.6 Schematic representation o f radiation transport processes within a vegetation canopy (after Sellers, 1989) relating up- and downward diffuse fluxes
within the canopy, I and T.
1.4 Surface reflectance anisotropy
“Research over the past 15 years has conclusively established that the E arth’s
surface is non-Lambertian, and any future analyses, excepting perhaps the most simple
and crude o f approximations, cannot legitimately assume Lambertian properties.
Reflectance anisotropy is significant. ’’
Conclusion drawn by Diane E. Wickland (Manager, NASA Terrestrial Ecology Programme) following NASA workshop on multiangular remote sensing for environmental applications, Jan. 29-31 1997, Univ. Maryland, (in Privette et a i, 1997).
It has long been known that natural surfaces do not in general reflect incident radiation equally in all directions but instead tend to display varying degrees of anisotropy (Minnaert, 1941; Nicodemus et a l , 1977; Hapke, 1981). As mentioned previously, surface reflectance is not only a function o f the spectral and spatial properties o f the incident radiation and target respectively, but also o f the direction from which the surface is illuminated and viewed (Ross, 1981; Goel, 1988; Privette et a l, 1997). The reflectance anisotropy o f a surface is determined by two principal factors. Firstly, the intrinsic directionality o f the spectral reflectance, transmittance and absorptance o f the scattering material. Secondly, anisotropy is a function o f surface roughness, or structure. The latter property is determined by the density and arrangement o f objects on a surface and hence the nature o f the shadowing caused by these objects as a function of illumination and observation angles (Torrance and Sparrow, 1966; Otterman and Weiss, 1982; Li and Strahler, 1986, 1992; Roujean et a l, 1992). Surface structure will tend to cause incident radiation to be reflected more strongly in some directions than others. This dependence o f surface reflectance on viewing and illumination geometry is described by the Bidirectional Reflectance Distribution Function (BRDF). Knowledge o f the surface BRDF can therefore potentially be exploited to provide information regarding the structure of the scattering surface. Clearly, knowledge o f surface reflectance is also vital in order to calculate albedo, which is intimately related to BRDF. This thesis investigates models o f surface reflectance which have been developed recently in response to the need for accurate characterisation o f surface reflectance at global scales.
reflectance data has increased, variations caused by inconsistent viewing and illumination angles has come to be recognised as a serious problem (Leroy and Roujean, 1994; Cihlar
e t a l , 1994).
Problems may also arise within individual scenes. Land surface process and climate modelling requirements have directed many new sensors towards global coverage at lower spatial resolution (of the order o f km per pixel), and away from the high resolution observations o f limited spatial coverage that have been the norm (10s o f m per pixel). This is necessary in order to keep the quantities o f data produced manageable. The wide swaths o f such sensors such as AVHRR, MODIS and POLDER mean that there may be large variations in view angle across any single swath. MODIS for example has a swath width o f approximately 2330km, with a consequent variation in view zenith of around 110° from one side to the other. So there are likely to be directional effects in observed reflectance within MODIS data simply because the viewing zenith angle varies from 0° at nadir to nearly 55° at either edge o f the image. The orbital characteristics o f the sensor also mean that on repeated orbits a particular point on the surface will be observed at a wide range of viewing (and illumination) angles.
Directional effects in BO data were typically ignored until relatively recently. This is exemplified by the widespread use o f AVHRR maximum-value composite (MVC) products (Holben, 1985). It is now recognised that in order to make comparisons of measured surface reflectance across or between scenes, then directional effects must be accounted for (Roujean et al., 1992; Wu et al. 1994; Privette et al., 1997). In examining changes in cover type for example, comparisons must be made between data that may be separated in time by many months, and which may have been measured at significantly different viewing and illumination angles (Cihlar et a l, 1994). In addition to the effects mentioned above, which are often considered as obstacles to be overcome (e.g. Roujean
et a l, 1992; Leroy and Roujean, 1994), the directional nature o f surface reflectance can
Analogous to the manner in which spectral variations in reflectance are exploited via multi-band data, the directional component can be exploited using multi-angle data.
The fact that the directional signature o f remotely sensed surfaces will contain structural information has led to the development o f new missions designed specifically to explore and exploit the directional signal. This signal is not available to sensors that have no directional sampling capability, either through a wide field o f view, a pointing capability or orbital characteristics. Airborne instruments such as the NASA Advanced Solid state Array Spectrometer (ASAS) (Irons et a l, 1991) have been in use for some time (Barnsley et a l, 1997b; Lewis et a l, 1999). On a much larger scale, the MODIS and MISR instruments on-board the Terra platform are both specifically designed to exploit directional variations in surface reflectance (W anner et a l, 1997; Knyazikhin et a l,
1998a,b; Martonchik et a l, 1998a,b). MODIS data exploit the instrument's wide swath and rapid repeat coverage to provide viewing and illumination variation, whilst MISR is has nine fixed cameras, giving four look angles in the along-track direction fore and aft as well as a nadir view. An intermediate instrument is CHRIS (Compact High Resolution Imaging Spectrometer) aboard the PROBA (Project for On Board Autonomy) platform launched in autumn 2001 (Barnsley et a l, 2000; w w w [l.l 1]). CHRIS is a high-resolution (25 to 50m) optical instrument which (uniquely) combines (19) selectable radiometric bands with a pointable multi-angle capability. This variety o f instruments highlights the well-established (and growing) interest in multi-angle remote sensing.
1.5 Thesis outline
programmes such as MODIS and CHRIS, as well as contributing to the understanding of existing algorithms and the development o f new ones.
Chapter 2 contains a theoretical discussion o f BRDF as well as a review of important concepts and developments in surface reflectance modelling. In particular, simple semi-empirical kernel-driven models o f BRDF developed specifically for use with the MODIS sensor are introduced. These models are an important development for near real-time production o f the type o f global, moderate resolution products required for the study o f global climate processes. The kernel-driven models are ju st starting to be used operationally to produce estimates o f albedo and bum scar area from surface reflectance. This thesis explores how these relatively simple models can apparently describe the complex scattering behaviour o f vegetation canopies at a range o f scales. In addition, the nature o f biophysical information contained in the model parameters is explored and potential improvements and extensions o f the modelling concept are proposed.
Chapter 3 is a description o f fieldwork carried out to obtain a variety o f plant canopy data. Detailed 3D models o f canopy structural and radiometric properties are generated from structural measurements and subsequently used to simulate values of canopy reflectance, Pcanopy The simulations o f pcanopy are the basis for exploration and understanding o f the assumptions underlying certain canopy reflectance modelling techniques. Contemporaneous measurements o f a variety o f canopy parameters made during the field campaign are used to validate simulated values o f pcanopy
Chapter 4 describes a set o f experiments intended to establish the validity o f the semi-empirical kernel-driven approach to modelling BRDF. Values o f pcanopy are simulated under the assumptions made in the formulation o f the linear kernel-driven models and the results are used to explore these assumptions. The assertion that pcanopy
can be separated into its constituent scattering components is examined. Results show that the separate components o f simulated Pcanopy do in general describe what they are purported to in the model formulation.
that these assumptions have been tested explicitly, rather than being inferred from the ability o f the kernel-driven models to fit observed reflectance data.
Chapter 6 contains an analysis o f the information content o f the model parameters. Results show that model parameters may contain biophysical information that can be exploited but it may be coupled with other information. This indicates that the model parameters should be interpreted with great care, particularly in the absence of other ancillary information. Model parameters may have an indirect use for analysis such as land cover classification or change detection.
Chapter 7 presents a new extension o f the linear kernel-driven modelling approach into the spectral domain. Such an approach appears to offer significant improvements over current kernel-driven models, which are limited to the angular domain. This is particularly true for the derivation o f products such as broadband (across visible and NIR wavelengths) albedo from narrowband spectral samples. So-called 'spectral kernels' are derived and tested against simulated (and measured) reflectance data.
2 R eview o f B R D F and canopy reflectance m odellin g
Liang et al. (2000a) review the current state o f multi-angle remote sensing following the International Forum on BRDF (IFB), San Francisco, December 1998. They conclude that multi-angle remote sensing, at the threshold o f the EOS era, is now yielding data which are set to provide unique insight into surface biogeophysical processes.
Radiation reflected from the Earth’s surface is characterised by a small number of key signatures (or domains o f information) (Gerstl, 1990; Liang and Strahler, 1994);
1. Spectral (1): reflectance, transmittance and absorptance response o f canopy elements to radiation of different wavelengths (Jacquemoud and Baret, 1990; Curran et a l, 1992).
2. Spatial (x, y): e.g. spatial structure at the macroscopic level (objects are much larger than the wavelength o f incident radiation), arrangement o f scattering objects on a surface, appearance o f target at different scales, adjacency, mixed pixels (Woodcock et a l, 1988).
3. Temporal (t): e.g. seasonal change o f vegetation growth profiles; inter-annual variability o f vegetation quantity (Myneni et a l , 1997).
4. Angular Q(0v, (|)v), Q ’(0/, (|),): reflectance anisotropy caused by surface structure e.g. hotspot - the peak o f reflectance in retro-reflection direction (viewing and illumination vectors, Q and Q ’, are near coincident) (Ross, 1981; Kuusk, 1985).
5. Polarization p((|)): e.g. polarization information contained in surface reflectance signal (Vanderbilt et a l , 1985; Deschamps et a l, 1994).
The intrinsic surface reflectance is a function o f all o f these signatures, but differs from the signal measured at the sensor due to the effects o f atmosphere, sensor response etc. Exploration o f the first three signatures above has formed the basis o f conventional remote sensing (Goel, 1988; Gerstl, 1990). The fifth component has only been deliberately exploited recently with the advent o f the (now-defunct) POLDER, and forthcoming POLDER II instruments (Deschamps et a l , 1994; Leroy et a l , 1996). The sixth component has also been exploited only relatively recently: LiDAR is currently being explored as a new method o f obtaining information on surface properties, particularly vegetation canopy structure (www[2.1]). Phase information from RADAR instruments can be used to determine information regarding the structure and scattering behaviour o f the surface (Sun and Ranson, 1995; Saich et a l, 2001).
The directional signal (4) has historically been one o f the least exploited o f these signatures (Goel, 1992; Liang and Strahler, 1994; Myneni et a l, 1995; Privette et a l,
1997) and was until relatively recently mostly ignored. Barnsley et a l (1997a) have shown that multiple view angle (MVA) data contain information entirely separate from the spectral component o f measured reflectance. This indicates that the directional signal can be used to distinguish between cover types purely on the basis o f surface structural detail, even where spectral responses are identical (Asner, 2000). This thesis is primarily concerned with the information content o f the directional signature, but also examines the possibility o f extending and including spectral information into simple directional modelling methods.
Considering the reflectance signal from a vegetation canopy, Goel (1992) extends the description by Gerstl (1990) given above to propose the following functional description o f the relationship, R, between the measured spectral directional reflectance p o f a vegetation canopy, and the parameters controlling that signature:
p = R{X, t, {x, y), (Q, 0')> P, dT; C) 2.1
p (at given values o f X, t, (x,y), (Q, Q ’), dT, P) i.e. to invert (or understand) the canopy parameters from the relationship in equation 2.1.
The development o f EO as a powerful tool for monitoring and mapping the global environment has been introduced in chapter 1. This chapter discusses the implications o f the anisotropic nature o f surface reflectance under variable viewing and illumination conditions. The potential for exploitation o f the directional nature o f surface reflectance through the application o f canopy reflectance models is explored. Mathematical techniques for the inversion o f such models against measured reflectance data are introduced. Following this a review o f some o f the many available canopy reflectance modelling (CR) techniques is undertaken. The conclusion o f this is the introduction o f a particular class o f canopy reflectance models, developed for their simplicity and effectiveness, which are to be used to derive products from forthcoming sensors such as MODIS and MISR. Experimentation in subsequent chapters explores the potential for these models to extract information regarding vegetation canopies from reflectance data in practice.
2.1 Factors affecting surface reflectance anisotropy
The size, shape and distribution o f objects on a surface have a direct impact on the nature o f the radiation scattered from the surface (Hapke, 1981, 1993). The measured reflectance signal is therefore a function o f surface structure. Vegetation is one o f the most important absorbing/scattering land surfaces that can impact a remote sensing signal (Asrar, 1989; Myneni and Ross, 1990; Sellers, 1992; Asner, 1998). Examples of important biophysical parameters such as LAI, fAPAR and albedo, which are used by ecologists, climatologists and remote sensing scientists to describe the quantity and influence o f vegetation, were introduced in the previous section.
to variation in key structural characteristics o f vegetation, soils and atmospheric constituents". For these reasons, much emphasis has been placed on attempting to understand how vegetation can be detected and monitored from remote sensing measurements. One of the primary ways in which this has been achieved has been the development and refinement of CR modelling techniques (Allen et a i, 1970; Ross, 1981; Goel, 1988; Asrar, 1989; Privette et a l, 1997; Strahler, 1996).
It is well-known that natural surfaces are generally not Lambertian reflectors (i.e. reflecting incident radiation equally in all directions), but will tend to display varying degrees o f anisotropy (Minnaert, 1941; Nicodemus et a l, 1977; Hapke, 1981). Surface reflectance is therefore not only a function of the spectral, spatial and polarising properties of the target, but also of the direction from which the surface is illuminated and viewed (Ross, 1981; Goel, 1988). Measured reflectance (as opposed to the intrinsic surface reflectance) will also be dependent on the spectral and directional nature o f the irradiance. The directional nature of surface reflectance is illustrated in figure 2.1.
O
O
(a)
o
(c)
(b)
o
(d)
Figure 2.1 Four examples o f surface reflectance: (a) Lambertian reflectance (b) non-Lambertian (directional) reflectance (c) specular (mirror-like) reflectance (d)


![Figure 1.4 The fate of incoming solar radiation at the Earth's surface (fromwww[1.10]).](https://thumb-us.123doks.com/thumbv2/123dok_us/8380679.1384637/26.595.80.452.251.569/figure-fate-incoming-solar-radiation-earth-surface-fromwww.webp)


