Survey for Regulating Bus Services using
Commuters Density
Nikita.VShahane1, Rutuja Pande2, Rutuja Narkhede3, S.R Vispute4
Students, Dept. of Computer Engineering, Pimpri Chinchwad College of Engineering, Pune University, India1,2,3 Professor, Dept. of Computer Engineering, Pimpri Chinchwad College of Engineering, Pune University, India4
ABSTRACT:This paper presents survey for regulating the bus services using commuters density. Transportation has become one of the persistent requirements of the people in day to day life. This has led to improper management of available bus resources. Moreover, the frequencies of the buses are unregulated. This kind of chaos is mainly caused by irregular planning of bus intervals and not knowing the details of the number of passengers expected at a time. Achieving full transformative potential from the use of resources in this increasingly digital world requires both new data analysis algorithms and new generation of systems. This paper presents the survey on the existing system and proposes the idea for regulating the frequency of buses, calculation of delay and bus fare estimation. We present services to perform various analysis operations namely bus frequency, bus delays and bus fare estimation.
KEYWORDS:Optimization; Data Analysis; Bus Frequency Analyser; Delay Analyser.
I. INTRODUCTION
Analysis of bus data to regulate the bus services depending on the commuters arrival resulting into optimization of the resources[1].
Motivation:
Irregular planning of bus intervals.
Frequency of the buses are unregulated, either the buses are lined up at one time or buses get delayed for a long time.
Not knowing the details of the amount of commuters expected at a time.
Risk of accidents in the overcrowded buses.
Objective:
The main goal of this paper is the analysis of bus data and regulating the bus services effectively.
Creates an efficient multi-modal public transportnetwork that will facilitate the commuters as well increase the economic efficiency of the entire bus management system.
Also delivering an efficient, safe and sustainable way of transportation to the commuters.
Satisfy mobility needs via more efficient and integrated use of the existing system.
Through this paper the operations of bus-transport systems can be significantly improved by monitoring.
The main purpose of this system is optimization and data analysis which are stated as follows:
Data Analysis is a process of cleaning, transforming,inspecting and modelling data with the goal of discovering useful information, supporting decision-making and suggesting conclusions [10].
Optimization is a process or methodology of making something as fully perfect, functional or effective as possible[10].
II. LITERATURE SURVEY
A. Different Authors Review :
the GSM send the RFID tag data back to the base station using AT89S52 microcontroller. In this way the tracking the location of the bus is done[4].
Also there is a system designed for the bus management system using ZigBee and GSM/GPRS. The basic functions of the public transportation is implemented, such as monitoring the arrival and departing time of bus, reporting stations name automatically, etc.[2].
As well, using gossip algorithm, the passenger population is monitored and the resources are allocated efficiently in a cost effective way with the help of cloud computing for dynamic resource allocation[1].
B. Interaction with Depot Manager :
The public transport management system which is currently used indicates improper management of bus services. Almost all of the work is done manually. The Depot employees take minimum three to four days for the survey of bus management system. To schedule the bus services in new are, the employees of Depot personally visit that area and survey it for few days so as to check whether is it really needed to start the bus service in that area.
First the Depot employees do survey by physically visiting that region, after that this request is sent to Depot manager. The Depot Manger then forward this request to the head office or Main Depot. For all this process and to come to conclusion it takes maximum one month for decision making.
Bus delay could be caused by a seriesof factors, for instance, traffic congestion, overload of passengers,trafficaccidentand other unpredictable situations.Due to delay in buses the commuters face problems as they have to reach the destination on time, the drivers of the buses face problems because of delay in the first trip they can’t go on time for the next trip. As time management is an important factor in this digital world due to delay in one thing rest all work gets delayed.
Therefore, choosing crucial elements to efficiently evaluate the bus delay is a complex problem in bus delay researches and management system.
There is no proper analysis done resulting the government in loss as well as improper services to the commuters. Without a well deployed monitoring system, it becomes very difficult to plan for the optimization and the growth.
All the above limitations of the existing system can be sorted out by the system which uses data analysis algorithms to monitor commuters’ density and regulate the frequency of the buses. Also delay algorithm can be used to find the delay and update the schedule accordingly.
C. Proposed System:
The objective of our proposed system is as follows:
To find the commuters density using ticket count and bus pass count.
Regulate the bus frequency depending on the commuters density.
Create a web based application to calculate the density of commuters and regulate the buses by increasing the flow of buses to highly populated stops and reducing the frequency at less populated stops.
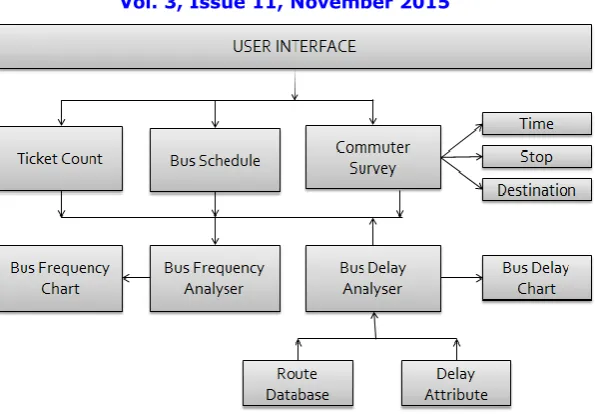
Fig 1. Block Diagram of Proposed System
Our system is divided into three modules:
A. Bus Frequency Analyser:
This module represents the analysis of the bus data for regulating the bus frequency. Basically, in this the frequency should be altered according to the requirement.
The analysis is done on the basis of following sub modules: i. Ticket Counter
ii. Route and Schedule Details iii. Passenger Survey Form
The above sub-modules are used as input to analyse the data and give a graphical format output of buses allocated on the route and the actual number of buses that should be allocated. This will give efficient distribution of the flow of the buses on the required route and hence reduce loss as well as give proper public service.
Fig 2. Bus Frequency Analyser
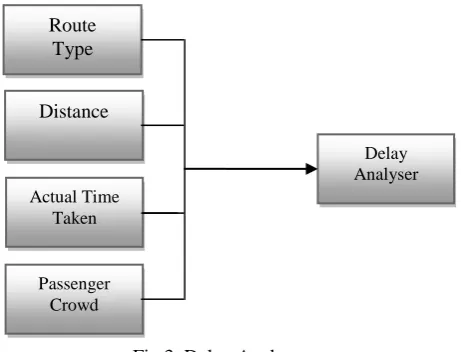
B. Delay Analyser:
The operations carried out in Delay Analyser are detection of bus delays, likely cause of the delay and prediction of likely arrival time of buses at the bus-stops.
In this module we are considering the following attributes: Ticket
Counter
Route and Schedule Details
Passenger Survey Form
i. Route type ii. Distance
iii. Actual time taken iv. Passenger crowd
The above attributes are used to calculate the bus delays. This information will be useful for both the commuters and bus operating authorities.
The commuters can be benefited from the information such as current bus location, expected time of arrival of a bus at bus-stop, availability of seating space in the buses, etc.[5].
The information gathered can be used to infer 0likely causes behind the observed bus delays, the bottleneck traffic junctions, heavy traffic time slots, and make appropriate scheduling recommendations[5].
Fig 3. Delay Analyser
C. Fare Estimation:
In this module we are calculating the fare obtained from the tickets collected. We are verifying whether the obtained fare is equal to the estimated fare or not. This reduces the fraud cases which the employees can opt for doing it.
Fig 4. Fare Estimation
This proposed system will overcome all the limitations of the existing system. The cost of the product also reduces as there are no any hardware tools except a personal computer and an internet connection. The overhead of the commuters’ as well as the bus operating authorities will be reduced. This system will result in to efficient management of resources and regulating the bus services properly also providing the public service in efficient way.
III. PROJECT SCOPE
This paper is mainly focused on small region for the analysis. It can also be extended for all over India Government Bus Management System. It can also be used as relevance for developing system for Taxi Car Services or other public transports.
IV.MACHINE LEARNING TECHNIQUES
This problem statement is solvable in non-deterministic polynomial time and hence it is an NP-Complete Problem. If the routes get extended to a large amount this problem gets converted to NP-Hard Problem.
Route Type
Distance
Actual Time Taken
Passenger Crowd
Delay Analyser
Fare Collected
The different techniques to solve the problems are as below:
A. Time Series Analysis:
Time Series Analysis consists of methods to analyse the time series data so as to extract the characteristics of data and meaning full statistics [10].
B. Regression Analysis:
Regression Analysis is a statistical process that includes techniques for analysing several variables, when the focus is on relationship between a dependent variable and one or more independent variable [10].
C. Associative Analysis:
Associative Analysis is a research method for discovering relations between variables in large database [10].
D. Clustering Analysis:
Clustering analysis is the task of grouping a set of objects in such a way that objects in the same group are more simitar to each other than to those is other groups [10].
.
E. Decision Tree Analysis:
A decision tree is a decision support tool that uses a tree like graph or model of decisions and their possible consequences, including chance event outcomes, resource costs and utility [10].
F. Segmentation Analysis:
Segmentation Analysis divide the data into groups, or clusters, of items that have similar properties [10].
G. Sequence Analysis:
Sequence Analysis summarize frequent sequences of episodes in data such as Web path flow [10].
V. FUTURE WORK
As bus management system is very vast. There are many factors in this which we can implement in future. Some of the important factors are: finding the overlapping routes and altering the bus frequencies as necessary, calculating the maintenance cost etc. By finding overlapping routes we can increase or decrease the frequency of buses on that route and get the profit for the government, also proper bus service to commuters.
VI.CONCLUSION
The proposed system can be used for regulating the bus services and generate optimized schedule. Different machining learning techniques are for the analysis purpose. This analysis will benefit to the commuters as well as the government bodies. Commuters will get the efficient services and the government will be profited by proper regulation of bus services.
REFERENCES
1. Ranjith Ramesh, YokeshEzhilarasuPrasannaRavichandran and Soma Prathibha, Member, IACSIT “Regulating Bus Management System Using Cloud
Platform”, International journal of e-education, e-management and e-learning, Vol. 2, No.6, December 2012.
2. LV ZHIAN HU HANPhysics & Electronics Information Technology Department XiangfanUniversity Xiangfan, China “Bus Management System Based on ZigBee and GSM/GPRS”.
3. M. A. Hannan, A. M. Mustapha, A. Hussain and H. Basri, “Intelligent Bus Monitoring and Management System”.
4. Komal Satish Agarwal Computer Department MIT College Of Engineering, Pune, India “RFID Based Intelligent Bus Management and Monitoring System” 5. Ankit Kesharwani, VaishaliSadaphal,MaitreyaNatu “Empowering Bus Transportation System Using Wireless Sensor Networks” Indian InstitueOf Technology,
Kanpur, Tata Research Development and Design centre, Pune, India.
6. Hamilton, P and Suresh, S (2013). "Intelligent Agent based RFID System for On Demand Bus Scheduling and Ticketing", International Journal of Future Computer and Communication, Vol.2(5), pp.399-406.
7. Li Zhang, Xi Ren, “A two-factor evaluation of bus delays based on GIS-T database and simulation”. University of Gavle, May 2010. 8. “Advanced Transportation Management technologies-TransitManagement system.”