publisher policies. Please scroll down to view the document
itself. Please refer to the repository record for this item and our
policy information available from the repository home page for
further information.
To see the final version of this paper please visit the publisher’s website.
Access to the published version may require a subscription.
Author(s): JAMES S. ADELMAN and GORDON D. A. BROWN
Article Title: Methods of testing and diagnosing model error: Dual and
single route cascaded models of reading aloud
Year of publication: 2008
testing and diagnosing model error: Dual and single
route cascaded models of reading aloud.
Journal of
Memory and Language, 59, 524-544.
www.elsevier.com/locate/jml
DOI:
10.1016/j.jml.2007.11.008
Running head: ANALYZING MODEL ERROR IN THE DRC
Methods of Testing and Diagnosing Model Error:
Dual and Single Route Cascaded Models of Reading Aloud
James S. Adelman and Gordon D. A. Brown
University of Warwick
12,292 words.
Corresponding Author:
James S. Adelman
Department of Psychology,
University of Warwick,
Gibbet Hill Road,
COVENTRY,
CV4 7AL,
UK.
Telephone: +44 (0) 24 7615 0233
Abstract
Models of visual word recognition have been assessed by both factorial and regression
approaches. Factorial approaches tend to provide a relatively weak test of models, and
regression approaches give little indication of the sources of models’ mispredictions,
especially when parameters are not optimal. A new alternative method, involving
regression on model error, combines these two approaches with parameter optimization.
The method is illustrated with respect to the dual route cascaded model of reading aloud.
In contrast to previous investigations, this method provides clear evidence that there are
parameter-independent problems with the model, and identifies two specific sources of
Methods of Testing and Diagnosing Model Error:
Dual and Single Route Cascaded Models of Reading Aloud
The ideal of modeling cognitive processes involves testing the consequences of the
processes conjectured in models against behavioral data. In the context of visual word
recognition, where many of the relevant predictors are properties of words, two approaches
have emerged to testing such models. The first is a factorial approach in which the
question is whether a model can simulate some set of empirically obseved significant
effects. The second is a regression approach in which the regression performance
(correlation with data) of the model’s behavior is compared to a regression equation with
the relevant predictors.
Coltheart, Rastle, Perry, Langdon, and Ziegler (2001) applied both approaches to
the assessment of their dual route cascaded (DRC) model of reading aloud. This model
incorporates a lexical (vocabulary-based) interactive-activation (IA) route and a
nonlexical (spelling-sound rule-based) route that interact (collaborate or compete) to
generate pronunciations. They argued, primarily on the basis of the results of the factorial
approach, that “the DRC model is the most successful of current computational models of
reading” (p. 251). They also argued that “if there is no other theory that ... [is] both
complete and sufficient, resting on laurels is a reasonable thing to do until the emergence
of a competitor.” (p. 204). It is our contention that neither the factorial approach nor the
regression approach nor their combination, as currently applied, is adequate to
demonstrate that a model is sufficient to explain effects or data. One reason is that the
parameters — numerical values defined to control the operation of a model without a fully
specified relationship with independent variables — used in such analyses are not chosen
to be optimal for the data set in question; in consequence, the criterion for sufficiency is
In this paper, we (i) set out the problems with the existing approaches; (ii)
introduce a method of combining the two approaches with optimal parameter selection
that resolves several of these problems; (iii) describe the DRC model and our optimization
of its parameters for the Spieler and Balota (1997) data set, which was among those
examined by Coltheart et al. (2001); (iv) demonstrate the theoretical leverage the
approach can obtain with the application of the technique to the DRC; and (v) discuss
issues surrounding the analyses, including the data collection strategies that support the
method. We choose the DRC model for this exposition for three reasons. First, this model
is a complete model of reading aloud that appears to be able to account for a relatively
wide range of effects, indeed one that is wider than other models, and thus is in need of
strict testing. Second, the model is relatively well-suited to the approach described here.
Finally, Coltheart et al. have argued against using the optimization of parameters and in
favor of a pure factorial approach, despite some examination of regression approach results.
The Factorial Approach
The factorial approachto deciding whether a model is adequate to explain a
particular cognitive process is to generate a list ofeffects (including interactions) that one
has reason to believe occur in the task of interest, and then determine whether the model
can predict the direction of these effects correctly.
Coltheart et al. (2001), for instance, list 18 effects in word naming for which their
model can account, and of these, six relate to a standard word naming task (i.e., involve
neither nonwords nor priming): (i) regularity, (ii) frequency, (iii) their interaction, (iv)
position of (first) irregularity, (v) rime consistency, and (vi) length. One further effect in
standard word naming that Coltheart et al. attempt to account for with their model is the
does not predict an effect of orthographicN, but that an alteration to one of the
parameters causes the model to predict such an effect. Thus it was demonstrated that the
DRCcan predict an orthographic N effect.
Suboptimal Parameter Sets.
This change in parameters to account for orthographicN effects raises the first problematic issue for the factorial approach: Whether and when it is appropriate to
simulate each data set with different parameters. Coltheart et al.’s (2001) assert that they
“would in any case not be interested in an approach in which each set of human data is
simulated with a different set of DRC parameters” (p. 218). However, the DRC model is
supposed (through parameter changes) to account for (i) strategic effects that are caused
by changes in the stimulus list (see also Rastle & Coltheart, 1999) and (ii) individual
differences (arising from the strengths of the different routes). Since each set of human
data presumably comes from a different experiment with different items and participants,
it is hard to see why the parameters should not be different. Indeed, we would argue that
if one is following the good practice of seeking to disconfirm proposed theories, it is
necessary to optimize parameters in order to avoid the contention that the chosen
parameters are at fault, rather than the mechanisms of the model under test.
Incompleteness of Data.
A corollary of the specificity of parameters to experiments is that the results of any
given experiment speak only to the existence of some pattern under the specific conditions
(and hence parameters) of that experiment, and not to those of another experiment. For
instance, Coltheart et al. (2001) suggest that “it will be necessary to study whether the
DRC model can yield a beneficial effect ofN on word naming through a modification of the parameter set that does not compromise its successful simulation of the other effects”
irregularity effects will occur together in one experiment, and their model should account
for such a pattern. However, whether such an account is in fact desirable depends on a
number of empirical questions because these effects have previously been demonstrated in
different experiments, with different items and different participants. This means the
effects could be compatible with two different parameterizations of the correct model.
That is, in the absence of a data set demonstrating the combined pattern, it might yet be
the case that these effects are mutually exclusive, and a model could be correct to predict
them only with different parameter sets. Whilst this particular example could be resolved
with an experiment with both position of irregularity andN as factors, any single such experiment would not solve the problem for other pairs of predictors, nor triples,
quadruples and so on. Factorial designs with few factors will thus lead to ambiguities as to
whether sets of effects should co-occur with the same parameters. Attempts to include
more factors will include increasingly many items if the experiments are not to lose all
their power. These items will necessarily be less well controlled (seeItem Selection below),
the analysis will tend therefore to rely on statistical partialing (i.e., regression) — and
note that has already been the case for at least one study of the main effect of position of
irregularity (Rastle & Coltheart, 1999) — and generally increasingly resemble the
regression and mega-study approach.
Ignorance of Effect Magnitude.
The intercept and slope of the linear equation linking model cycles (response latency
in the model) to observed experimental response latencies are parameters that often
change in a hidden fashion when the factorial approach is used. Although such changes
will not change the significance of any effect in the model, the fit of the model should be
considered somewhat suspect if, say, (in a single experiment) a significant 10ms effect of
one variable corresponds to significant two cycle difference in the model, and a significant
model (cf. Norris, 1994; Reynolds & Besner, 2004; Besner & Borowsky, 2006).
Difficulty of Detecting Effects.
It is anyway the case that the set of significant effects for a correct model is not
necessarily the same as that for the data, as model predictions are often relatively stable
measures of central tendency. This occurs when the argument is made that the model
predicts an effect that appears absent in data. For example, Siakaluk, Sears, and Lupker
(2002) and Sears, Campbell, and Lupker (2006) have criticized the multiple read-out
model (Grainger & Jacobs, 1996) for predicting an inhibitory effect of higher-frequency
neighbors that is not observable with stimuli in English. The problem arises because (as
will be shown below in the case of the DRC) model predictions have smaller standard
errors than data, and so conventional tests have more power to detect effects in models.
Using the combination of a significance test on the model and another on the data may
therefore lead to a liberal criterion for rejecting models because a difference in significance
need not correspond to a difference in magnitude of effect. Frost, Kugler, Deutsch, and
Forster (2006) have, for instance, criticized models with alphabetic lexical organization for
predicting facilitatory priming from orthographic neighbours when 12 experimental
conditions (across seven experiments) yielded no significant facilitation (although the
mean effect across these 12 conditions was 6.5 ms with SE 0.66).
One can only be confident that inferenece on the basis of the results of such a pair
of significance tests will not lead to error is where both tests are significant with different
sign of effect. Rastle and Coltheart (1998), for instance, rejected the DRC-G (a variation
of the DRC with the nonlexical route timed by whole graphemes rather than letters)
because it predicted faster responses for stimuli containing multi-letter graphemes, and
slower responses were empirically observed with such a manipulation (on nonwords).
Relying solely on such cases would be hyper-conservative on three counts: (i) only
(item-by-item) paired nature of prediction and data; and (iii) the implied solution to the
Behrens-Fisher (heterogeneity of variance) problem has size (Type I error rate) distortion
due to overestimation of the standard error.
Item Selection.
A related issue in applying the factorial approach to psycholinguistic tasks is in
selecting stimuli to realize contrasts of theoretical interest. It is at best difficult to select
words that differ only on the lexical variable(s) of interest, and not on some other variable,
especially for variables that are highly correlated (Cutler, 1981). This exacerbates the
difficulty that one cannot know whether one’s list of effects is complete, as comparisons
based on few items lack power in by-items analyses. Moreover, one can only know about a
failure to fit the data that is related to absence or presence of effects that have been
designed into the experiment. Poor predictions for particular words will not be
distinguishable from chance variation. It is not possible to identify a set of words included
in the experiment for which the model does particularly badly, unless it is due to a
contrast of interest designed into the experiment. Despite the modeler specifying
quantitatively all the predictions of the model, it is still necessary for an experimenter
testing the model to have some degree of analytic knowledge regarding the qualitative
predictions of the model in order to generate a useful design. Therefore, existing data
from factorial experiments have limited capability to guide new hypothesis-generation.
Summary of Problems with the Factorial Approach.
In summary, the factorial approach offers the promise of rejecting models when they
do not accommodate observable effects and allows the direct evaluation of whether a
model proper can explain effects via confound, but in its application to models proper, (i)
the argument is often available that parameter changes might correct the apparent misfit;
that have not occurred in factorial designs; (iii) relative magnitude or importance of
effects is not usually tested or testable; (iv) the method is hypersensitive in that it may
reject models that predict effects that are present but difficult to detect in data (because
of low power); (v) confounds are hard to avoid (although this is mitigated by the fact that
a correct model will correctly predict the results of a confounded experiment anyway); and
(vi) the list of effects may be incomplete, even in relation to collected data, meaning that
success for all the known effects does not necessarily correspond to accounting for the data.
The Regression Approach
The regression approach, by contrast, evaluates correlations between model
predictions and data on an item-by-item (word-by-word) basis. The worst case for a
model is when its predictions fail to significantly correlate with the data. Besner, Twilley,
McCann, and Seergobin (1990) described cases where this is true of the Seidenberg and
McClelland (1989) model, for instance. A model’s correlation can also be compared to the
multiple correlation of a number of variables of interest: If the model’s correlation is
smaller, then it cannot be explaining the effect of all the variables in the regression model.
Spieler and Balota (1997) examined the models of Seidenberg and McClelland and Plaut,
McClelland, Seidenberg, and Patterson (1996) on such a basis, and found that they do not
account for all the effects of log frequency, length and N. Besner (1999) also examined the performance of these two models as well as the lexical route of the DRC on the basis of
naming latencies for 300 words; he drew similar conclusions for the Seidenberg and
McClelland and Plaut et al. models, and found that the DRC’s lexical route came close to
accounting for the same amount of variance as these three effects, accounting for
approximately 13% of the variance, where these effects accounted for 15%.
Coltheart et al. (2001) assessed their DRC model in the same fashion against the
Spieler and Balota (1997) data set, among others. They found that the predictions of the
model could account for only 3.49% of the variance in this human naming latency data
set. It therefore appeared that the DRC model also does not quantitatively account for all
the effects of log frequency, length andN, as these three variables together can account for in excess of 20% of the variance in these data. Again, it is of course perfectly
reasonable to assume that another set of parameters would yield improved prediction, as
the parameters used were chosen by hand. Indeed, we will show below that this is the
case. It is plausible that changing the parameter set might recalibrate the strengths of
these effects, which appear to be present according to the factorial approach, so that the
model can simultaneously account for their effects in the correct proportions.
Absent Effects.
Nevertheless, even were there continued subcriterial fit after parameter
optimization, it would be essentially impossible to determine from this type of regression
(alone) where precisely the model is at fault. One reason is that the locus of fault need
not be among the predictors in the regression. If the model predicts an effect that is
absent in the data this will cause shrinkage of the observed proportion of variance for
which the model accounts, since a greater proportion of the model’s variance is due to this
apparent noise (apparent, because it is in fact bias). For instance, suppose that the only
factor affecting some lexical task were word frequency, but we had a model that (by some
non-transparent mechanism) predicted not only an effect of word frequency but also a
strong effect of length. Such a model could readily be shown to correlate poorly with
response times, and indeed more poorly than word frequency alone. The inclusion or not
of length as a predictor in the regression on the data would not affect these results, and its
inclusion would be contraindicated by a non-significant effect. Nevertheless, it would be
recognized as faulty. As with the factorial approach, analytic model knowledge is useful.
Moreover, if one looks at the error in prediction of individual words, it is unclear which of
the large errors are due to noise and which are consistently misestimated, so the data do
not give direct guidance in finding these absent effects.
Absent Variables.
Moreover, many more factors can be added to regressions on Spieler and Balota’s
(1997) data, as Balota, Cortese, Sergent-Marshall, Spieler, and Yap (2004) have done to
assess several effects, but comparing total variance accounted for by the regression to that
by the psychological model would only complicate the problem of finding where a model
does and does not succeed. Further, even were some model to exceed the criterial
proportion of variance for which it is known to be necessary to account, this does not
imply that there is not serious misfit for any of the items in the data, only that the misfit
is less than that for the known predictors. The criterion for misfit would nevertheless be
stricter than with the factorial approach.
Model-Specific Analyses.
One way that Coltheart et al. (2001) attempted to use the regression approach to
identify possibly useful modifications to the DRC model is a comparison of the quality of
its predictions for words and nonwords for the data of Weekes (1997). The model makes
considerably better predictions for the nonwords than the words of Weekes’ experiment.
Coltheart et al. reasoned that this is indicative of problems in the lexical route, which
uses word-specific information, rather than the nonlexical route, which processes stimuli
using spelling-sound correspondences, since the lexical route contributes to word naming,
but less to nonword naming. This pattern does not necessarily indicate that the nonlexical
route operates entirely correctly for nonwords, let alone for words, and indeed for words, it
the presence of well-matched stimuli, incurring some of the problems of the factorial
approach. Even were this the case here, as a methodology for theory testing, this type of
analysis cannot be general, since few models truly operate in the necessary gated fashion.
Summary of Problems with the Regression Approach.
In summary, the regression approach offers the promise of rejecting psychological
models when they perform less well than simple regression models based on observable
effects. However, (i) any failure may be attributed to suboptimal parameters; (ii) the
version of this approach discussed so far (as used by Besner et al., 1990; Spieler & Balota,
1997; Balota & Spieler, 1998; Coltheart et al., 2001) does not permit localization of
problematic predictions; (iii) the criterion derived from any list of effects is too low if the
list of effects is incomplete; and (iv) strategies such as comparing regressions for different
item groups are applicable in model-specific cases that occur rarely if at all.
An Approach to Diagnosing Models
Optimized Parameters.
Can the problems of the factorial and regression approaches, as they are currently
applied, be rectified? The changes that are needed are not revolutionary. The “optimal
parameters” problem — that better parameters might rectify any apparent misfit — is
common to both approaches and is a severe obstacle to progress via theory refutation or
refinement, but has an obvious solution. Although optimizing parameters for complex
models, such as the DRC, is computationally expensive, doing so will necessarily overcome
this artificial barrier to falsification.
A theoretical objection to optimizing parameters made by Coltheart et al. (2001) is
that if performed on a case-by-case (experiment-by-experiment) basis, then one may
obtain different parameters to explain different effects, even if these effects co-occur. As
magnitudes are empirical issues. They can be resolved by considering a larger dataset that
can be used to evaluate both, or preferably, all and any effects of interest. Then analyses
can be performed on both model and data to identify predicted and actual effects. Where
a failure for the model to simulate the data occurs, it cannot be due to incorrect
parameters, as any change in the parameters necessarily will be at the detriment of some
other aspect of the fit, to the extent that the overall fit to the data is relatively
compromised. Moreover, availability of higher powered technology can overcome technical
difficulties that might prevent such optimization.
Regressing Model Predictions.
So, if optimal parameters are chosen, it becomes possible with relative certainty to
detect some levels of failure using the regression approach, when the fit (e.g.,R2) of the model does not reach the levels of a regression with known factors. Loci of failure can
then be identified using a combination of the factorial and regression approaches: From
the factorial approach, we take the idea of treating the model predictions in a manner
comparable to that of the data, but in the manner of the regression approach, the entire
set of data is analysed, with the variables that would otherwise have been experimentally
controlled entered as covariates. Such analyses are much more powerful than those created
by selection of items, as they use more data points, and discard fewer data (because they
avoid the imprecision of creating discrete categories). This is especially important to
counteract the reduction in power due to variance inflation in cases where highly
correlated predictors are considered, and such cases can be theoretically important. A
further important advantage is that unusual or unexpected contrasts may also be tested
without the difficulties of selecting novel controlled stimuli.
The use of a regression model to examine the fit of the model to the data also helps
resolve the issue of the relative magnitudes of the effects. Not only will an inability of the
inferior, but examination of the regression coefficients could reveal which effects are
relatively too strong or too weak in the predictions.
Regressing Model Error.
In addition to the point that effect magnitude is important in identifying
problematic predictions, a key issue in comparing a psychological model to data is that the
model may predict a significant effect that is not significant in the data, but only due to
differences in power. The proposed approach addresses both of these problems directly by
examining the regression equations for the difference between the model predictions and
the data points, that is, the model’s error. If the model and data regression coefficients
differ, and a factor is a significant predictor of model error, then we can infer that the
model is wrong in some aspect associated with this factor (although not necessarily
directly). Moreover, localization of problems to a specific aspect of the data may not
localize them to a specific, readily modified, aspect of the model, as changes to the model
could greatly affect the optimal parameters in the unchanged components of a model, due
to an alteration in the optimal division of labor. If several problems are indicated, they
may all share a single root cause in the structure of the model. A direct modification to
resolve one such problem might then simultaneously solve the other problems. However, a
targeted modification to another part of the model to solve a different problem might only
introduce more problems. Nevertheless, some indication ofhow the model fails to capture
the data will be of use in determining future theoretical steps.
The Illustration of the Technique
We will now proceed to demonstrate the proposed new approach with reference to
the Coltheart et al. (2001) DRC model. An alternative single-route (SRC) model that
consists only of the lexical route (unchanged from the DRC) is also used; this allows us to
augment interactive-activation (IA) models of this kind.
The Dual Route Cascaded Model
The DRC model is a computational instantiation of dual route theory by Coltheart
et al. (2001) involving some assumptions that are unique to versions of this theory
associated with Coltheart and colleagues. Its lexical route is an extended (horizontally
generalized) and modified version of the IA model of McClelland and Rumelhart (1981).
This is supplemented by a non-lexical all-or-nothing grapheme-phoneme conversion (GPC)
rule route. We will briefly describe the operation of the DRC model; readers are referred to
the original paper for a more complete explanation. Where some aspects of its operation
are not described in the original paper, these have been reverse-engineered from the
operation of the implementation of the model that Coltheart et al. have made available.
Feature Level
The feature level consists of 8 sets of units of the type described by Rumelhart and
Siple (1974); each set consists of 14 pairs of feature-present and feature-absent units. In
each pair, if the feature is present, the feature-present unit takes the value one, and the
feature-absent unit the value zero, with the pattern reversed if the feature is absent. They
are not influenced by the activations of any other units, only by the stimulus presented to
the model, and they are the only component of the model directly influenced by the
stimulus. Words are left-justified when presented to the model.
Letter Level
The letter level consists of 8 sets of 27 units representing the 26 letters of the
English alphabet and one extra for “absent”. The activation of units in this level, ai(t) for
unit ion time tickt is governed by Equation 1:
subject to the constraint thatai must be in [0,1] (and takes the nearer value when it falls
outside this range), whereθi is the (positive) letter decay parameter (a decay parameter
exists at each level),ρ is a globalactivation parameter, andǫi(t) is the squashed net input
to the unit i. The squashed input ǫi(t) is calculated from the net inputni(t) thus:
ǫi(t) =
ni(t)(1−ai(t)), ni(t)≥0;
ni(t)ai(t), ni(t)<0,
(2)
whereni(t) is calculated as the sum of the products of the activations of connected units
att−1 with the relevant connection weight parameters. Net inputs to the letter level units are influenced by feature level units that are consistent with the letter units per the
feature-letter excitation parameter, and those that are inconsistent per the feature-letter
inhibition parameter. Net input is also influenced by the orthographically consistent and
inconsistent words with theorthography-letter excitation and orthography-letter inhibition
parameters. Moreover, every letter within each set gives inhibition to every other letter
within the same set according to theletter-letter inhibition parameter.
Orthographic Lexicon
The orthographic lexicon consists of a unit for every orthographic word form in the
model’s vocabulary. Their activations and net inputs are governed by Equations 1 and 2.
Each unit receives activation from consistent letter units and is inhibited by inconsistent
ones, according to the letter-orthography excitation and letter-orthography inhibition
parameters. Consistent phonology units also give excitation in proportion to the
phonology-orthography excitation parameter. Further, orthographic units are mutually
inhibitory, per theorthographic-orthographic inhibition parameter. Lower-frequency words
are additionally inhibited by an additional bias to the net input of value³lgfi
6.068−1 ´
φ wherefi is the frequency of the wordi, andφ is thefrequency scaling parameter. 6.068 is
Grapheme-Phoneme Conversion Rule System
The grapheme-phoneme rule system consists of 8 sets of 44 units, each
corresponding to a phoneme, or “absent”, in a left-justified phonological representation.
The activation of these units is governed by the activation of the most activated units
within each of the sets of letter units on thesame2 time tick. On any given time tick, only
a subset of the letters are considered: The first (left-most)⌊1 +t−βα⌋letters are considered
(if positive), whereα is the GPC delay parameter andβ is the GPC rate parameter. Phoneme units are activated from the letter units according to a set of GPC rules
derived from analyses of the vocabulary of the model. These operate from left-to-right on
the input to produce left-to-right output. Rules may be selectively operational at the
beginning of the input, at the end of the input, which is detected when the
to-be-processed letters are followed by the absent letter, or in the middle of the input (i.e.,
anywhere else in the input), or a combination of two, or operational in every position.
Once a set of letters has contributed a phoneme or phonemes to the output, consideration
proceeds to the following letter(s). Some contextual rules operate only in certain
(preceding or following) contexts, but the contextual letter(s) are not part of the rule, and
are not passed over for consideration if they are following context. Other distant rules (all
of the “silente” type) are applied in response to letter patterns that contain a central
portion that can be matched by any letter; this wildcard letter is not considered part of
the rule, but those letters after this are part of the rule (and therefore affect the weighting
discussed below). Consideration passes to the wildcard letter, and those letters thereafter
are not passed over for consideration. Any remaining “absent” letters that are available
for consideration at this stage are converted to final “absent” phonemes.
The strength of the activation of the output in any position in the rule system is the
arithmetic mean activation of the letters that form part of the rule generating the
applied to the output; most of these apply to the phoneme /s/ in post-vocalic contexts,
but only when produced by the rule s→/s/, and in particular not when produced by the
rule sefinal →/s/ (e.g., in hose).
Phonological Lexicon
The phonological lexicon consists of a unit for every phonological word form in the
model’s vocabulary. The activation and net input are again governed by Equations 1 and
2. Excitatory input comes from consistent orthographic word units and consistent
phoneme units according to orthography-phonology excitation and phoneme-phonology
excitation parameters. Inhibitory input comes from inconsistent phoneme units per the
phoneme-phonology inhibition parameter, and from other phonology units with the
phonology-phonology inhibition parameter. The phonological lexicon is also subject to the
same frequency-based bias to input as the orthographic lexicon; in Coltheart’s
implemented model (and our copy), written frequencies are used for these values.
Phoneme Level
The phoneme layer consists of 8 sets of 44 units mirroring those in the GPC level.
The behavior of these units is governed by Equations 1 and 2. Excitation comes directly
from the GPC system according to theGPC strength parameter, and also from consistent
phonological word units by thephonology-phoneme excitation parameter. Inconsistent
phonological word units and phoneme units in the same position give inhibition according
tophonology-phoneme inhibition and phoneme-phoneme inhibition parameters. Output
occurs when there is a complete contiguous sequence of phonemes of some length from the
leftmost position in which all the phonemes exceed thestopping criterion parameter, and
the rightmost phoneme of the sequence is the absent phoneme. If in any position there is
Optimizing the DRC
The target data were the correct mean response times for the 2,713 words3 in the
Spieler and Balota (1997) data set that were in the model’s vocabulary and were not
heterophonic homographs. Assessment of fit was byR2 for predicting these response times linearly from the number of cycles in the model and the initial phoneme (dummy) coded
as a factor; we permitted the initial phoneme to be outside the scope of the model because
some of the variability attributable to it will correspond to a known non-psychological
mechanism (differential sensitivity of the voice key to different phonemes)4. We maximize
R2 because it is equivalent to maximizing likelihood under the assumptions of ordinary linear regression, which we use here; certain approximations do not hold if likelihood is
not maximized. A case could readily be made for making different assumptions, and
would definitely be necessary if the model specified the distribution of response times; this
would require more sophisticated regression machinery for the type of analysis we describe
and would constitute a useful generalization of our suggestion here. A heavy penalty was
applied to wrong responses so that the optimization procedure would discount parameter
sets that did not produce perfect accuracy.
The optimization was based on the version of the Nelder-Mead simplex procedure in
the GNU R statistical suite, which interfaced with our C++-programmed DRC routine to
obtain response times for given parameter sets. Our routine gives the same response time
and pronunciation outputs as the original and the same results as the Coltheart et al.
(2001) paper (except that the original did not implement the decay parameter). At each
stage the currently best parameters (or at the beginning, the standard parameters of
Coltheart et al. (2001)) were used as starting values in one run, and a further 8–12
(depending on availability of processing time) were run in parallel using starting values
that were chosen by adding random noise to the best set. The simplex procedure is a
interest, reflecting to adjacent regions to find improved objective values, expanding the
region in directions of high improvment, and shrinking the region when movement fails to
yield improvement. The addition of noise was designed to counteract the local properties
of this otherwise robust procedure. The stage was terminated for each run of the simplex
procedure when 500 evaluations of the model had been completed (the default in R, again
to counteract the effects of local tendencies in the procedure) or if it was sooner, a week
had passed (an external constraint on our computing time).
The processors used for this program were 2.4GHz Pentium 4 Xeons, able to
complete a single run of the model over all words in ca. 20 minutes (depending on the
total number of cycles used for the parameters in question; this coincidentally meant that
one week and 500 runs were approximately the same duration). After approximately six
months, neither the simplex procedure nor adding random noise to the parameters
resulted in noticeable improvement in the fit of the model; the best parameters at that
point were taken as the overall best parameters for the data set. Optimization for the
single-route model was similar, although faster as fewer parameters were to be optimized.
Results
Overall Fit
We first examine overall performance in the manner of the regression approach. The
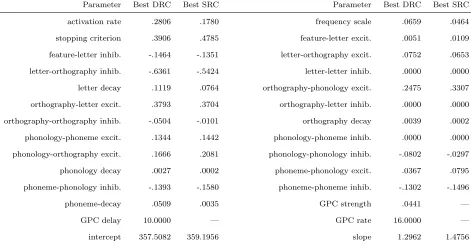
obtained best parameters are listed in Table 1. Initial phoneme accounted for 37.04% of
the variance. The DRC with standard parameters plus initial phoneme accounted for
43.09% of the variance. The DRC with best parameters plus initial phoneme accounted
for 50.10% of the variance in the response times. The corresponding best SRC fit
accounted for less variance: 48.56% of the total. Thus the use of optimal parameters is
clearly essential; it is noteworthy that even the SRC with optimal parameters accounts for
standard adjustment to R2 for overfitting per additional linear parameter would be 0.02–0.03%, and the DRC has only three more parameters than the SRC, suggesting that
a nonlexical mechanism is necessary in the model; it will be seen that it indeed allows a
better (but imperfect) account of regularity effects.
By way of comparison, the standard predictors of letter length, log CELEX
frequency5 and orthographic N along with initial phoneme accounted for 51.10% of the variance. The regression model has many fewer parameters than the DRC, but accounts
for more of the variance. Moreover, this regression model gives an underestimate of the
variance the DRC ought to be able to account for because it is also supposed to explain
the regularity effect, the position of irregularity effect, the interaction between frequency
and regularity, and there is also evidence of an interaction between orthographic N and frequency, but these factors are not included in the regression. This illustrates the key
weakness of the factorial approach: Even though the DRC should account for the effects
in the regression and more according to the results of factorial analyses, it falls short when
these effects are assessed on an item-by-item basis.
Relative Predictor Strength
Before turning to a more complete set of predictors (including those considered by
Coltheart et al., 2001, such as the frequency by regularity interaction, and more), we first
ask where the DRC model falls down with these predictors. We examined regression
models with these predictors taking the data, the models, and the models’ error in
predicting the data6 as the response (after onset had been covaried out). In Table 2, it
can be seen that although the model does predict a robust (∼5 s.e. from zero) effect of
orthographicN, the predicted effect is noticeably (∼7 s.e.) weaker than that in the data. To reiterate, the model predicts the qualitative effects, but it does not correspond to the
examined in more detail below.
Effects in Word Naming 1: Core Effects
We first examine the core effects that Coltheart et al. (2001) claim to account for
with the DRC: (i) frequency, (ii) regularity and the frequency by regularity interaction,
(iii) position of (first) irregularity, (iv) rime consistency, and (v) length.
Frequency Effect.
To examine the predictions for word frequency of the model, we used analyses in
which several other effects were partialed out, viz.: Length, orthographicN, regularity, position of (first) irregularity, and first phoneme. The frequency effect is illustrated in
Figure 1 for the DRC and SRC. It appears that both models’ predictions follow log
frequency quite closely, possibly with a slight concavity up on the log frequency scale.
There is also upwards concavity in the human naming data, largely contributed by
frequency saturation (e.g., Gordon & Caramazza, 1985) such that there is little effect of
frequency at high frequencies (above ca. 2000 or more on raw CELEX count). This second
order curvature has been assessed by Balota et al. (2004) with regressions using quadratic
log frequency. However, there is some indication in the figure of runs of misprediction in
the midrange (underprediction just below a frequency of 100, and overprediction just
above) that may reflect higher order components of curvature in the data.
We therefore examined models with linear, quadratic and cubic trends in log
frequency, with the results in Table 3. There was evidence in the data of a positive cubic
trend modifying a negative trend in the linear and quadratic contrasts. Errors in the
DRC’s predictions appeared to be systematically related to frequency: Its predictions were
dominated by the linear negative trend, and the errors had a systematic relationship to a
direction (p < .05 on the omnibus test). One possible reason for the discrepancy is that frequency saturation results from frequency not being the relevant factor. A candidate
alternative factor is contextual diversity, the number of contexts (operationalized as corpus
documents) in which a word appears. This factor is inherently highly correlated with
frequency, and there is evidence that it might account for the apparent effects of frequency
(Adelman, Brown, & Quesada, 2006; see also McDonald & Shillcock, 2001, Adelman &
Brown, in press). High frequency items are likely to be needed relatively unpredictably in
practically any context, and so their accessibility effectively needs to be at ceiling.
Regularity and Frequency.
A key qualification on the frequency effect comes, however, from its interaction with
regularity: Words whose pronunciation is unusual given their spelling (exceptions) are
named slower than those whose pronunciation is usual (regulars), but this effect is
diminished if the words are of high frequency (e.g., Seidenberg, Waters, Barnes, &
Tanenhaus, 1984; Taraban & McClelland, 1987, but see also Jared, 2002). This interaction
is viewed as very important in validating models of word naming (e.g., Seidenberg, 1985;
Norris & Brown, 1986; Seidenberg, 1986; Paap, McDonald, Schvaneveldt, & Noel, 1987;
Seidenberg & McClelland, 1989; Coltheart, Curtis, Atkins, & Haller, 1993; Norris, 1994;
Plaut et al., 1996; Kwantes & Mewhort, 1999; Coltheart et al., 2001).
The relevant data and predictions for this interaction are presented in Figure 2 for
the DRC, and Figure 3 for the SRC. Regularity was operationalized using the DRC’s
nonlexical route: A word was an exception if the pronunciation ultimately assigned by the
nonlexical route differed from the vocabulary pronunciation; 444 (16.4%) of the words
were identified as exceptions. Although Glushko (1979) suggested that a model of the
SRC type might support spelling-sound inconsistency effects, in terms of the dual route
explanation, it is not surprising that the SRC was relatively immune to the regularity
this processing does not generate a full exception effect. The DRC exhibited a clear effect
of regularity, with a slight apparent interaction with frequency, as the exception penalty
was higher at the lowest frequencies. This occurs in the model because exception words
must typically wait until the irregular phoneme is sufficiently activated by the lexical
route, and this occurs more slowly for the lower frequency words as they have a stronger
negative bias on their net input. The data were more noisy, but there seems to be
evidence of frequency saturation for both exception and regular words with both having
response times in the region of 465ms for frequencies in excess of 2000.
To quantify the frequency by regularity interaction, we fitted a main exception effect
and distinct cubic functions of log frequency for regulars and exceptions to data and
models after the covariates listed for frequency (excepting position of irregularity). Table 4
confirms that the SRC failed to predict an exception effect. Although both the DRC and
SRC predicted the strong linear component of log frequency for exception words, and the
individual components of the cubic polynomial in log frequency did not reach significance
in the regression with model errors, overall these errors were predicted by the complete
cubic in log frequency (ps < .01). Further, the DRC fitted the frequency effect for regular words poorly (p < .001), but the SRC showed no evidence of misfitting this effect (p > .1). Thus, although the frequency by regularity interaction could be captured qualitatively by
the DRC, this did not correspond to correct prediction at a more detailed level.
Position of (First) Irregularity.
A line of evidence adduced in favor of a dual-route model with a serial nonlexical
process is the influence of the position of irregularity on the exception effect (Coltheart &
Rastle, 1994; Rastle & Coltheart, 1999; Roberts, Rastle, Coltheart, & Besner, 2003; but
see also Zorzi, 2000; Rastle & Coltheart, 2000). It appears that exception costs for items
whose first irregularity occurs in the production of earlier phonemes are greater than those
effect because the nonlexical route’s output can compete more strongly for earlier
phonemes because they are generated sooner by the letters toward the left of the word.
Exception costs for the naming data and the DRC (covarying first phoneme, letter
length, orthographicN, and full cubic log frequency by regularity interaction) are
described in Table 5 (because there were on average no exception costs for the SRC, it was
omitted from the analyses). The position of irregularity is given by the first phoneme at
which the nonlexical and vocabulary pronunciations differ.
As in Rastle and Coltheart’s (1999) data, there was a large exception cost for the
first position of irregularity, and a smaller cost for second position, but the third position
cost is non-zero and quite similar to the second position cost. This last point contrasts
with the lack of a significant third position effect in the data of Rastle and Coltheart and
Roberts et al. (2003). It is possible that one or more of the results is an error — there
could be insufficient power in the small experiments, or a type I error in the mega-study
— or it might be the case that the choice of items or participants systematically affects
the results, and a model would be correct to be able to predict both patterns with
differing parameters. In light of the latter possibility, we refrain from discounting either
pattern of results on the basis of the current data. In the DRC, the effect of irregularity
decreases with position, but the best parameter fit of the DRC underpredicts the cost at
Position 1 for the Spieler and Balota data, and overpredicts it at Position 2.
Given that the form (or at least, the strength) of the frequency effect depends on
the regularity of the stimulus, and there are effects of the position of irregularity over and
above the effect of its presence, it seems plausible that there might be different frequency
effects at different positions of irregularity. There was no evidence of this for the data
Rime Consistency.
We sought a main effect of rime consistency (Glushko, 1979), the ratio of friends
(words that look as though they should rhyme, and do) to friends plus enemies (words
that look as though they should rhyme, but do not), after the previously discussed
variables were covaried out, using types only, frequency weighted types (i.e., tokens), and
log-frequency weighted types for the ratios in three separate analyses,7 presented in Table
6. All three showed a significant effect in the data. Further analyses showed that either
the types ratio or the log-weighted ratio could subsume the effect of the tokens ratio. The
types and log-weighted ratios were mutually redundant, so only the former was retained as
a covariate (it had a very slightly higher ∆R2). The DRC predicted a much weaker effect than that in the data, and the SRC none at all.
(Letter) Length.
As has been seen (in Table 2), there is an effect of number of letters on naming
latency, each letter costing ca. 4 ms, and this is more-or-less accurately predicted by both
single- and dual-route models. This remains the case with additional covariates.
Effects in Word Naming 2: Peripheral Effects
We now move beyond Coltheart et al.’s (2001) main list of effects to examine: (i)
neighborhood size (although they did examine this variable, see above); (ii) number of
irregularities; (iii) the length by regularity interaction; (iv) whammy effects; (v) the
influence of whammying on regularity effects; (vi) number of phonemes; (vii) body
neighborhood size; and (viii) interactions of frequency with consistency variables.
Neighborhood Size (Revisited).
The analyses above indicated that the orthographicN effect was predicted to be weaker in the DRC than was observed in the data. According to Coltheart et al. (2001),
similar neighbors’ phonological representations are activated and in turn activate their
constituent phonemes, most of which will be consistent with the correct pronunciation.
The effect in the model is therefore due to lexical print-sound conversion, as confirmed by
lesion studies of the model (Reynolds & Besner, 2002).
If the orthographicN effect is indeed due to lexical print-sound conversion, then those orthographic neighbors that are also phonological neighbors (i.e. differ in exactly
one phoneme) should have a strong facilitatory influence in both the model and data.
Peereman and Content (1997) termed thesephonographic neighbors, and they have found
evidence that it is specifically these phonographic neighbors, rather than all the
orthographic neighbors, that drive orthographic neighborhood effects for French words
and pseudowords (Peereman & Content, 1995, 1997). Moreover, Adelman and Brown
(2007) have found evidence of the same effect from four mega-studies in English (including
the one on which these analyses are based). Mulatti, Reynolds, and Besner (2006) have
argued in contrast that the (whole) phonological neighborhood drives neighborhood effects
rather than specifically the phonographic neighbors.
Table 7 shows analyses seeking simultaneous effects of the three neighborhood size
variables. Only phonographic neighborhood size had a significant effect in the data. For
both the DRC and SRC, an underestimation of the phonographic neighborhood effect was
significant, as was an overestimation of facilitation from the phonological neighborhood for
the SRC. For further analyses, we removed both the orthographic and phonological
neighborhood sizes as both remained non-significant after the other was removed.
It was also the case that the introduction of phonographic N (in place of orthographicN) almost halved the estimated effect of the rime consistency ratio to a marginal -2.697 (SE 1.600,p=.092). We did not eliminate it as a covariate at this point because once the next two variables (number of irregularities and the regularity by length
Number of Irregularities.
Since irregularities in pronunciation relative to grapheme-phoneme correspondences
produce slower responses, it seems reasonable to ask whether increasing numbers of
irregularities further slow responses. This would not be expected if exception costs are due
to the erasure of fast assembled phonology as in the dual route model described by Norris
and Brown (1986), but would be expected if exception effects occur due to the serial
resolution of phonological competition as in LEX (Kwantes & Mewhort, 1999).
Here, as there are few monosyllables with more than two irregularities, we simply
divided the words into those with a single irregularity and those with many irregularities
(i.e. whose correct pronunciation differed in more than one phonemic slot from those
produced by the DRC rules), and sought an additional response time cost for the latter.
The data showed a clear 6.879 ms (SE 1.993) cost, but the DRC predicted an advantage: -1.373 ms (SE 0.362), which clearly differs from the effect in the data. This appears to reflect some lexical factor to which the model is sensitive, as the SRC also predicted the
advantage (-1.396 ms, SE 0.497), but clearly neither model predicts the observed cost.
Regularity by (Letter) Length Interaction.
In both stage and cascade models, when two factors effect changes in speed of
processing in the same component, the result is typically an interaction of the effects
(Sternberg, 1969; McClelland, 1979). Adelman (2005) examined length and regularity
effects, which both relate to the nonlexical component of the DRC, and observed that the
DRC with standard parameters showed an subadditive interaction of regularity and length.
We examined which, if any, interaction between these variables obtained in the
Spieler and Balota (1997) data (after partialing out regularity by cubic log frequency,
effect for regulars. By contrast, the DRC showed a 5.562 ms/letter (SE 0.070) effect for regulars, but a -0.479 ms/letter (SE 0.143) effect for exceptions. Clearly, the interaction predicted model error (p < .001). The SRC showed an superadditive interaction (p < .01), 4.429 ms/letter (SE 0.247) for exceptions and 3.707 ms/letter (SE 0.121) for regulars, but its size was smaller than that in the data (p < .05).
Position of (First) Whammy.
Rastle and Coltheart (1998) introduced the term whammy to describe the situation
where the spelling-sound correspondence for a digraph (a two-letter grapheme) differs
from the regular pronunciation of the digraph’s first letter. For instance, shis regularly
pronounced/S/ (in the notation of the model) as inship, buts without a followingh is
regularly pronounced/s/as in sip. In processing these words, the DRC’s nonlexical route
pronunciation will be temporarily erroneous (for regulars) when only first letter of the
digraph is available. The model might therefore predict a slowing for these whammied
words, whose temporarily incorrectly parsed. Rastle and Coltheart confirmed for a set of
pronounceable pseudowords with and without whammies that both people and the model
produced slower responses for those that werewhammied.
Of course, neither the model nor human participants need show the same results in
response to words as to nonwords, and the model’s best parameters for these data are
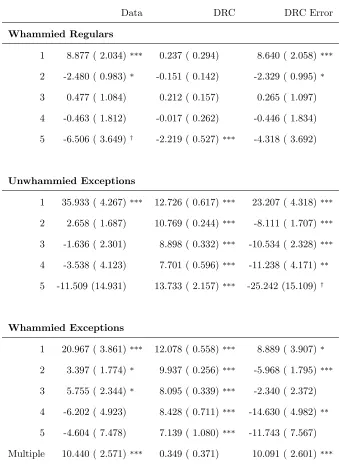
different from those in the simulations of Rastle and Coltheart (1998). Table 8 describes
the relevant analyses. We considered a word whammied only if the pronunciation of the
whole word was regular and a phoneme was temporarily mistranslated by the
grapheme-phoneme route due to letters being unavailable. The data showed a response
time cost for first position whammies and a benefit for second position whammies.
Although the DRC made predictions in the correct direction for these positions, they were
much smaller than in the data. The fifth position whammying effect that is significant in
predictions bear little resemblance to the data.
Influences of Digraphy (Whammying) on Regularity Effects.
Andrews, Woollams, and Bond (2005) investigated the suggestion of Coltheart et al.
(2001) that apparent rime-consistency effects might be due to whammying, as a confound
between whammying and consistency appeared to underly the ability of the DRC model
to predict the condition means of an experiment of Jared (1997) with a consistency
manipulation. In two experiments, Andrews et al. factorially manipulated spelling-sound
regularity and consistency with the presence of digraphs. They found that both irregular
words and inconsistent words were only slower than regular control words when the
irregularity or inconsistency arose from a digraph that would have been whammied were
the word regular. We divided the irregular words in the Spieler and Balota (1997) data
into those that met this criterion and those that did not. Replacing the standard DRC
regularity criterion to one that admitted only these exception words as exceptions in the
regression equation (including the interactions) changed itsR2 from 55.93% to 55.89%. Instead, creating a three-level regularity factor with regular, whammy-exception and
nonwhammy-exception as levels, and including the interactions of this factor with cubic
log frequency, position of irregularity, length and multiple irregularity, signficantly
increased theR2 to 56.39% (p < .01). We then sought to reduce the complexity of the model: The interaction with length and the interaction with cubic log frequency could be
reduced to have only two levels, regular and exception; and multiple irregularities affected
only exception words whose first irregularity was digraphic. This model had an R2 of 56.31% (p > .5 for the decrement).
Table 9 shows the various exception and whammying costs found in such an
analysis; the SRC is omitted as it has already been seen that its predictions for whammies
and exceptions are highly inconsistent with the data. It is again clear that despite being
effect, predicted an insufficient exception cost for first position irregularities and too great
an exception cost for later irregularities, and did not predict the large effect of a second
irregularity. Moreover, it did not predict the interaction between whammying and
irregularity and position of irregularity; on the whole, it predicts greater exception costs
for exceptions that would not be whammied, and this is the case for Position 1
irregularities (which were not examined by Andrews et al., 2004) in the data, but not
Position 3 irregularities, where the opposite effect is found.
Phonemic Length.
A consequence of the manner in which the nonlexical route of the DRC generates
length and whammy effects suggests that the length effects predicted by the model arise
from the number of letters not the number of phonemes, and that number of phonemes
should produce a facilitatory effect only due to digraphy. Therefore, we investigated
whether there were phonemic length effects after the effects of the variables that have
already been described. Indeed, there was a -2.039 ms/phoneme (SE 0.516) effect
(p < .001), which the DRC predicted to be much smaller (p < .001) at -0.191 ms/phoneme (SE 0.075,p < .05), as the effect can only arise from digraphs that are not whammies (e.g., wherell→/l/ inhill does not whammyl→/l/). The SRC predictions were in the
opposite direction (0.896,SE 0.127, p < .001). We will go on to discuss how this result contrains possible rules for the initiation of pronunciation in reading aloud.
Since the letter length variable’s influence varied with regularity, we investigated
whether a similar interaction was also observed with phonemic length, and indeed it was
(p < .05). The effect was -1.500 ms/phoneme (SE 0.558,p < .01) for regulars, but -4.930 ms/phoneme (SE 1.254,p < .001) effect for exceptions. The DRC predicted a -0.236 ms/phoneme (SE 0.081,p < .01) effect for regulars, but no effect for exceptions (0.050, SE 0.182, p > .5), and the interaction significantly predicted model error (p < .01).
(-2.413,SE 1.646,p > .1), suggesting with other results that the influence of rime consistency is due to confounds with phonemic length and phonographic N. Rime consistency was therefore removed from the list of covariates. Once phonemic length was
partialed, a small facilitation effect from phonological N (-0.085,SE 0.036) reached signficance, without altering other effects. The DRC predicted the phonological N effect should be inhibitory (0.021, SE 0.005). The SRC correctly predicted facilitation, and the partialing out of this variable made its phonemic length prediction facilitatory. Partialing
out phonological N did not substantially alter the models’ letter length predictions.
Body N.
Some authors (e.g., Ziegler, Perry, Jacobs, & Braun, 2001) have investigatedbody
N, the sum of friends and enemies, as a determiner of naming latencies8. As with rime consistency, we investigated this variable in separate analyses using types only, frequency
weighted types (i.e., tokens) and log frequency weighted versions of the body N variable. None of these had a significant effect (p > .1) after the already discussed variables had been covaried out. The types only and log-frequency weighted bodyN showed no effect for the DRC model (p > .1), and all three gave significant facilitation for the SRC (p < .05).
Interactions with Frequency: N, Rime Consistency and Regularity (Revisited).
Several variables have been said to produce the regularity by frequency interaction
that has been entered into the analyses so far: As well as being interpreted as a genuine
interaction between regularity and frequency (e.g., Coltheart et al., 2001), it has been
attributed to an interaction between consistency and frequency (e.g., Plaut et al., 1996,
but see Jared, 1997). Also, as we have noted, phonographicN accounts for some spelling-sound consistency effects, and Balota et al. (2004) have found an interaction
included the multiplicative interactions of this frequency block with each of the three
types of rime consistency ratio. Only in the analysis using the token ratio did the
frequency interaction reach significance, so we further consider only this ratio.
All three interactions showed significant unique effects. The phonographic N by frequency interaction (p < .001) was such that the advantage for words with high
phonographic N was smaller for high frequency words. The token rime consistency ratio by frequency interaction (p < .05) was such that high consistency words showed greater frequency effects. Finally, the regularity by frequency interaction remained as expected
(p < .001): Frequency effects were greater for exceptions than for regulars.
What Do These Variables Explain?
The R2s for the final regression models were 57.41% for the data, 98.21% for the prediction of the DRC (including onsets), 12.57% for the error in the DRC, 95.20% for the
prediction of the SRC (onsets included), and 14.09% for the prediction of the SRC’s error.
Discussion
There are significant difficulties in obtaining strong conclusions regarding the
adequacy of models from previous effect-based factorial approaches and regression
approaches based on total fit, especially when the parameters used in generating model
predictions are not optimal. We argued that several difficulties can be overcome by finding
optimal parameters for large data sets and performing regression analyses on model
predictions for these data and the error in these predictions, in addition to regressions on
the data themselves. We demonstrated the techniques with Coltheart et al.’s (2001) DRC
model. One set of differences between the model and data was related to frequency effects,
and we suggested that these might relate to the functional form of the bias on the lexical
nodes and the possiblity that contextual diversity rather than frequency might be the
related to spelling-sound conversion, including the regularity by length interaction, and
the multiple irregularities effect. In the following, we will explicate the manner in which
the left-to-right grapheme-phoneme conversion route, a core theoretical component of the
DRC, causes problems in accounting for these more subtle aspects of the spelling-sound
phenomena that it is designed to explained. We will then turn our focus to the more
general applicability of the method we have employed.
Exception Effects and the Nonlexical Route of the DRC
Why should the DRC’s nonlexical route produce length and exception effects, but a
subadditive interaction between them? To answer this question, we examined phoneme
activation in DRC simulations with the words spat, spats andspate removed from its
lexicon, and one of these replaced with either its usual regular or an altered exceptional
pronunciation. Comparingspat and spatsindicates the source of the length effect, and
comparing regular and exceptional pronunciations illuminates the exception effect.
First, Figure 4a illustrates the activation of phonemes for reading the word spat
when it was reinserted in the lexicon with its usual regular pronunciation (/sp{t/) and a
frequency of 50. The phonemes’ activation increases more quickly if they are earlier in the
pronunciation since they are produced by letters further left in the input and therefore
receive excitation from the nonlexical route sooner. Therefore, the last phoneme to exceed
criterion is the blank phoneme (dotted line) indicating the end of the pronunciation in
Position 5, which is supported by the blank letter in Position 5 of the input via the
nonlexical route. The model thus produced the correct pronunciation after 85 cycles.
The source of length effects is illuminated by comparison of Figures 4a and 4b.
Figure 4b uses the word spatsinstead ofspat, also with regular pronunciation (/sp{ts/.
Since this word is longer, the sixth phoneme is the blank that is needed to complete the
(blank) letter in the input is processed. This phoneme is activated more slowly than the
Position 5 phoneme that is the last to exceed the stopping criterion in Figure 4a. In fact,
the Position 6 blank phoneme in spatsexceeds the stopping criterion on Cycle 92, and
this is when the pronunciation is output by the model.
The comparison between Figures 4a and 4c illustrates the source of the exception
effect. Figure 4c again uses the orthographic form spat, but with a pronunciation in the
lexicon that is irregular in the first phoneme (/Sp{t/). The consequence of this is that the
correct first phoneme (/S/, solid line) never receives activation from the nonlexical route
and receives inhibition from the now incorrect regular phoneme (/s/). Notably, although
it is the conflict between the two routes’ pronunciations that is intended to produce the
exception effect, the vast majority of the difference between the regular and exception
cases is contributed by the lack of nonlexical support, not the inhibition from the regular
phoneme. The correct phoneme is therefore more slowly activated than the blank fifth
phoneme, and does not reach the stopping criterion until the 100th cycle, when the model
produces the new correct pronunciation. Thus the exception effect occurs due to the
delaying of the irregular phoneme to be later than the final blank phoneme.
Figure 4d now combines the longer orthographic form spatswith an irregular
pronunciation in the first phoneme. Again, there is a delay in the activation of the first
phoneme. The final blank phoneme is now produced by the sixth letter not the fifth
compared to Figure 4c. However, although the final blank phoneme reaches the stopping
criterion later, it does not reach criterion later than the irregular first phoneme, which
continues to reach criterion at Cycle 100, which is when the pronunciation is generated by
the model. Therefore, in the presence of a strong exception slowing, there is no further
slowing due to length. If there is any exception to this, it will be because the last blank
phoneme is generated so late that the exceptional phoneme has no influence on response
but only in the absence of an exception effect due to the nonlexical route.
Figures 4e and 4f are designed to allow a similar examination of the number of
irregularities effect. In these, a further third position irregularity has been introduced into
the pronunciation in the lexicon. Note that in Table 5 we established that the model
predicts a cost of irregularity at this position with these parameters, and it is smaller than
that in earlier positions. In a similar fashion to the absent length effect, the irregularity in
Phoneme 3 slows the activation of that phoneme, but less so than the irregularity in first
position. Moreover, this must be the case if the position of irregularity effect is to obtain.
For both of these words then, the first phoneme is again the last to reach the stopping
criterion after 100 cycles, when they are pronounced.
Decision Rules and Exception Effects.
Given these incorrect effects arise in the model because of the interaction between
the nonlexical route and the decision rule for readiness of pronunciation, an alteration to
this decision rule might ameliorate the problem. An additive rule, comparing the sum of
phoneme activations to a stopping criterion, would give an effect of multiple irregularities.
However, this would probably create too large a facilitation from number of phonemes,
since a four phoneme word would have approximately 1.25 times the activation of a three
phoneme word, which would exceed the size of the letter length effect. An averaging
(arithmetic mean) rule would have a different problem: Since later phonemes lag in
activation, words with many phonemes will have lower average activation than those with
few, in contradiction to the facilitatory phonemes effect.
A product of activations rule would have similar problems to a sum rule, as taking
logarithms on both sides gives a stopping criterion rule that is sum of log activations
exceeds log criterion. The same logic applies to the use of a geometric mean rule rather
than an arithmetic mean rule. A more complex rule might better accommodate all the