1 Preface
This master’s thesis has been written as my graduation project of the Master of Science in
“Human Factors and Engineering Psychology” at the University of Twente, Enschede in
collaboration with the department of Experience and Perception Research of Philips Lighting,
Eindhoven. I would like to use the preface to the thesis to thank everyone who helped me during
this time to complete my project and my studies.
First, I would like to express my gratitude to the University of Twente for giving me the
possibility to conduct this research. I furthermore would like to thank Philips Lighting, in
particular the department of Experience and Perception Research for providing me with the
possibility and the resources for conducting my research and completing my thesis.
I would like to thank Dr. Matthijs Noordzij of the University of Twente who already
supervised me in my bachelor’s thesis for retaking his role as first university supervisor and
providing constant feedback and help. I would also like to thank Dr. Thomas van Rompay of
the University of Twente, my second supervisor, for his help and creative input on this thesis.
I especially thank Dr. Jan Souman of Philips Lighting, who not only functioned as my external
supervisor of the thesis on a daily basis but who also taught me a lot about working in a
professional environment and without whom this project would not have been carried out.
I also would like to thank the staff at Philips in Eindhoven, especially Dr. Tobias Borra
for feedback and supervision and Ruud Baselmans for constant help with the setup of my
experiments. I express my gratitude to Vivian Roth and Andra Alexa for proofreading the thesis
and giving me final feedback as well as Edoardo Repetti for helping me with the design of the
cover letter. Furthermore, I would like to thank all participants who participated in the
experiments without hesitation.
Last, but certainly not least, I want to thank my family for their support not only during
the time of my graduation project but also during the whole duration of my study. None of this
would have been possible without you.
2 Abstract
Introduction: In investigating the psychological effects of light, the effects of color are a major
factor. Studies have found that color can have an influence on how we recognize and process
visual information in our surroundings. In the processing of visual stimuli, the global aspects
are often processed earlier than their local counterparts, which may lead to interferences in the
recognition of local elements, an effect known as the global precedence effect (GPE). This
effect may be mediated by color, most importantly the color red. The aim of this research thesis
is to investigate whether the psychological effects of color may also be obtained with colored
lighting. To answer this question, a pilot study and three experiments have been carried out.
Pilot study and Experiment 1: Twelve (Pilot study) and eighteen (Experiment 1) participants
were given the task to identify the global and local features of hierarchically organized stimuli
on three (red, green and grey) isoluminant backgrounds. The results of the pilot and the first
experiment both indicated that global features are identified faster than local features and that
a global-to-local interference (GPE) took place. However, no differences in GPE across the
different colors have been found.
Experiment 2: The second experiment was designed to additionally investigate the attenuating
effect of a red background color on visual processing via the magnocellular pathway of the
visual system. Sixteen participants were given the task to identify the orientation of either global
or local features which were presented at high and low spatial frequencies on three (red, green,
blue) isoluminant backgrounds. The results indicate a GPE as well as an advantage of low
compared to high spatial frequencies in local tasks. No differences in GPE across the colors
have been found. No consistent effects of color on different spatial frequencies have been found.
Experiment 3: In the last experiment, 16 participants carried out the same tasks as in
Experiment 2. The colored backgrounds were replaced with colored ambient lighting (red,
green and blue). The results indicate a GPE and an advantage of low spatial frequencies in local
tasks. No differences in GPE have been found across the different colors
Conclusion: In a series of one pilot and three experiments we found further evidence for the
global precedence effect in visual perception. However, we did not find an indication that the
global precedence effect is mediated by background color. For this reason the effects of color
on processing could also not be replicated with the use of ambient lighting. Future research
should address the working mechanisms of the magnocellular pathway. Furthermore there is a
strong need for a combining framework on the psychological effects of color and colored
3 Samenvatting
Introductie: In het onderzoek naar de psychologische effecten van licht spelen de effecten van
kleur een belangrijke rol. Studies hebben aangetoond dat kleur invloed kan hebben op hoe wij
visuele informatie in onze omgeving waarnemen en verwerken. In de verwerking van visuele
stimuli worden de globale aspecten vaak sneller verwerkt dan de lokale elementen. Dit kan
ertoe leiden dat de globale vormen met het identificeren van lokale elementen interfereren. Dit
wordt de global precedence effect (GPE) genoemd. Dit effect kan worden gemedieerd door
kleur, specifiek door de kleur rood. Het doel van deze these is om te onderzoeken of de
psychologische effecten van kleur ook door gekleurd omgevingslicht kunnen worden bereikt.
Om dit te beantwoorden, werden er een pilotstudie en drie experimenten uitgevoerd.
Pilotstudie en Experiment 1: Twaalf (Pilotstudie) en achttien (Experiment 1) participanten
werden de taak gegeven om globale en lokale elementen van hiërarchisch georganiseerde
stimuli on drie isoluminante achtergronden (rood, groen en grijs) te identificeren. De resultaten
van de pilotstudie en Experiment 1 laten zien dat globale elementen sneller worden
geïdentificeerd dan lokale elementen en dat een interferentie van de globale op de lokale
elementen (GPE) plaats heeft gevonden. Echter waren er geen verschillen in GPE tussen de
verschillen achtergrondkleuren.
Experiment 2: Het tweede experiment werd opgesteld om de verminderende effect van een
rode achtergrondkleur op visueel waarnemen door de magnocellulaire pad van het visuele
system te onderzoeken. Zestien participanten werden de taak gegeven om de oriëntatie van
globale en lokale elementen te identificeren. De elementen werden zowel met een hoge als ook
een lage spatiele frequentie (SF) op drie verschillen isoluminante achtergronden (rood, groen
en blauw) aangeboden. De resultaten laten zien dat de GPE plaats heeft gevonden en dat lage
spatiele frequenties in lokale taken sneller worden geïdentificeerd. Geen verschillen in GPE
tussen de kleuren en geen consistente effecten van kleur op SF werden gevonden.
Experiment 3: In het laatste experiment werden 16 participanten gevraagd om dezelfde taken
als in Experiment 2 uit te voeren. Echter werden de gekleurde achtergronden door gekleurd
omgevingslicht (rood, groen en blauw) vervangen. De resultaten laten zowel de GPE als ook
de snellere identificatie van lage spatiele frequentie op lokale taken zien. Echter worden geen
verschillen in GPE tussen de kleuren gevonden.
Conclusie: In een serie van een pilotstudie en drie experimenten hebben wij aantoningen voor
de GPE in visuele waarnemen gevonden. Echter kunnen wij niet ervan uitgaan dat de GPE door
4 omgevingslicht worden bereikt. De focus van toekomstig onderzoek zou op de werkwijze van
de magnocellulaire pad gericht zijn. Verder bestaat er behoefte aan een omvattend theoretische
5
Table of Contents
Introduction ... 6
Pilot study - Introduction ... 11
Pilot study - Method ... 12
Pilot study - Results ... 15
Pilot study - Conclusion ... 20
Experiment 1 – Introduction ... 21
Experiment 1 - Method ... 22
Experiment 1 - Results ... 24
Experiment 1 - Conclusion ... 27
Experiment 2 - Introduction ... 28
Experiment 2 - Method ... 30
Experiment 2 - Results ... 33
Experiment 2 - Conclusion ... 37
Experiment 3 - Introduction ... 38
Experiment 3 - Method ... 39
Experiment 3 - Results ... 42
Experiment 3 - Conclusion ... 48
General Discussion and Conclusion ... 50
References ... 55
6 Introduction
For a long time, light has solely been used as a synonym for its physical properties, namely the
visible parts of the electromagnetic spectrum. However, in the current research on the effects
of lighting and the research on lighting centered application, the need to also understand the
non-physical effects of light grows (van Bommel, 2006). Concerning the biological effects, that
light has on humans, research has shown that light plays a major role in the regulation of the
circadian rhythm by affecting the suprachiasmatic nucleus which is mediating the production
of the bodily sleep hormone melatonin (Cajochen, 2007; Pinel, 2010; Rahman et al., 2014) or
by possible light transduction through the skin (Campbell & Murphy, 1998). Besides the
biological effects of light, studies have shown that light may also affect cognitive functioning
of human beings. Research on light and alertness has shown for instance that blue light (or blue
enriched light) increases alertness on attention based tasks (Viola, James, Schlangen, & Dijk,
2008; Wahnschaffe et al., 2013) Further studies show, that light may have an effect on a vast
array of cognitive processes such as attention (Chellappa, Gordijn, & Cajochen, 2011),
perceived guilt (Aspinall & Dewar, 1980), mood (Kaufman & Haynes, 1981; Turner, 1995) or
decision making (Kliger & Gilad, 2012; Perrons, Richards, Platts, & Singh, 2006). From a more
consumer-oriented point of view, research reports that light may have profound influence on
patients and consumers in terms of consumer satisfaction, stress level, health (Frasca-Beaulieu,
1999) or self-reported quality of well-being (Sörensen & Brunnström, 1995). However, other
studies failed to provide evidence for the effects of light (Boray, Gifford, & Rosenblood, 1989;
Veitch, 1997) and the domain of the psychological effects of light remains a field which needs
to be explored. An important factor, which has to be considered when the psychological effects
of lighting are discussed, is the psychological effects of color. Frasca-Beaulieu (1999) states
that the effects of lighting are not to be seen as two independent mechanism but work closely
together.
The effects of color on human cognitive functioning have long been subject to
psychological research. Starting already in 1942, Goldstein (1942) suggested that emotional
experiences such as positive or negative arousal as well as certain cognitive mechanisms in
human behavior may be mediated by the presence of certain colors such as red or yellow
(Goldstein, 1942). Research has shown that visual search times were faster when the targets
were presented in a red color compared to other colors (Buechner, Maier, Lichtenfeld, & Elliot,
2015; Lindsey et al., 2010; Tchernikov & Fallah, 2010). Furthermore, the color red has shown
7 with red clothing tend to outperform those with blue clothing (Meier, Hill, Elliot, & Barton,
2015). In studies on the effects of color on academic performance, participants who first saw
a red cover letter tended to perform worse on an intelligence test than participants with a grey
or green cover letter (Elliot, Maier, Moller, Friedman, & Meinhardt, 2007). Although this
finding has been made by several other studies (Gnambs, Appel, & Batinic, 2010; Shi, Zhang,
& Jiang, 2015b; Zhang & Han, 2014), other studies showthat red may also enhance cognitive
performance (Kwallek & Lewis, 1990). Breitmeyer & Breier (1994) found that in a task where
low spatial frequency stimuli have to be processed, participants had prolonged reaction times
on identifying spot stimuli on a red background compared to a blue or green background.
Similar findings have also been made concerning the processing of stimuli with a high temporal
frequency where participants also performed worse (i.e. higher reaction times in an
identification task) with a red background compared to other colored backgrounds (Breitmeyer
& Williams, 1990a). Furthermore, the color red has shown to increase detail-oriented
processing behavior. In a study on persuasive message evaluation, Mehta and Zhu (2008)
showed that the participants evaluated a product as more favorable based on an advertisement
on a red (compared to a blue) background when visuals on the product details were given. On
the other hand, participants evaluated the product better based on the advertisement on a blue
(compared to a red) background when the ad contained visuals about the overall concept and
associations of the product. The effect of a red background on detail-oriented behavior has also
been shown in a study on the processing of hierarchically organized stimuli. A study by
Michimata Chikashi, Okubo and Mugishima (1999) found that a red background enhances
detail-orientation. In a visual identification task of stimuli with global and local features, the
overall shape of a stimulus interfered less with detail identification (i.e. faster reaction times)
in a red background compared to a green background.
One approach to explain why a red background enhances the focus on detailed
information concerns the parvocellular and magnocellular pathway of the visual system.
Information processing through these pathways starts at the retina of the eye and goes through
until the visual areas of the cortex. The parvocellular pathway is mainly responsible for the
processing to high spatial frequency and low temporal frequency information and is known to
be slower than its magnocellular counterpart through which information with high temporal
frequency and low spatial frequencies are processed. Temporal frequency refers to the
repetitions of a stimulus per time unit. The more often a stimulus is repeated within a specific
time unit, the higher is its temporal frequency. Spatial frequency describes the level of detail in
8 visual angle, the higher the spatial frequency of a stimulus. (Livingstone & Hubel, 1988;
Livingstone & Hubel, 1987; Seymour, Clifford, Logothetis, & Bartels, 2010). The
magnocellular pathway is known to contain Type IV cells which may be inhibited by red light.
This is due to the fact that these cells have a receptive field with a tonic red surround
mechanism. Thus, imposing a red background on stimuli may trigger this surround mechanism
and suppress the working mechanism of the magnocellular pathway (Breitmeyer & Breier,
1994; Chapman et al., 2004; Chase et al., 2003; Edwards et al., 1996). If we suppose that the
global features of a stimulus contain more low spatial frequency information and the detailed
features contain more high spatial frequency information, we may theorize that the suppressing
effect of a red background on the magnocellular pathway suppresses mostly the global features
of a stimulus. Therefore the focus in visual perception shifts to the details which is how the
enhancement of focus on detail on a red background may be explained.
From an evolutionary perspective the association of a certain color to a certain nature of
the situation can be explained by research which has been conducted in non-human animals. In
nature, dominance in a species is often presented by the color red which may be caused by an
increased blood flow which reddens parts of the skin as a signal (Bishop & Robinson, 2000;
Böddeker & Stemmler, 2000; Hill & Barton, 2005). For other animals, this skin reddening may
be associated with dominance and aggressiveness which influences their behavior. Color
theorists believe that also in humans color influences cognition and behavior through learned
associations (Kwallek & Lewis, 1990). The concept that color serves as a cue for the nature of
the situation was used and elaborated by Elliot and Maier in 2012 when they published the
color-in-context theory (Elliot & Maier, 2012). The theory states that color elicits certain
behavior by association but always has to be seen in the context in which the color is presented.
A prime example for the importance of the context on the color association is the color red. On
the one hand, researchers have found out that viewing the color red increases the appraisal of
dominance in a more competitive context such as a football match or another competitive sport
(Feltman & Elliot, 2011; Greenlees, Leyland, Thelwell, & Filby, 2008; Little & Hill, 2007) or
induce a more cautious behavior in an academic context such as an intelligence test (Elliot et
al., 2007; Mehta & Zhu, 2008; Rutchick, Slepian, & Ferris, 2010). Both behaviors can be seen
as caused by a typical avoidance motivation. On the other hand, red has also shown to increase
approach-motivated behavior. For example, females wearing red are often rated as more
attractive by heterosexual male participants in a romantic context (Elliot & Niesta, 2008;
Schwarz & Singer, 2013; Wen, Zuo, Wu, Sun, & Liu, 2014). Scientists believe that the
9 and risk-averse (Förster, Friedman, Özelsel, & Denzler, 2006; Friedman & Förster, 2000) and
that threatening situations drive people to a more careful and detail oriented behavior (Ronald
S. Friedman & Förster, 2002). Based on these two premises, we may theorize that red enhances
the focus on detail through associations with danger or threat.
A paradigm to investigate how people process overall features and small details has
been proposed by Navon (1977) with a task that required the identification of hierarchically
organized stimuli, i.e. an overall (global) shape which is constructed by the accumulation of
several smaller (local) shapes. If the smaller shapes are the same as the overall shape, the stimuli
are congruent (local and global shape match). If the shapes differ, the stimuli are called
incongruent (mismatch between global and local shape). Navon (1977) found that identifying
global shapes takes less time than identifying their local counterparts, also known as the
global-to-local-advantage. Furthermore, he found that reaction times in identifying local stimuli are
slower if the global appearance of the stimuli does not match the local appearance (i.e. the
global form is not equal to the local form). This effect, which is also called the global-to-local
interference, does take place in the identification of local stimuli with incongruent global
stimuli, but takes place far less with global identification with incongruent local stimuli. Based
on this, Navon (1977) named this effect the global precedence effect, meaning that the global
features are identified earlier than their local counterparts, leading to an interference in the case
of incongruent stimuli when local features have to be identified. Since then, the existence of the
global precedence effect has been shown in several other studies (Bouvet, Rousset, Valdois, &
Donnadieu, 2011; Goto, Wills, & Lea, 2004; Kimchi, 1992) including studies, that found
evidence for the effect on a physiological level (Han, Yund, & Woods, 2003; Proverbio,
Minniti, & Zani, 1998). Research furthermore has shown that the perception of global and local
features of a stimulus can be affected by several factors such as size of the stimulus, viewing
angle or spatial frequency (Baker & Braddick, 1982; Eagle & Rogers, 1997; Kimchi, 1992).
Michimata et al. (1999) reported that the global precedence effect can also be mediated by
changing the background color of the stimuli. The researchers found, that while global-to-local
interference took place normally when stimuli where presented on a green background, it was
decreased when presented on a red background. This led to the theory that the color red has an
attenuating effect on the interference of conflicting global features on the identification of local
elements in hierarchically organized stimuli.
To this moment, there is a vast theoretical framework on the psychological effects of
color on human beings. In particular, the color red has been given a lot of attention. The effects
10 in the areas on surround and ambient lighting, there is a strong need to understand how these
lights may influence human functioning and behavior. Based on the theoretical framework,
there is reason to claim that the color red enhances the focus on detail and enforces thorough
processing of information. These effects may prove to be beneficial in a vast variety of lighting
applications such as the quick assessment of detailed information on computer screen in traffic
control, high-pressure, high-risk environments such as an airplane cockpit, power plant control
stations or defusing explosives. Red-induced detail orientation may aid the controllers in
resolving emergency situations. On the other hand, red lighting may also be beneficial in
academic tasks, which require detail-orientation such as complex mathematics exercises.
Lastly, as already mentioned in the theoretical framework, the color of the light may influence
how we perceive and elaborate advertisement. In this case the colored light could be used to set
the focus on certain products of features of the advertisement.
However, until now there is no evidence that the effects of color may also be achieved
by colored ambient lighting. By using the paradigm of hierarchically organized stimuli by
Navon (1977), the aim of this master thesis is to investigate whether the effects of background
color on visual processing of hierarchically organized stimuli may also be obtained by ambient
lighting. To find an answer to this research question, we started on conducting research on the
effects of color on the global precedence effect in the processing of hierarchically organized
stimuli. In a pilot study, which was based on the study by Michimata et al. (1999), we
investigated the effects of three different background colors on the GPE. Since the pilot did not
yield the expected results, the first experiment was conducted as an exact replication of the
study by Michimata et al. (1999). We continued with a second experiment on the effects of
colored backgrounds on the global precedence effect. Furthermore, we investigated the effects
of red background lighting on the magnocellular pathway of the visual system. Lastly, a third
experiment was carried out in which the color manipulation was achieved with colored ambient
11 Pilot study - Introduction
The first research question that arises in this master thesis is to find evidence for the effects of
a red background color on the global precedence effect in the identification of hierarchically
organized stimuli. For this purpose a pilot study was conducted which aimed to replicate the
results made by Michmimata et al. (1999). To investigate these effects we chose to conduct a
visual identification task of hierarchically organized stimuli on different colored backgrounds.
The stimuli used on this study were based on the stimuli used by Michimata et al. (1999). By
letting the participants identify shapes with a global feature (square or diamond) and local
features (square or diamond) we aimed to investigate whether the global precedence effect can
be attenuated in a red background.
We chose to conduct the tasks on three different backgrounds. A red and a green
background were used to investigate the effects of color as suggested by Michimata et al.
(1999). Furthermore, we chose to add a grey background as a baseline condition. Every
participant completed the same tasks on all backgrounds. By comparing reaction times and error
rates in the identification of the stimuli, we aimed to find evidence that the global precedence
effect appears less strong in the red background condition compared to the other conditions.
Contrary to the original study, we presented the stimuli on much brighter displays in the hope
that this would increase the effects of the background color on visual processing. We
furthermore presented the stimulus on a random point on the screen to avoid anticipatory
effects.
We expected that in the identification of the stimuli, we would find evidence for a
global-to-local interference in the identification of local features in incongruent stimuli (i.e.
higher reaction times on incongruent local stimuli compared to congruent local stimuli). We
furthermore expected this interference to be less present in the red background compared to the
12 Pilot study - Method
Participants
Twelve Participants (5 female, 7 male) took part in the study. The age of the participants ranged
from 23 to 31 years with a mean age of 25.75 years. Ten of the participants were right-handed,
one was left-handed and one participant indicated that he was both-handed. All participants
were recruited via non-probability convenience sampling and were employed by Philips at the
moment of the study.
Materials
Computers
The experiment was presented on a computer with a Windows 7 operating system with a
NVIDIA Quadro K620 graphics card. The task was conducted using the program psychopy2
(Peirce, 2007). Assessment of the reaction time was done by using a keyboard which was
connected to the computer via USB.
Screen and background colors
The stimuli were presented on a high - resolution 27” MultiSync PA272W-BK screen with a
60 hz refresh rate. Three different background screen colors were used. The indicated x and y
values refer to the CIE 1931 color space (CIE, 1931), which can be found in the attachments
(Appendix A). The three colors ([x], [y]) used were: Red ([0.6428], [0.3248]), Green ([0.2309],
[0.6801]) and Grey ([0.3213], [0.3284]). Luminance was assessed with a photospectrometer
(JETI Specbos 1211, JETI Technische Instrumente, Jena, Germany) prior to the experiment.
All backgrounds were isoluminant with a luminance of 44 cd/m2. The screen had a diameter
of 56.48 x 32.02 degrees of visual angle (58 x 31 cm), with a resolution of 2560 x 1440 pixels.
A chin rest was placed 54 cm in front of the screen.
Stimuli
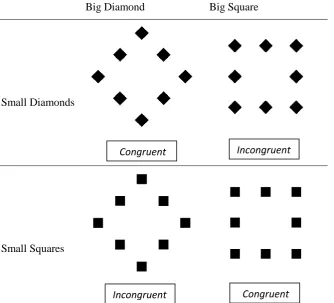
The stimuli in this study were large figures, which were composed of eight smaller figures. The
figures differed on two levels: The large shape (global) of the stimuli, which could be either a
square or a diamond and the smaller shapes (local), which could be either squares or diamonds.
This led to four possible combinations (see
). The stimuli could be either congruent (small and large shape were the same) and incongruent
13 visual angle. The large shapes had a diameter of 4.24 x 4.24 degrees of visual angle. The stimuli
were colored black (x [0.2642], y [0.2463]) had a luminance of 0,23 cd/m2.
Big Diamond Big Square
Small Diamonds
[image:14.595.75.410.155.458.2]Small Squares
Figure 1. Overview of the different stimuli of the pilot study.The stimuli could either differ on a global level
(big square or big diamond, columns) or on a local level (small squares or small diamonds, rows). The table
shows all four possible combinations.
Procedure
The researcher explained the experiment to the participants by showing them the different
figures and explaining the organization, duration and tasks of the experiment. Prior to the
experiment the participants filled in an informed consent (Appendix B) and a demographic
questionnaire (Appendix C).
The participants were instructed to sit down in front of the screen and place their head
on the chin rest. Besides the screen, there was no other source of lighting in the room. The entire
experiment consisted of 576 trials. 24 trials were given to each of the 24 conditions, defined by
an orthogonal combination of background color (red/green/grey), task (global/local),
congruency (congruent/incongruent) and figure (figure which had to be identified:
square/diamond). The experiment was divided into three sessions, one for each background Incongruent
Incongruent Congruent
14 color. Every session consisted of two blocks, one local and one global figure identification task.
Before each block, the participants were instructed to identify either the stimulus on a global
level (large figure) or on a local level (small figures) by pressing the corresponding key on the
keyboard. Prior to each stimulus, the participants were instructed to fixate a cross (black (x =
[0.2642], y = [0.2463]); size: 0.11 x 0.11 degrees of visual angle) which was situated in the
middle of the screen. The cross was presented for 750ms. When the cross disappeared, the
stimulus was then presented for 200ms. For every trial, the stimulus appeared on a random point
which was situated on a radius of 1.54 degrees of visual angle from the middle of the screen.
The participant had 9 seconds to give an answer. If he/she had not answered by that time, the
response was marked as incorrect. Each block was preceded by 8 practice trials, in which the
participants were given feedback on their answer (Correct/incorrect, reaction time in case that
answer given was correct). No feedback was given on the subsequent experimental trials. Half
of the subjects performed the global tasks first, followed by the local tasks. The other half of
the participant completed the tasks in the opposite order. The order of the color and the tasks as
well as finger-response mapping was counterbalanced across participants.
Data analysis
For each subject, the median reaction time (RT) of all correct answers and mean error rate (ER)
for each of the 24 experimental conditions was computed. For the ANOVA, the reaction times
were further normalized by an inverse transformation (1/RT) (see Appendix D, Table D1). The
median of the inverted reaction times per condition and the error rates were each compared in
a 3x2x2x2 repeated measures analysis of variance defined by a combination of Background
(Red/Green/Grey), Task (Global/Local), Congruency (Congruent/Incongruent) and Figure
(Square/Diamond). Furthermore, both reaction times and error rates were subjected to a 2x2x2
15 Pilot study - Results
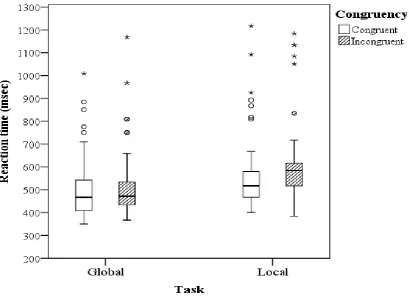
Reaction time: Main effects
The results show that the participants reacted faster in the identification of the large shapes
(mean = 530 msec) compared to the identification of the smaller shapes (mean = 579 msec).
This is indicated by a significant task main effect (F(1,11) = 66.634, MSe = .073 , p<0.001)
(Figure 1). Furthermore, participants reacted faster on the congruent stimuli (mean = 526 msec)
compared to their incongruent counterparts (mean = 556 msec) which is indicated by a
significant main effect of the factor congruency (F(1,11) = 21.096, MSe = .036, p=0.001). No
significant differences in reaction time have been found between the different backgrounds or
between the reaction times on squares compared to diamonds (both main effects are
non-significant).
Figure 2. Pilot study: Boxplot of the median reaction times of all 12 participants on the global and the local task.
The circles indicate outliers which are further than 1.5 interquartile ranges from the medianwhile the stars indicate
“extreme” outliers which are further than 1.5 interquartile ranges from the median. The error bars indicate the
smallest (lowest) and the biggest (highest) non-outlier value. The horizontal line within each boxplot indicates the
16 Reaction time: Interaction effects
The results show that the amount of interference (Incongruent – Congruent) of the local shapes
on global tasks (mean = 15 msec) was significantly lower than the interference of the global
shapes on the identification of local shapes (45.782 msec), which indicates the presence of the
global precedence effect. This is shown by the significant task x congruency interaction effect
(F(1,11) = 9.090, MSe = .014, p=0.012) (figure 3). In addition, participants identified squares
faster than diamonds for congruent stimuli (Square = 509.495 msec, Diamond = 543.321) but
identified diamonds faster than squares in incongruent stimuli (Square = 570 msec, Diamond =
542.751 msec) which is shown by a significant congruency x figure interaction effect (F(1,11)
= 65.929, MSe = .009, p < .001). Contrary to our predictions, no differences in the amount of
global-to-local interference in the identification of small shapes (GPE) has been found across
the three different backgrounds since significant three way interaction between the factors
background, task and congruency was not significant (F(1,11) = 1.339, MSe = 22, p = .283)
(figure 4).
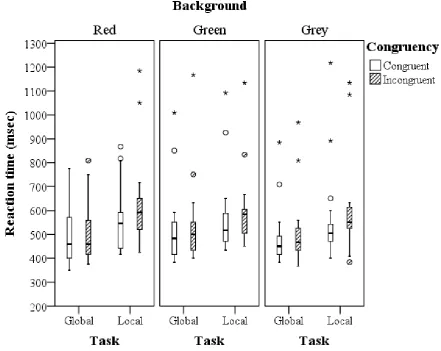
[image:17.595.85.495.380.676.2]17 Reaction time: Effects per color
The analysis per background color shows that the amount of global-to-local interference is
significantly higher than the local-to-global interference in both the red and the grey
background, indicating the global precedence effect. This can be seen by a significant task x
congruency interaction effect for red (F(1,11) = 11.092, MSe = .009, p = .007) and grey (F(1,11)
= 5.087, MSe = .022, p = 0.045) (Figure 4). Contrary to our expectations and the non-significant
background x task x congruency interaction effect, there was no significant difference in the
amount of interference (global-to-local vs. local-to-global) in the green background which may
be an indication that the global precedence effect did not take place in this color condition (as
seen by a non-significant task x congruency interaction (F(1,11) = .939, MSe= .016, p = .353).
An overview of all effects per background color can be found in the appendix (Appendix, Table
E2 )
[image:18.595.78.520.329.680.2]18 Error rate: Main effects
Participants made more errors in identifying the large shapes (6.34%) compared to the
identification of the smaller shapes (5.19%) which is shown by a significant task main effect
(F(1,11) = 5.569, MSe = 17.200, p = 0.038). Furthermore, participants have a higher error rate
for incongruent stimuli (6.87%) compared to their incongruent counterparts (4.67%) which is
indicated by the significant congruency main effect (F(1,11) = 13.392, MSe = 26.071, p =
0.004).
Error rate: Interaction effects
We found a lower difference in error rate between congruent and incongruent judgments in the
global tasks (Incongruent = 6,721%, congruent = 5,961%) than in the local tasks (Incongruent
= 7,010%, congruent = 3,365%), which is shown by a significant task x congruency interaction
effect (F1,11) = 6.653, MSe = 22.513, p = 0.026). Furthermore, in the global tasks, participants
made more errors identifying diamonds (6,950%) than squares (5,732%) while in the local
tasks, they made more errors identifying squares (6,257%) than identifying diamonds (4,118%)
which is shown by the significant interaction between the factors task and figure (F1,11) =
8.505, MSe = 23.849, p = 0.014) (figure 5). Lastly, we found that participants made more errors
identifying the diamonds in comparison with the squares in congruent stimuli (squares =
3.361%, diamonds = 5.965%) while they made more errors identifying the squares in
incongruent stimuli (squares = 8.628%, 5.103%) which can be seen by the significant
congruency x figure interaction effect (F(1,11), MSe = 54.518, MSe = 12.403, p < .001). An
overview of the effects on error rate per background color can be found in the appendix
20 Pilot study - Conclusion
The results of the first pilot study show that global stimuli are processed faster than local stimuli
with mean difference of ~70 ms. This effect has been found in various other experiments on
global and local processing (Goto et al., 2004; Hübner & Volberg, 2005; Love, Rouder, &
Wisniewski, 1999) and is in line with the findings of Michimata Chikashi et al. (1999).
Furthermore, the significant interaction effect between task and congruency indicates a
global precedence effect. This goes in line with preceding research indicating that reaction times
on global features are not only faster, but that reaction times on local identification may be
higher if the global features are incongruent to the local information.(Hughes, Layton, Baird,
& Lester, 1984; Kimchi, 1992; Navon, 1977,Navon 1981). An analysis of the error rates
revealed a higher error rate in global compared to local stimuli. Furthermore, we can see a
significant congruency main effect, indicating that congruent stimuli are processed faster than
incongruent stimuli. However, if we take into account the task x congruency interaction effect,
we can state that this is only true for the global tasks, while no differences between congruent
and incongruent stimuli can be found in local tasks. Contrary to the results of Michimata
Chikashi et al. (1999), the global precedence effect does take place in tasks with a red
background. Even more, the current results indicate that the global-to-local interference takes
place in the red background but not in the green background, which is the opposite of what the
original study suggested. Furthermore, we found significant interaction effects between the
type of figure and the congruency of the stimulus. However, this interaction surpasses the scope
21 Experiment 1 – Introduction
In the pilot study we tried to replicate the effect of Michimata et al. (1999) who proposed that
the global precedence effect in the processing of hierarchically organized stimuli can be
attenuated by a red background. Although the results of our study suggest the existence of a
global-to-local advantage as well as a global-to-local interference in the processing of the
stimuli, we did not find an indication for an attenuation of the GPE by a red background. We
even found contradicting results, which suggest that the global precedence effect does not occur
in the green background. However, there were some difference between the pilot and the
original study, which may hinder a direct comparison of the effects of the two studies. The first
difference was, that the luminance of the background in the pilot study (40 cd/m2) was
significantly higher than in the original study (4 cd/m2). Given that our backgrounds were ten
times as bright as the backgrounds in the original study, this difference in luminance may have
affected color perception of the participants. Furthermore, the size of the stimuli between the
pilot and the original study differed. Studies showed that stimulus size may also have an
influence on visual processing of hierarchically organized stimuli (Blanca Mena, 1992; Kinchla
& Wolfe, 1979) in terms that big stimuli are usually processed faster than small stimuli, an
effect that is most striking in local tasks. Although this effect does not explain the absence of
the effects of background color, the stimulus size in our study was larger than in the original
one. Lastly, the location of the stimulus in the pilot study was a random point on a diameter
around the middle of the screen. Research found that in a non-attended stimulus (i.e. when the
participant cannot anticipate the location where the stimulus will appear) the global precedence
effect takes place far less than in attended stimuli (Paquet & Merikle, 1988). Although this
difference does not account for the differences in the effects of the background color, it is a
factor which has to be changed to allow direct comparison of our results and the results by
Michimata et al. (1999). In Experiment 1, we changed the parameters screen brightness,
stimulus size and stimulus location according to the original study to investigate the effects of
background color on the global precedence effect in visual perception. Based on the results of
Michimata et al. (1999) we expect that global-to-local interference will take place in the
identification of local stimuli, which will result in a prolonged reaction time. We furthermore
expect that the global-to-local interference will be more present in the green background,
22 Experiment 1 - Method
Participants
Eighteen participants (14 male, 4 female) took part in the experiment. The age of the
participants ranged from 22 to 46 years with a mean age of 27.22 years. All participants were
recruited via non-probability convenience sampling and were employed by Philips at the
moment of the study. Sixteen of the participants were right-handed and 2 of the participants
was left-handed. All participants signed an informed consent prior to participating in the study.
Materials
Computer
The same computer and display as in the pilot were used for the assessment in this experiment.
Background colors
Three different background screen colors were used. The indicated x and y values refer to the
CIE 1931 color space (CIE, 1931), which can be found in the attachments (Appendix A). The
three colors ([x], [y]) used were: Red ([0.6166], [0.3193]), Green ([0.2338], [0.6207]) and Grey
([0.3173], [0.3224]). Luminance was assessed with a photospectrometer (JETI Specbos 1211,
JETI Technische Instrumente, Jena, Germany) prior to the experiment. All backgrounds were
equiluminant with a luminance of 4 cd/m2. The room in which the experiment took place was
illuminated with dim light (illuminance was equal to 6 lx). The chin rest was placed 54 cm in
front of the screen.
Stimuli
For this experiment, the same kind of stimuli as in the pilot were used. However, the size of the
stimuli was adjusted to fit the size of the stimuli used in the study of Michimata et al. (1999).
Small figures had a diameter of 0.5 x 0.5 degrees of visual angle. Big figures had a diameter of
3.5 x 3.5 degrees of visual angle. As in the pilot, the stimuli were colored black (x [0.2642], y
[0.2463]) had a luminance of 0,23 cd/m2.
Procedure
Prior to the experiment the participants filled in an informed consent (Appendix B) and a
23 procedure of the pilot. However, the position of the stimuli was always fixed to the middle of
the screen and stimulus presentation time was changed to 150 ms.
Data analysis
For each subject, the median reaction time (RT) of all correct answers and mean error rate (ER)
for each of the 24 experimental conditions was computed. Furthermore, the reaction times were
normalized by taking the inverse (1/RT) (see Appendix D, Table D2). The inverted reaction
times and the error rates were each compared in a 3x2x2x2 analysis of variance defined by a
combination of Background (Red/Green/Grey), Task (Global/Local), Congruency
(Congruent/Incongruent) and Figure (Square/Diamond). Furthermore, both reaction times and
error rates were subjected to a 2x2x2 ANOVA (Task, Congruency, and Figure) per background
24 Experiment 1 - Results
Reaction time: Main effects
In the overall analysis, the global task (mean = 468 msec) was performed faster than the local
task (mean = 528 msec) which is shown by a significant task main effect (F(1,17) = 64.654,
MSe = .110, p < .001). Furthermore, participants reacted faster to the congruent stimuli (mean
= 489 msec) than to the incongruent stimuli (mean = 507 msec) which produced a significant
congruency main effect (F(1,17) = 51.208, MSe = ,013, p < .001). No differences in reaction
time were found between the three different background or the two different figures (squares
and diamonds).
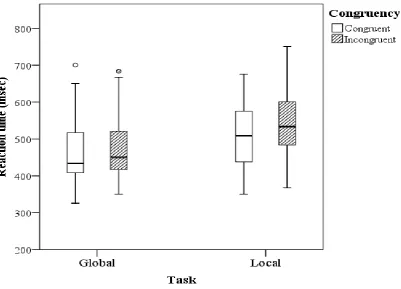
Reaction time: Interaction effects
As expected, the amount of interference (Incongruent – Congruent) was higher in the local task
(mean = 32.671 msec) in comparison to the global task (mean = 3.8 msec). The presence of the
global precedence effect is indicated by the significant task x congruency interaction effect
[image:25.595.87.489.413.702.2](F(1,17) = 15.475, MSe = .019, p = .001) (figure 6).
25 Furthermore, we found that participants were faster in identifying squares than diamonds in
congruent stimuli, while they were faster in identifying the diamonds in incongruent stimuli,
which is shown by the significant congruency x figure interaction effect (F(1,17) = 23.869, MSe
= .014, p < .001). Contrary to the expectations, the global precedence effect took place in every
condition and was not modified by the background color which is shown by a non-significant
interaction between the factors background, task, and congruency (F(2,34) = .742, MSe = .009,
p = .484) (figure 7). An overview of all effects on reaction time can be found in the Appendix
[image:26.595.84.509.267.557.2](Appendix E, Table E4).
Figure 7. Experiment 1: Boxplot of the median reaction time of all 18 participants for the global and local tasks divided into congruent/incongruent stimuli for the red, green and grey background. For further information about the elements of the boxplot see figure 2.
Error rate: Main effects
The analysis of the error rates revealed that participants made more errors in the incongruent
(7.991%) than in the congruent (5.984%) stimuli which is indicated by a significant congruency
main effect (F(1,17) = 5.019, MSe = 86.672, p = .039). No differences could be seen between
the different tasks, figures or backgrounds, although we may suspect that participants in the red
26 which is indicated by an almost significant background main effect (F(2,34) = 3.124, MSe =
39.095, p = .057).
Error rate: Interaction effects
The analysis of the interaction effects revealed that the advantage of congruent compared to
incongruent stimuli in the identification of the smaller shapes is way stronger in the green
background compared to the red and grey background. This is indicated by a significant
three-way interaction between the factors background, task, and congruency (F(2,34) = 3.793, MSe
= 39.283, p = .033) (Figure 8). Also, we found that participants made slightly less error
identifying diamonds in the incongruent stimuli (difference Squares (%) – Diamonds (%) =
-1.464), but made less errors identifying the squares in the congruent stimuli (difference = 3.548)
which is indicated by a significant congruency x figure interaction effect (F(1,17) = 6.802, MSe
= 99.720, p = .018). An overview of all effects on error rate can be found in the Appendix
(Appendix E, Table E5).
[image:27.595.79.517.371.719.2]27 Experiment 1 - Conclusion
The results of Experiment 1 indicate that the identification of local stimuli takes less time than
the identification of global stimuli, which goes in line with the results of our pilot study as well
as other preceding research (Kimchi, 1992; Mottron, 2000; Navon, 1977). Furthermore, the
results show that participants identify congruent stimuli faster than incongruent stimuli.
However, the interaction between the sort of the task and the congruency reveals that this effect
only happens in the identification of the local stimuli. In local tasks, the global stimuli interfere
with the identification of the local stimuli which indicates a global precedence effect (GPE)
which was also found in preceding research (Goto et al., 2004; Hughes et al., 1984).
However, contrary to the results of Michimata et al. (1999) and contrary to the results
of our pilot study, no difference in the appearance of the GPE were seen in the different color
conditions. The global precedence effect took place in all three color conditions in Experiment
1, which suggests that the GPE is not moderated by background color. In contrast to the pilot
study, all parameters were altered to match the parameters which were reported in the study by
Michimata et al. (1999). The only known factor which differed between Experiment 1 and the
original study was, that Michimata et al. (1999) started the experiment by letting the participants
do a flicker task to set the subjective equiluminance of the green and red background. In our
study, the participants did not perform a flicker task since the colors were set to be equally
luminant with a photospectrometer beforehand. In this case, the subjective luminance of the
colors may have differed in our experiment. However, this may not account for the missing
effects of a red background on the global precedence effect. Given that the experiment did not
yield the expected results concerning the effects of a red background on visual processing, a
28 Experiment 2 - Introduction
The explanation for the absence of the GPE on a red background proposed by Michimata et al.
(1999) concerns the function of the magnocellular pathway. Research has shown, that the
function of the magnocellular pathway may be inhibited by a red background color (Breitmeyer
& Breier, 1994; Chapman et al., 2004; Chase et al., 2003; Edwards et al., 1996). Since the
magnocellular pathway is inhibited by a red background color, Michimata et al. (1999)
proposed that that the inhibition of the magnocellular pathway on a red background may lead
to an absence of the global precedence effect and that the processing of hierarchically organized
stimuli is partially mediated by the magnocellular pathway. Neither our pilot study nor the
results of Experiment 1 showed an effect of a red background color on the processing of those
stimuli. However, we did not control for the inhibition of the magnocellular pathway, which
does not permit us to draw conclusions concerning the connection between the processing of
hierarchically organized stimuli and the functioning of the magnocellular pathway. Research
has shown, that the magnocellular pathway is mostly responsible for the processing of low
spatial frequencies, while its counterpart, the parvocellular pathway, is responsible for the
processing of high spatial frequencies (Breitmeyer & Breier, 1994; Bruno G. Breitmeyer &
Williams, 1990) and that the magnocellular pathway can be inhibited by red light or red
background color (Breitmeyer & Breier, 1994; Chapman et al., 2004; Chase et al., 2003;
Edwards et al., 1996). Garofalo, Ferrari, & Bruno (2014) carried out an experiment which
included a 2-Alternative-Forced-Choice orientation discrimination task on red, blue and grey
isoluminant backgrounds. In this experiment, the participants had to identify the orientation of
Gabor patches at different spatial frequencies. In accordance with previous research, their
results showed lower accuracy and slower reaction times when a red background compared to
a blue or a grey background surrounded the stimuli. Furthermore, this effect was strongest for
low spatial frequency Gabor patches. However, to date, no experiment tried to combine the
inhibition of the magnocellular pathway and its effects on the processing of spatial frequencies
with the processing of hierarchically organized stimuli in one experiment. The next experiment
of this study will combine the stimuli used by Michimata Chikashi et al. (1999) and Garofalo,
Ferrari, & Bruno (2014) with the aim to be able to draw conclusions whether the processing of
hierarchically organized stimuli is in fact mediated by the functioning of the magnocellular
pathway in colored backgrounds. Based on previous literature as well as our previous
experiments, we expect the global shape to interfere with local identification if the stimuli are
29 stimuli with a red background compared to a blue or green background due to the suppressive
30 Experiment 2 - Method
Participants
Sixteen Participants (3 female, 13 male) took part in the study. The age of the participants
ranged from 22 to 46 years with a mean age of 25.63 years. All participants were recruited via
non-probability convenience sampling and were employed by Philips at the moment of the
study. All participants signed an informed consent prior to participating in the study.
Materials
Computers
The same computer and display as in the previous experiment were used for the assessment in
this experiment.
Background colors
Three different background screen colors were used. Contrary to the previous experiment, the
grey background was changed to a blue background. The indicated x and y values refer to the
CIE 1931 color space (CIE, 1931), which can be found in the attachments (Appendix A). The
three colors ([x], [y]) used were: Red ([0.6398], [0.3239]), Green ([0.2321], [0.6702]) and Blue
([0.1566], [0.0845]). Luminance was assessed with a photospectrometer (JETI Specbos 1211,
JETI Technische Instrumente, Jena, Germany) prior to the experiment. All backgrounds were
isoluminant with a luminance of 21,3 cd/m2.
Stimuli
The stimuli in this study were big figures which were composed of four smaller aligned Gabor
patches. The small Gabor patches could either be aligned in a 0 degree angle or a 90 degree
angle resulting in a horizontal or vertical orientation for the big stimuli. The grating of the Gabor
patches also could be oriented in a 0 or 90 degree angle, resulting in either horizontal or vertical
orientation of the Gabor patches. Furthermore, the Gabor patches could have a grating with
either low or high spatial frequency (0.5 degree/cycle and 4 degree/cycle respectively). In total,
8 different stimuli were presented to the participants resulting from a combination of global
orientation (horizontal/vertical), local orientation (horizontal/vertical) and spatial frequency
(low, high) (table x). The big stimuli had a size of 31.5 x 7.5 degrees of visual angle (horizontal)
and 7.5 x 31.5 degrees of visual angle (vertical) and the small stimuli had a size of 7.5 x 7.5
31 the perceived size of the stimuli may differ. The stimuli were composed of two different shades
of grey ([x], [y]): Shade 1([0.3217], [0.3311]) and shade 2 ([0.3221], [0.3298]) with a contrast
(Michelson contrast) of 0.4 and a mean luminance of 46.92 cd/m2.
Global vertical Global horizontal
Low
spatial
frequency
Local
vertical
Local
horizontal
Global vertical Global horizontal
High
spatial
frequency
Local
vertical
Local
horizontal
Figure 9. Table of the different stimuli that were used in the study. The stimuli could differ on a global level
(Global vertical or global horizontal, columns) as well as on a local level (local horizontal or local vertical, rows).
Furthermore, each stimulus was presented at high spatial frequency (4 cycles per degree) or low spatial frequency
(0.5 cycles per degree). The table shows all eight possible combinations. For the high spatial frequency stimuli,
the contrast was augmented to make them visible in the figure. A high resolution image of the high spatial
[image:32.595.73.526.151.599.2]32 Procedure
The experiment took place in a laboratory room (illuminance = 7 lx). Prior to the experiment
the participants filled in an informed consent (Appendix B) and a demographic questionnaire
(Appendix C).
The entire experiment consisted of 576 trials. 24 trials were given for each of the 24
conditions, defined by an orthogonal combination of background color (red/green/blue), task
(global/local), congruency (congruent/incongruent) and spatial frequency (high/low). The
experiment was divided into three sessions, one for each background color. Every session
consisted two blocks, one local and one global search task. Before each block, the participants
were told to identify the stimulus orientation (horizontal/vertical) on a global level (big figures)
or on a local level (small figures) by pressing the corresponding button on the keyboard. Prior
to each stimulus, the participants were instructed to fixate on a cross in the middle of the screen.
The cross was presented for 750ms. When the cross disappeared, the stimuli was then presented
for 100ms. The stimuli were always presented at the center of the screen. The participant had 9
seconds to give an answer. If he/she had not answered during that time, the response was
marked as wrong. Each block was preceded by 16 practice trials, in which the participants were
given feedback on their answer as well as their reaction time. Half of the subjects performed
the global tasks first, followed by the local tasks. The other half of the participants completed
the tasks in the opposite order. Similar to the two preceding experiments, the order of the color
and the tasks as well as finger-response mapping was counterbalanced among participants.
Data analysis
For each subject, the median reaction time (RT) of all correct answers and mean error rate (ER)
for each of the 24 experimental conditions was computed. Furthermore, the reaction time was
normalized by using inverse RTs (1/RT) (see Appendix D, Table D3). The different normalized
reaction times and error rates were each compared in a 3x2x2x2 repeated measures Analysis of
Variance (ANOVA) defined by a combination of Background (Red/Green/Grey), Task
(Global/Local), Congruency (Congruent/Incongruent) and spatial frequency (High/Low).
Furthermore, both reaction times and error rates were subjected to a 2x2x2 repeated measures
Analysis of Variance (ANOVA) (Task, Congruency, and spatial frequency) per background
33 Experiment 2 - Results
Due to measurement errors, one participant had to be excluded from the data analysis. The
following data analysis was conducted with the remaining 15 participants.
Reaction time
The analysis revealed that participants reacted faster when identifying global stimuli (402.669
msec) than when identifying local stimuli (556.500 msec) which is confirmed by a significant
task main effect (F(1,14) = 108.394, MSe= .381, p < .001). Furthermore we can see that
participants react faster to congruent compared to incongruent stimuli which is indicated by a
significant congruency main effect (F(1,14) = 17.240, MSe = .012, p = .001). However, we
found that this effect can only be seen in the identification of the smaller shapes while no
difference can be seen in the identification of the global shapes (figure 10). This is confirmed
by a significant interaction between the factors task and congruency (F(1,14) = 13.611, MSe =
[image:34.595.81.517.351.698.2].013, p = .002).
34 Contrary to our expectations, the reaction times of identifying low spatial frequencies did not
differ across the three background colors, which is indicated by a non-significant two-way
interaction between backgroundand spatial frequency (F(2,28) = .046, MSe = .013, p = .955).
The analysis furthermore revealed that in the local tasks, participants reacted faster to low
frequency stimuli (548.629 msec) than to their high frequency counterparts (564.372 msec) but
no such difference could be seen in the identification of global stimuli which is shown by a
significant task x spatial frequency interaction effect (F(1,14) = 9.852, MSe = .012, p = .012,)
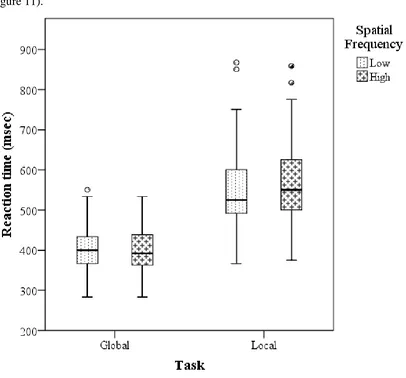
[image:35.595.82.488.222.600.2](figure 11).
Figure 11. Experiment 2: Boxplot of the median reaction time of all 15 participants for the global and local tasks divided into high (4 cycles/degree) and low (0.5 cycles/degree) spatial frequency stimuli. For further information about the elements of the boxplot see figure 2.
Lastly, we found that the amount of global-to-local interference in the identification of the
smaller shapes (GPE) did not differ between the different background color which is indicated
by a non-significant three-way interaction between the factors background, task, and
35 Figure 12. Experiment 2: Boxplot of the median reaction time of all 15 participants for the global and local tasks divided into congruent/incongruent stimuli for the red, green and blue background. For further information about the elements of the boxplot see figure 2.
Reaction time per color
The results of the analysis of the effects per color shows that the advantage of low compared to
high spatial frequencies in the identification of local elements did not occur in all color
conditions. We can see participants reacted faster to local low compared to local high spatial
frequency stimuli in the blue color condition, as indicated by a significant task x spatial
frequency interaction effect for the blue background (F(1,14) = 27.822, MSe = .004, p < .001)
(figure 13). However, in the green and red background, this advantage cannot be found which
is shown by a non-significant two way interaction of the factors task and spatial frequency in
the red (F(1,14) = 1.799, MSe = .010, p= .200) and green (F(1,14) = 3.394, MSe = .010, p
=.087) background.
Furthermore, the analysis revealed that the global precedence effect seems to have taken
place in all colors with high frequency stimuli but does only occur in the green and red condition
with low frequency stimuli. The only condition in which the global precedence effect seemed
to be suppressed is a blue background with low frequency stimuli since the three-way
36 the blue background (F(1,14) = 5.149, MSe = .007, p = .038). An overview of the other effects
[image:37.595.83.488.119.464.2]per background color can be found in the Appendix (Appendix E, Table E6).
Figure 13. Experiment 2: Boxplot of the median reaction time of all 15 participants for the global and local tasks divided into high (4 cycles/degree) and low (0.5 cycles/degree) spatial frequency stimuli for the red, green and blue background. For further information about the elements of the boxplot see figure 2.
Error rate
The analysis of the error rates revealed that participants made significantly more errors
identifying the incongruent stimuli compared to the congruent stimuli which is indicated by a
congruency main effect (F(1,14) = 16.025, MSe = 19.210, p = .001). No differences in error
rate have been found between the different tasks, backgrounds or spatial frequencies as
indicated by no significant main effect for any of those factors. Furthermore the analysis
revealed that a higher error rate on incongruent (compared to congruent) stimuli could only be
found in the identification of the smaller shapes with a high spatial frequency, which is indicated
by a significant task x congruency x spatial frequency interaction effect (F(1,14) = 7.700, MSe
= 22.528, p = .015). An overview of all effects on error can be found in the Appendix (Appendix
37 Experiment 2 - Conclusion
The overall analysis shows a significant global advantage in reaction time as well as a global
precedence effect (GPE) in incongruent stimuli. Both effects align with previous research
(Bouvet, Rousset, Valdois, & Donnadieu, 2011; Goto, Wills, & Lea, 2004; Kimchi, 1992) as
well as the results of our previous experiments. Contrary to the findings of Michimata Chikashi,
Okubo and Mugishima (1999), a red background did not attenuate the global precedence effect,
which goes in line with the results of the results of our first two experiments. The reaction time
advantage on low compared to high spatial frequencies was only found in the identification of
local elements but not in the identification of the global shape. A possible explanation for this
is that a higher spatial frequency of a stimulus leads to longer reaction times in visual
identification tasks (Gish, Shulman, Sheehy, & Leibowitz, 1986). However, the changes in
spatial frequency in our stimuli did hardly affect the global shape, which is why no differences
between high and low spatial frequencies were found in the global tasks. Due to the suppressive
effect of a red background on the magnocellular pathway, we expected that the advantage of
low compared to high spatial frequency stimuli to be less strong in the red background, since
reaction times on low spatial frequency stimuli were expected to be higher. Based on the
previous argumentation it is important to discuss the low-to-high-advantage in the local
identification only, since it does not occur in the global tasks. The analysis per background
color revealed that participants took more time identifying low spatial frequencies (compared
to high spatial frequencies) in local tasks in the blue background while no such significant
difference was seen in the red and green background. A possible explanation for this could be
that higher wavelengths (i.e. red and green background lighting) attenuate the magnocellular
pathway which leads to longer identification time of low spatial frequency stimuli. The
explanation is backed up by the fact that the low-to-high advantage in local tasks is strongest in
the blue background, weaker (but still almost significant) in the green background and weakest
in the red background. However, this explanation faces one major constraint. The results show
that the attenuation of the low-to-high advantage does not occur because the reaction times for
low spatial frequency are higher in the red and green conditions compared to the blue condition,
but because the reaction times on high spatial frequencies are higher in the blue condition. Thus,
although there is scientific evidence for an attenuation of the magnocellular pathway by a red
background (B G Breitmeyer & Breier, 1994; Garofalo et al., 2014), these mechanisms cannot