Data Mining in an Educational Setting: A Cluster
Analysis of Browsing Behaviour
Rouven Schoppmann
University of Twente P.O. Box 217, 7500AE Enschede
The Netherlands
Graduation Committee Members:
Dr. E. Constantinides
Management Summary
The purpose of this exploratory study is to identify differences in the browsing behaviour of prospective students and admitted students from Germany at the university of Twente. The insights into the browsing behaviour are necessary to aid the marketing
department in understanding high potential leads and how they might be identified. Bachelor and master students were analysed separately.
The study was carried out by adapting the KDD process of gaining knowledge and then using the model together with a clustering technique. As a clustering technique the two-step algorithm from SPSS modeler was used. Which is useful for larger datasets. The analysed data is partially of categorical nature and partially quantitative. Additionally, bachelor, master and prospective students were compared on how frequently they showed certain browsing behaviours.
The findings of this study can be summarized as follows, for master students the E-check is a core behaviour as most of the admitted master students have used it. For bachelor students a core behaviour is asking questions via a webform. For prospective students these behaviours were recorded less frequently. The results of the clustering are that six different behaviours could be identified for admitted bachelor students and seven behaviours could be identified for admitted master students. Regarding high potential leads only tendencies towards certain behaviours could be identified.
The theoretical value of this study is that it contributes to understanding high potential leads from Germany in a higher education setting. The study falls under the MSI research priorities for 2018, specifically the priority of capturing information to fuel growth. The study contributes to the topic of recognizing people anonymously online. The contribution here is on identifying the characteristics on which a certain type of person can be identified as a high potential lead. Furthermore, this study contributes to the evaluation of the potential of leads, by analysing their browsing behaviour.
The practical value of this study lies in the study providing insights into the browsing behaviour of prospective students and admitted students from the university of Twente. These are therefore of value for the marketing department of the university of Twente in
understanding the online audience. Furthermore, this study can be of value to organizations who want to analyse the browsing behaviour of leads, by showing that it is unlikely to find a single behavioural pattern for high potential leads.
Table of Contents
1 Introduction ... 1
2 Literature Review ... 2
2.1 Behavioural Profiles ... 3
2.2 Clustering ... 4
3 Methodology ... 5
3.1 Data and Data Selection ... 5
3.2 Pre-processing and transformation ... 5
3.3 Data Mining ... 6
3.4 Interpretation and Evaluation ... 7
4 Results ... 7
4.1 Behaviours found for Admitted Bachelor Students ... 7
4.2 Behaviours found for Admitted Master Students ... 9
4.3 Behaviours found for Prospective Students ... 11
4.4 Main Differences ... 12
5 Conclusions and Discussion ... 13
5.1 Differences between Admitted Bachelor Students and Prospective Students ... 14
5.2 Differences between admitted Master Students and Prospective Students ... 14
5.3 High Potential Leads ... 15
5.4 Privacy Concerns ... 15
6 Limitations and Further Research ... 16
1
1 Introduction
Starting from 1995 when Amazon started their online business (Thomas, 2015) and the commercialization of the internet began, the need for online marketing arose. Online marketing gave marketers the option to specifically target advertisements to certain people, this was previously not possible through the mass media television and radio. In the year 2017 the total online advertising revenues for the US were $88 Billion which marks a steep increase by 21.4% compared to the year 2016 (IAB 2017). The global spending on digital advertising in 2017 was around $232 Billion according to eMarketer (2018) This shows that online advertising has become important for companies and organizations. The IAB identify several categories of companies that engage in online advertising that range from retail to media related companies. Online advertising is not only used by companies, but also by organisations to voice themselves or by universities to attract students. Online advertisements can take many different forms, from banner displays and videos to audio advertisements used by music streaming portals (IAB 2017). To improve the effectiveness of online advertising, behavioural targeting practices are used which according to Lu et.al (2015) yield a conversion rate which is twice as high as for untargeted advertisements. Conversion rate percentage of people who interact in the desired way with an advertisement, for example registering at a website or buying a certain product. In addition to targeted advertisements being more effective, Goldfarb & Tucker (2011) found that traditional advertisements tend to be ignored. According to Ryan & Jones (2012) it becomes easier for online users to filter out irrelevant information which further stresses the need for meaningful advertisements. Online behavioural targeting was described by Mathews-Hunt (2016) as the collection of online browsing data and assigning the data to interest categories. The data is collected through cookies that are installed on the users browsing device (Jaworska & Sydow, 2008) To analyse the large amounts of data, algorithms are used (Wang et.al, 2017). A frequently used data analysis technique for user segmentation is clustering, where the data entries are grouped in clusters according to their browsing behaviour (Cho et.al, 2005). This enables marketers to identify high potential leads certain groups of people who have a chance of becoming a customer.
2
As the university has an international orientation many students come from different foreign countries. As students from Germany make up the largest group of foreign students (University of Twente Statistics, 2018), this study will focus on prospective students and admitted students from Germany. This study is of value to the University of Twente as it aims at providing insights that help to identify the information needs of prospective students. Particularly which information a prospective student may need to apply to the university. This can be used to find out if it is possible to distinguish high potential leads from other prospective students. Admitted students are classified as former high potential leads for this study. High potential leads are leads which fit the target group of the university and which can be identified through their behaviour (Carroll, 2006). The following research question and sub questions will be answered by this study.
Research Question: How can the differences and similarities in browsing behaviours of prospective students and admitted students from Germany be characterized
Sub Question 1: Which browsing behaviours are found for admitted bachelor students?
Sub Question 2: Which browsing behaviours are found for admitted master students?
Sub Question 3: Which browsing behaviours are found for prospective students?
These three sub questions are designed to first find out which behaviours admitted students and prospective students show. They will therefore establish the basis for the comparison from which the differences will be deducted.
Sub Question 4: Which behavioural browsing patterns characterize a high potential lead?
The fourth sub question focusses on high potential leads, as mentioned before admitted students are viewed for this study as former high potential leads. The difference between this sub question and the first is that the focus lies on the different patterns of browsing behaviours and what the browsing behaviour of a high potential lead may look like.
The browsing behaviour consists of different factors regarding the different activities that were performed by the prospective students and admitted students. To give a few examples the behavioural activities range from educational brochure requests to the completion of an E-check on the eligibility of the prospect for the program. Alongside these activities website metrics as the number of pageviews and the source of the prospect are used. The analysis carried out for this thesis if of exploratory nature and is limited to the data made available by the marketing department of the University of Twente.
2 Literature Review
3
meaningful information might be perceived as an added service and not as an annoyance. Behavioural targeting according to Yan et.al (2009) provides higher conversion rates, due to people with the same browsing behaviour being more likely to click on the same advertisement. This translates into the need of grouping similar patterns of browsing behaviour. These patterns can be used to attract new customers, to build customer loyalty and to boost sales (Alreck & Settle, 2007). Pucinelli et.al (2009) mention that it is important for companies to know how and why customers select certain products. The how component can be addressed by behavioural targeting through the analysis of the browsing behaviour of customers. The data needed for behavioural targeting is collected by installing cookies on the device of the user (Jaworska & Sydow, 2008). The cookies collect what the user does, which pages are visited and how many are visited, also in what order. Cookies are mostly from third party companies that carry out the data mining and analysis (Pierson & Heyman, 2011). Yan et.al (2009) state that the search behaviour of customers is the most important factor for behavioural targeting followed by the onsite behaviour. Carascosa et.al (2015) add that the search behaviour of the customer and the onsite behaviour are the core information needed to effectively target advertisements. A frequently used way for companies to retrieve the information is with the use of Google Analytics, which is free to use, where website metrics and information on each visitor can be exported (Ali et.al, 2014). The outcome of the data collection are big data bases where everything on the browsing behaviour of every website visitor is stored.
Based on the definition from (Mathews-Hunt, 2016) and the prior mentioned literature the definition of behavioural targeting used for this study is: Behavioural targeting is the identification of the needs of customers through analysing their browsing behaviour and fitting online advertisements to these needs. The identification of needs in the case of a university regarding prospective students, is the need for specific information rather than specific products.
2.1 Behavioural Profiles
User segmentation has the goal of grouping users to gain insights into natural groupings and by that find marketing opportunities. From the collected data, a behavioural profile can be created for each website visitor or profiles for groups of visitors, that share a similar behaviour. Feddaoui et.al (2018) state that user profiles, which include all relevant information on the behaviour of the user are the best way to ensure that advertisements are well targeted. There are two types of user profiles, one where the users themselves state their preferences and provide the necessary information and the other where the information are collected by data mining (Bozdag, 2013). Behavioural profiles contain information about the previous browsing behaviour, about the shopping behaviour as well as information about how someone entered the website. Carascosa et.al (2015) mention that at least the search behaviour and onsite behaviour of a customer is needed to target advertisements. Therefore, these are the most important information that must be collected to create a behavioural profile. To get from the raw data to user profiles the literature mentions several ways that revolve around data analysis and data mining (Wang et.al, 2017). Cho et.al (2005) mention clustering as a useful method of data analysis for large data sets.
4
2.2 Clustering
Cluster analysis is a frequently used technique for customer segmentation. (Punj & Stewart, 1983). Clustering aims at showing the natural grouping of the data points. (Jain, 2009). Cluster groupings are based on how similar the browsing behaviours are (Jain et.al, 1999). Clustering is applicable for behavioural targeting as it allows the marketer to quickly analyse large data sets (Yao et.al, 2010). There are two major groups of clustering algorithms (Hair et.al, 2014). Hierarchical clustering algorithms require no a priori definition of the number of clusters and each data point starts as their own cluster (Heller et.al, 2005). The algorithm then merges clusters until only one is left (Hair et.al, 2014). Non-hierarchical clustering requires an a priori definition of the number of target clusters and the browsing behaviours are grouped around the predefined seeds (Hair et.al, 2014). An example of a non-hierarchical clustering algorithm is K-means clustering, where the browsing behaviours are clustered around their means (Wagstaff et.al, 2001). For hierarchical clustering example techniques are the ward method and the nearest neighbour method, where the clusters are formed based on the distance between the data points. (Hair et.al, 2014). Johnson (1967) describe hierarchical clustering as a frequently used method for identifying patterns. In 2005 Heller et.al mentioned hierarchical clustering still as one of the most frequently used methods. The problem with hierarchical clustering algorithms is that they take significantly longer when applied on large data sets and are therefore not recommended for the use on large data set. Non-hierarchical clustering algorithms as for example K-means clustering can be used for large data sets. There are combinations of hierarchical and non-hierarchical algorithms which allow large data sets to be clustered without requiring an a priori definition of the number of clusters. An example of such a technique is the two-step clustering algorithm from SPSS modeler (IBM, 2018). Here a single pass of a non-hierarchical clustering algorithm is performed first, which clusters the browsing behaviours into many groups. Afterwards a hierarchical clustering algorithm clusters the groups created by the first algorithm into the final number of clusters (IBM, 2018). The single pass is done using K-means clustering and was developed to be able to quickly cluster large data sets (Strehl & Ghosh, 2002). The combination of the two methods is usually to have a fast clustering algorithm for large data sets. (Strehl & Ghosh, 2002).
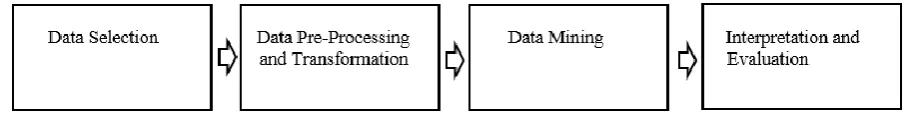
[image:7.595.69.524.613.672.2]Fayyad et.al (1996) developed a model which can be used for data mining. The KDD process covers the steps from the selection of data to the interpretation and evaluation of the results. The original model covers five steps for this study the model has been adapted and reduced to four steps, where as the second step is a combination of the second and third step from the original model (See Figure 1). The KDD process has been adapted multiple times for different studies and has been used in combination with clustering (Srivastava et.al, 1999)
Figure 1 Steps of the KDD-process. Adapted from “The KDD Process for Extracting Useful Knowledge from
5
3 Methodology
The methodology section covers the steps that were mentioned above in the adapted KDD process and provides an overview of the data set and variables. The Study is of exploratory nature and is carried out using a quantitative data analysis technique, namely clustering.
3.1 Data and Data Selection
The first step is to select the data that should be analysed by taking a selection from the whole data. The data for this study is made available by the marketing department of the University of Twente. The CRM data is made available and access to the Google Analytics account of the University of Twente is granted. The CRM data covers the timespan from the 1st of January 2016 to the 31st of December 2017. This is the timespan which will be applied for all data sets and the extracted data from Google Analytics. The CRM data contains information about what activities prospective students have done and what their interest programs are. Furthermore, data on admitted students is provided to see who is admitted. A list of the information sources and Google Analytics variables is provided below.
The extracted Google Analytics data contain information on the source of the prospective students and on the how often the university websites have been visited, an overview of the recorded variables can be seen below this paragraph. The whole data set contains admitted students and prospective students from many different countries and is therefore relatively large. To make the analysis more meaningful for the university this study will focus on admitted students and prospective students from Germany as German students make up the largest group of foreign students (UT statistics). A distinction by faculty or study program will not be made as the ratio of admitted students to prospects is very low and the program of interest does not necessarily have to be the program a prospect ultimately applies for.
3.2 Data Pre-processing and Transformation
The second step of the adapted KDD process is the pre-processing of the data and the transformation of the data. The first step here is to merge the different data sets. This was done by using the WRDID a unique identifier that the university automatically assigns to each visitor of the website. The WRDID also anonymizes the data sets as it is randomly created and contains no demographic information. The CRM data set is then merged together with the data set that contains all the information extracted from Google Analytics. For the analysis only, unique
Information Sources Google Analytics Variables
- E-check - Total number of Pageviews
- E-check eligibility - Total number of Sessions
- PDF download - Total number of Events
- FAQ - Source Direct
- Brochure request - Source E-mail
- Open day application - Source Organic
- Questions via webform - Source Referral
- Source Print
6
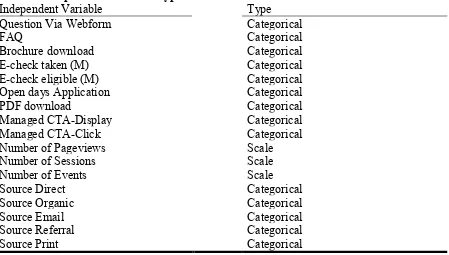
[image:9.595.77.526.299.554.2]entries were used. During the transformation step the original variables from the CRM data are transformed into binary variables where each entry is either yes or no, represented by 1 and 0. This is only the case for the categorical variables as the clustering algorithm would not be able to deal with raw categorical data, due to the lack of a natural metric order (Gibson et.al, 2000). The third step is to divide the data set into Master and Bachelor entries, this is necessary as the E-check is not available for prospects who are interested in a bachelor program. After these steps have been completed the dependent variable is the admission status which has three entries, namely student, dropout and not admitted. Dropouts will not be separately mentioned in the analysis as the focus lies on admitted students and prospective students. There are 17 independent variables of which 14 are categorical and three are metric, for the bachelor related data set the number of categorical variables goes down to 12 (See Table 1). The group of not admitted students which consists of 2252 entries is added to both data sets as the program of interest cannot accurately be determined. This results in the bachelor related data set being 2362 unique entries and, in the master, related data set 2288 unique entries.
Table 1 Independent Variable Types
Independent Variable Type
Question Via Webform Categorical
FAQ Categorical
Brochure download Categorical
E-check taken (M) Categorical
E-check eligible (M) Categorical
Open days Application Categorical
PDF download Categorical
Managed CTA-Display Categorical
Managed CTA-Click Categorical
Number of Pageviews Scale
Number of Sessions Scale
Number of Events Scale
Source Direct Categorical
Source Organic Categorical
Source Email Categorical
Source Referral Categorical
Source Print Categorical
Note M= Only for master students
3.3 Data Mining
7
the clusters differ between the clusters (Rousseuw, 1987). Low values of the Silhouette Coefficient indicate that the clusters overlap, and high values indicate that the data points lie well in their clusters and that overlap is low or absent. Values closer to one indicate that the data points lie well in their clusters, while values closer to zero or minus one indicate that the data points are not lying well in their clusters (De Amorim & Hennig, 2016)
3.4 Interpretation and Evaluation
The last step of the adapted KDD process (Fayyad et.al, 1996) is the interpretation and evaluation of the results from the clustering. For the evaluation the clusters need to be analysed regarding their uniqueness to identify, how valid the results are (Rousseuw, 1987). This is done by again looking at the results from the Silhouette Coefficients that were created by the algorithm to identify the optimal number of clusters. The Silhouette Coefficient indicates how well each data point lies in its cluster (Rousseuw, 1987). De Amorim & Hennig (2016) state that the Silhouette Coefficient has been used in many experiments and has been performing well. A low Silhouette Coefficient would be a limitation of this study as the clustering solution could not be described as good and would therefore not yield satisfying results.
The interpretation of the results is done by analysing the clusters and additionally looking into the percentages for each variable present in the cluster. The presence and absence of variables builds the behavioural patterns for prospective students and admitted students.
4 Results
The results section presents the results for the first three sub questions. A section is devoted to highlighting the most striking differences between prospective students and admitted students. The most frequent behaviours are presented for master students, bachelor students and prospective students.
4.1 Behaviours found for Admitted Bachelor Students
For the bachelor data the clustering solution with six clusters was chosen, the silhouette coefficient for this clustering solution is 0.9 (See Appendix Table 5). The solution with six clusters was chosen as the silhouette coefficient does not increase further with the number of clusters and the clusters become very small. As the silhouette coefficient is close to one it indicates that the data points lie well in their respective clusters. The clusters are named according to the behaviour that is most frequently represented in the cluster (See Table 2). The six clusters are the Master Interest cluster, the Brochure Request cluster, the Questions cluster, the Source Organic cluster, the High Website usage cluster and the Open days and Multiple Behaviours cluster.
The Master Interest cluster is defined by none of the variables for the bachelor data set being present in that cluster. This is the result of many data entries having the E-check as only recorded behaviour. As some of the bachelor students had as only behaviour the E-check the not admitted students with only the E-check as behaviour have also been included in the bachelor data set. The master interest cluster is the biggest cluster with a total of 1298 entries of which 8 behaviours belong to admitted students.
8
this behaviour. Some of the entries have also the behaviour question via webform. This cluster is the second largest cluster and has small averages for sessions, pageview and events. 17 of the 427 entries are admitted students.
The Questions cluster exclusively contains entries that have records for the behaviour question via webform. The cluster is the third largest with 310 entries in total of which 36 are admitted students. This is the highest number of students of all the clusters and the second highest percentage with 11.6%.
The Source Organic cluster is the fourth largest cluster with 201 entries in total. 180 entries have a record for the behaviour source organic. Alongside this behaviour, brochure request and managed CTA-Display are frequently recorded behaviours. 14 of the entries are admitted students and the entries in the cluster have on average one session and 12 pageviews on the website of the university of Twente. They also have on average completed one event on the website.
The High Website Usage cluster is the smallest cluster with only 23 entries in total. 3 of the entries are admitted students, this is the highest percentage of admitted students per cluster with 13%. The cluster has the highest averages for number of sessions, number of pageviews and total events. 2.7 sessions have been recorded on average with 58 pageviews. Almost 17 events have been recorded on average for the entries of this cluster.
[image:11.595.44.562.501.763.2]The Open Days and Multiple Behaviours cluster has 111 entries, which makes it the second smallest cluster of the bachelor data set. The cluster contains 10 entries which are admitted students. This is the only cluster where entries have the behaviour open days application. Other than this the brochure request is the most frequently recorded behaviour and almost all other behaviours, but PDF download and FAQ have been recorded for entries of this cluster. This is also the only cluster where entries have records for source print, source direct and CTA-click.
Table 2 Clusters for the Bachelor Data Set
Variable Master
Interest Brochure Request Questions Organic Source Website High Usage
Open Days Multiple Behaviours
Brochure Request 0 427 0 169 12 83
PDF Download 0 0 0 0 5 0
FAQ 0 0 0 0 3 0
Application Open Days 0 0 0 0 0 18
Question via Webform 0 24 310 30 10 19
Managed CTA-Display 0 0 0 63 2 18
Managed CTA-Click 0 0 0 0 0 19
Source Direct 0 0 0 0 0 28
Source E-mail 0 0 0 0 1 11
Source Print 0 0 0 0 0 15
Source Organic 0 0 0 180 10 18
Source Referral 0 0 0 0 10 27
Sessions (Average) 0 0.056 0 1.069 2.739 1.099
Pageviews (Average) 0 0.557 0 12.756 58.478 10.198
Events (Average) 0 0.056 0 1.547 16.956 1.819
Admitted Students 8 17 36 14 3 10
9
[image:12.595.78.521.201.461.2]Figure 2 shows the percentages of each factor for admitted bachelor students. The most frequently done activity is asking questions via webforms, this was done by 54% of the bachelor students. 41% of the bachelor students request a brochure on the study program. PDF downloads and FAQ visits with 2% and 0% respectively are seldomly used information sources by bachelor students. Only 24 out of the 88 students have record for their source. The most frequent source is organic, which means that most students came from various search engines to the university websites. Call to action buttons are only displayed for 8% of the bachelor students and only one student actually clicked on such a button.
Figure 2 Percentages for Bachelor Students (for corresponding table see Appendix Table 6)
4.2 Behaviours found for Admitted Master Students
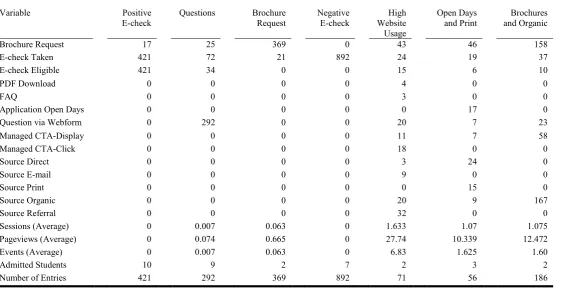
For the master data the clustering solution with seven clusters was chosen, the silhouette coefficient for this clustering solution is 0.8 (See Appendix Table 5). Even though the silhouette coefficient is higher for 14 clusters the clustering solution does not become better due to the clusters becoming very small. The value is close to one which indicates that the data points are lying well in their respective clusters, even though the value is lower than for the bachelor clusters it still indicates a strong clustering solution. The cluster were again named after the behaviour that is most frequent in each cluster (See Table 3). The seven clusters are the Positive E-check cluster, the Questions cluster, the Brochure Request cluster, the Negative E-check cluster, the High Website Usage cluster, the Open Days and Print cluster and the Brochures and Organic cluster.
The Positive E-check cluster has 421 entries of which 10 are admitted students. All entries in this cluster have records for the behaviours E-check taken and E-check eligible. Furthermore, some entries have records for requesting a brochure. The cluster is the second largest cluster and has the highest number of admitted students of all master clusters.
10
request, E-check taken and E-check eligible. The averages for the website metrics are small as they are way below one.
The Brochure Request cluster is defined by all entries having a record for the behaviour of requesting a brochure. The cluster is the third largest cluster with 369 entries in total. Only 2 of the entries are admitted students. Again, the averages for the website metrics have been recorded but are very small.
The Negative E-check cluster is the biggest of the seven clusters with 892 entries. The cluster is defined by all entries having records for the behaviour of taking the E-check, but none has the record for E-check eligible. 7 of the entries are admitted students.
The High Website Usage cluster is the second smallest cluster with 71 entries in total, of which 2 are admitted students. The cluster defined by having the highest averages for the website metrics, namely sessions, pageviews and events. Additionally, the cluster contains entries that have every behaviour recorded, but source print and application open days.
The Open Days and Print cluster is the smallest cluster with 56 entries in total, of which 3 are admitted students. The cluster is the only cluster where the entries have records for the behaviours source print and application open days. Furthermore, the cluster has medium averages for the website metrics with 1 session and 10 pageviews and 1.6 events on average. 46 of the entries have requested a brochure.
[image:13.595.13.575.475.765.2]The Brochures and Organic cluster is the fifth largest cluster with 186 entries in total, of which 2 are admitted students. 167 of the entries have a record for the behaviour source organic and 158 have a record for requesting a brochure. The averages for the website metrics of this cluster are a bit higher than for the open days and print cluster, with 1 session and 12 pageviews and 1.6 events.
Table 3 Clusters for the Master Data Set
Variable Positive
E-check Questions Brochure Request Negative E-check Website High Usage
Open Days
and Print and Organic Brochures
Brochure Request 17 25 369 0 43 46 158
E-check Taken 421 72 21 892 24 19 37
E-check Eligible 421 34 0 0 15 6 10
PDF Download 0 0 0 0 4 0 0
FAQ 0 0 0 0 3 0 0
Application Open Days 0 0 0 0 0 17 0
Question via Webform 0 292 0 0 20 7 23
Managed CTA-Display 0 0 0 0 11 7 58
Managed CTA-Click 0 0 0 0 18 0 0
Source Direct 0 0 0 0 3 24 0
Source E-mail 0 0 0 0 9 0 0
Source Print 0 0 0 0 0 15 0
Source Organic 0 0 0 0 20 9 167
Source Referral 0 0 0 0 32 0 0
Sessions (Average) 0 0.007 0.063 0 1.633 1.07 1.075
Pageviews (Average) 0 0.074 0.665 0 27.74 10.339 12.472
Events (Average) 0 0.007 0.063 0 6.83 1.625 1.60
Admitted Students 10 9 2 7 2 3 2
11
[image:14.595.73.521.283.544.2]Figure 3 shows the percentages of each factor for master students. The main difference to the bachelor students is here that two additional factors come into play, namely the E-check and the eligibility of the E-check. The data set contains 35 master students and 26 of them took the E-check. Of these 26 students 15 had a positive E-check result. With 74% of the students having done the E-check this is the most frequently used information source on the university websites by master students. This is followed by the questions via webform, which 31% of the students have done. In contrast to bachelor students, brochure requests were less frequently used with 22% of students requesting a brochure. For only four master students a source was recorded and again the most frequent source was the organic source. Other records for source were done for the factor direct source. Again, PDF downloads and FAQ visits were not often used by students as information sources. One master student downloaded a PDF, and none visited the FAQ.
Figure 3 Percentages for Master Students (for corresponding table see Appendix Table 7)
4.3 Behaviours found for Prospective Students
12
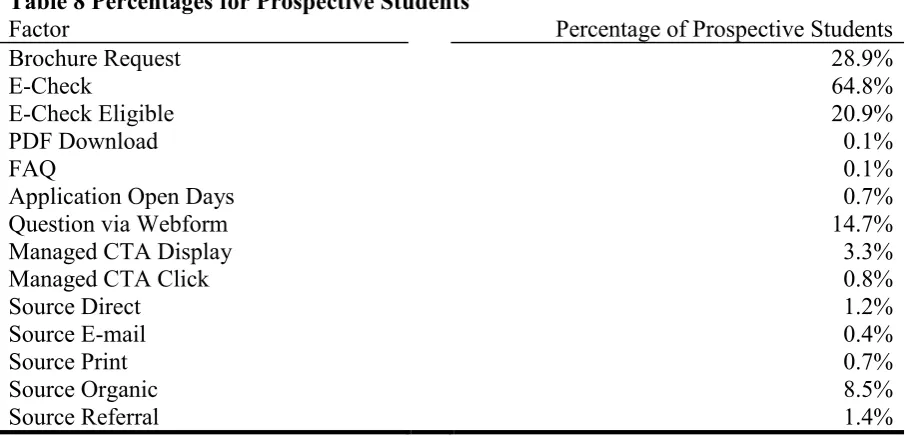
[image:15.595.73.525.172.440.2]for 3.3% of prospects which is a bit lower than the 8% for bachelor students, but the around the same percentage as for master students. CTA-clicks are with less than 1% rare, which is also the case for students. Regarding the source of prospects, the most frequent source are again organic sources with 8.5%. Followed by source referral and source direct. This is roughly the same for master students, but for bachelor students the percentage of organic sources is with 17% twice as high as for prospects.
Figure 4 Percentages for Prospective Students (for corresponding table see Appendix Table 8)
4.4 Main Differences
13
doubles for bachelor students where 17% have a record for organic sources. The other sources are below 1.5% for prospects and have their highest record for bachelor students with 5% for source referral.
5 Conclusions and Discussion
The results presented in the previous chapter will be discussed in this chapter. As the research question states that this study aims at characterizing the differences and similarities between prospective students and admitted students from Germany regarding their browsing behaviour, this section outlines the differences and similarities and provide answers to the sub questions.
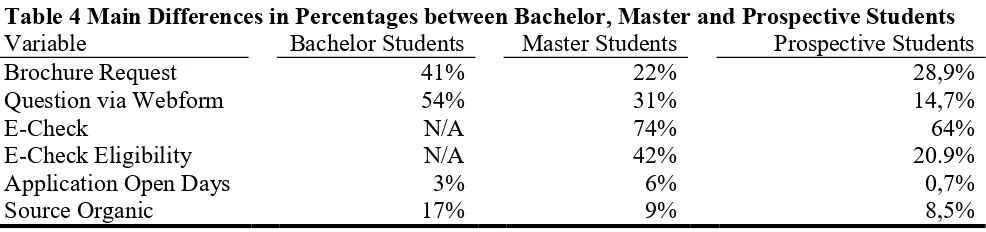
The main differences are that a higher percentage of admitted students showed the behaviours of requesting a brochure, asking questions via a webform, taking the check and applying for open days. Furthermore, admitted master students have a higher percentage of eligible E-checks then prospective students. A characteristic of the differences is that admitted students have more recorded behaviours than prospective students. The similarities can be characterized by saying that both data sets have similar clusters and by that similar browsing patterns. The cluster Questions is present for both data sets. The same goes for the clusters Brochure Request and High Website Usage. This shows that the same behaviours can be identified for bachelor and master students. For the master data set two clusters are revolving around the E-check. The Master Interest cluster from the bachelor data set is noteworthy, the entries from that cluster are in the data set because they did the E-check, which is exclusively for master studies. Interestingly some of the entries in that cluster still got admitted in a bachelor study, even though they showed no other behaviour than completing the E-check. For each data set a cluster was created which covers multiple behaviours, these clusters contain behaviours that did not fit into any other cluster and can probably be split up into very small clusters. The percentage of admitted students in these clusters, shows that having only one behaviour recorded can lead to admission. As every cluster contains admitted students, it also shows that multiple behaviours can lead to admission.
[image:16.595.74.567.136.252.2]For admitted students and prospective students from Germany the most important information sources are the education brochures which they can request and the questions they can ask via webforms. For master students the E-check is added as a third major information source, as it allows international students with a bachelor study degree to assess their eligibility for a certain study program. Another finding is that FAQ and PDF download are not frequently used by prospective students and admitted students alike. Most prospective students with an
Table 4 Main Differences in Percentages between Bachelor, Master and Prospective Students
Variable Bachelor Students Master Students Prospective Students
Brochure Request 41% 22% 28,9%
Question via Webform 54% 31% 14,7%
E-Check N/A 74% 64%
E-Check Eligibility N/A 42% 20.9%
Application Open Days 3% 6% 0,7%
14
entry for their source come from organic search engine results, while e-mail, referral, direct and print were not found very often.
Among admitted master students only 12% have an entry for their source and of these three fourth come from organic search results. In other words, 75% of the admitted students came first in touch with the university via organic searches. 27% of the admitted bachelor students have an entry for their source and most of them have a record for source organic. A study from 2014 has shown that for the educational sector 66% of the customers come from organic search results (Marvin, 2014). This means that this distribution of source channels has also been observed before.
5.1 Differences between Admitted Bachelor Students and Prospective Students
54% of the admitted bachelor students have a record for the behaviour of asking a question via a webform. Therefore, it is no surprise that the cluster Questions contains more admitted students than any other cluster. All entries in that cluster have asking a question via a webform as the only recorded behaviour. This is interesting because it would be logical to directly ask a question when the answer cannot be found anywhere else. This would for example mean that first a brochure is requested and afterwards a question is asked. The highest difference in percentages was recorded for the factor questions via webform. Only 14.7% of prospects asked questions via a webform, while 54% of admitted bachelor students did so. Asking a question via a webform can be viewed as a crucial behaviour for around half of the admitted bachelor students. A possible explanation could be that these students had a higher interest in the study program and by that directly contacted the university.
Furthermore, the behaviour of asking questions via a webform is part of four of the six clusters. Generally educational brochures provide a lot of valuable information. Therefore, it is logical that 41% of the admitted bachelor students have requested them. Compared to the 28.9% of prospective students who have requested a brochure, this shows the tendency of admitted students leaning towards showing behaviours through which they gather larger amounts of information.
5.2 Differences between admitted Master Students and Prospective Students
For admitted master students the most important behaviour is taking the E-check, which was recorded for 74% of the admitted master students. The result of the E-check seems not to matter too much as only 42% of all admitted master students have received a positive result for the E-check. From the clustering results two clusters are devoted to the E-check one where the prospective students and admitted students with a positive E-check are grouped and one where the prospective students and admitted students with a negative E-check are
grouped. The Negative E-check cluster is nearly twice as large as the positive E-check cluster and less of the entries belong to admitted students. This is a counter argument to saying that the result of the E-check is not as important as taking the E-check. On the other side a
15
highest number of admitted students after the Positive E-check cluster. From the High Website Usage clusters can be deducted that revisiting the website or visiting many different pages is not a behaviour which can be attributed only to admitted students.
5.3 High Potential Leads
A high potential lead for a bachelor study could be classified by requesting a brochure and asking a question via a webform. These two behaviours are the core of the behavioural profile of a high potential lead. Additionally, the source of the lead is organic and an
application for the open days has been submitted. Even though these behaviours could define a high potential lead they are no guarantee for the high potential lead to become an admitted bachelor student.
A high potential lead for a master study could be classified by the following
behaviours. The lead would take the E-check and get a positive result. The source would be organic, and the lead would request a brochure and ask a question via a webform. Again, an application for the open days would round up the behavioural profile of a high potential lead. Many of these behaviours can also be found in prospective students who are no high potential leads, this makes the identification of high potential leads difficult.
This study shows that high potential leads are difficult to identify and characterize. As it is only possible to speculate based on the comparison of admitted students and prospective student which behaviours are key to characterizing a high potential lead. Regarding the research priority of capturing information to fuel growth this study shows that it is difficult to recognize a certain type of user online. As high potential leads can be defined by various behavioural patterns it is difficult to identify a high potential lead and target it with fitting advertisements. This study shows that the evaluation of the potential of leads through the analysis of browsing behaviours is difficult as high potential leads show many different behaviours.
5.4 Implications
This section provides assumptions from the study which are useful for the marketing department of the University of Twente and for researchers. The high percentage of
prospective students and admitted students who asked questions via a webform hints at the FAQ section not being optimal as many still have questions unanswered. Many prospective and admitted students come from organic sources, which shows that they searched for the University of Twente. An assumption for researches interested in classifying leads is that a classification requires more data and that temporal data might provide better insights.
5.5 Privacy Concerns
16
was enforced on the 24th of May 2018 and was passed by the EU in 2016. The General Data Protection Regulation (European Commission, 2018) states that the collection and processing of personal data requires a legitimate reason. For the University of Twente, the legitimate reason is that the storage and processing of the personal data of students is necessary to provide all services to the students (University of Twente, 2018). On their websites the
University of Twente asks visitors to consent with the storage and processing of their personal data, this is another legal reason for the University of Twente to use the personal data of website visitors and students.
6 Limitations and Further Research
Limitations of this study are that the ratio of prospective students to admitted students is very high and that this could have distorted the results. The data covers only two years and the findings might vary when looking at a longer period. There, are with a high probability factors besides the browsing behaviour which classify high potential leads, these were not included in the scope of this study. The findings might be completely different for a data sample from a different country, therefore the results of this study are not generalisable. As the data was provided by the university of Twente the results can not be implied for other universities as a study with their data could produce completely different results. Also for organizations from a different context the results may vary as the higher education sector is different from a retail environment or business to business setting.
17
7 References
Ali, M., Alnahdi, S., & Alkayid, K. (2014, June). The effectiveness of online advertising via the behavioural targeting mechanism. The Business & Management Review, 5(1), 23-31.
Alreck, P. L., & Settle, R. B. (2007). Consumer reactions to online behavioural tracking and targeting. Database Marketing & Customer Strategy Management,15(1), 11-23.
Biwott, H. C. (2017). THE ROLE OF INTERNET MARKETING STRATEGIES IN LEAD GENERATION TO SMALL ENTERPRISES IN NAIROBI CENTRAL BUSINESS.
Bozdag, E. (2013). Bias in algorithmic filtering and personalization. Ethics Inf Technol, 15,
209-227. doi:DOI 10.1007/s10676-013-9321-6
Caracossa, J. M., Mikians, J., Cuevas, R., Erramilli, V., & Laoutaris, N. (2015, May 1). I
Always Feel Like Somebody’s Watching Me Measuring Online Behavioural Advertising.
doi:10.1145/2716281.2836098
Carroll, B. J. (2006). Lead Generation for the Complex Sale. doi:10.1036/0071458972
Cho, Y. B., Cho, Y. H., & Kim, S. H. (2005). Mining changes in customer buying behaviour for collaborative recommendations. Expert Systems with Applications, 28, 359-369. doi:10.1016/j.eswa.2004.10.015
Datta, S., & Satten, G. (2005). Rank-Sum Tests for Clustered Data. In the Public Domain Journal of the American Statistical Association, 100(471), 908-915. doi:DOI 10.1198/016214504000001583
De Amorim, R. C., & Hennig, C. (2006). Recovering the number of clusters in data sets with noise features using feature rescaling factors.
Devyatkova, K. (2017). Optimization of Digital Lead Generation Channels.
EMarketer. (2018, May 07). EMarketer Releases New Global Media Ad Spending Estimates - eMarketer Trends, Forecasts & Statistics. Retrieved October 15, 2018, from
https://www.emarketer.com/content/emarketer-total-media-ad-spending-worldwide-will-rise-7-4-in-2018
European Union, European Commision. (2018, May). General Data Protection Regulation. Retrieved July 28, 2018, from https://ec.europa.eu/commission/priorities/justice-and-fundamental-rights/data-protection/2018-reform-eu-data-protection-rules_en
Feddaoui, I., Felhi, F., & Akaichi, J. (2018, January 24). Multidimensional user profile construction for Web services selection: Social networks case study. Springer Nature. doi: 10.1007/s13278-018-0485-2
Fayyad, U., Piatetsky-Shapiro, G., & Smyth, P. (1996, November). The KDD Process for Extracting Useful Knowledge from Volumes of Data. COMMUNICATIONS OF THE ACM,
39(11), 27-34.
18
Gibson, D., Kleinberg, J., & Raghavan, P. (2000). Clustering Categorical Data: An Approach Based on Dynamical Systems. The VLDB Journal,8(3), 222-236. doi:10.1007/s007780050005
Hair, J. F., Black, W. C., Babin, B. J., & Anderson, R. E. (2014). Multivariate data analysis. Harlow: Pearson Education Limited.
Heller, K. A., & Ghahramani, Z. (2005). Bayesian Hierarchical Clustering. ICML '05 Proceedings of the 22nd International Conference on Machine Learning, 297-304. doi:10.1145/1102351.1102389
IAB. (2018). IAB internet advertising revenue report 2017 full year results (Rep.). IAB.
IBM Knowledge Center. (n.d.). Retrieved from
https://www.ibm.com/support/knowledgecenter/en/SS3RA7_15.0.0/com.ibm.spss.modeler.he lp/clusternode_general.htm
Jain, A. K. (1999). Data clustering: a review. ACM computing surveys (CSUR),31(3), 263-323. Jain, A.K. Data clustering: 50 years beyond K-means. Pattern Recognition Lett. (2009), doi:10.1016/j.patrec.2009.09.011
Jaworska, J., & Sydow, M. (2008). Behavioural Targeting in On-Line Advertising: An Empirical Study. Bailey J., Maier D., Schewe KD., Thalheim B., Wang X.S. (eds) Web Information Systems Engineering - WISE 2008. WISE 2008, 62-76. doi:10.1007/978-3-540-85481-4_7
Johnson, S. C. (1967). HIERARCHICAL CLUSTERING SCHEMES. Psychometrica,32(3).
Kodinariya, T. M., & Makwana, P. R. (2013, November). Review on determining number of Cluster in K-Means Clustering. International Journal of Advance Research in Computer Science and Management Studies, 1(6), 90-95.
Lu Xianghua, Xia Zhao, and Ling Xue. 2016. Is combining contextual and behavioral targeting strategies effective in online advertising? ACM Trans. Manag. Inform. Syst. 7, 1, Article 1 (February 2016), 20 pages. DOI: 10.1145/2883816
Mathews-Hunt, K. (2015). CookieConsumer: Tracking online behavioural advertising in Australia. Elsevier, 56-90. http://dx.doi.org/10.1016/j.clsr.2015.12.006
Marketing Science Institute. (2018). MSI Research Priorities 2018-2020.
Marvin, G. (2014, March 24). First Touch: In 9 Of 10 Industries Search Tops Lead Generation, Social Shortens Marketing Cycles. Retrieved October 5, 2018, from
https://marketingland.com/first-touch-attribution-search-tops-lead-generation-social-shortens-cycles-77622
Niemi, A. (2017). Digital Lead Generation and Nurturing: A Holistic Approach.
19
Parsons, R. (2014, October 17). 'Privacy concerns harming online advertising'. Retrieved September 11, 2018, from https://www.marketingweek.com/2014/01/28/privacy-concerns-harming-online-advertising/
Pierson, J., & Heyman, R. (2011). Social media and cookies: Challenges for online privacy.
Emerald Group Publishing Limited, 13(6), 30-42.
http://dx.doi.org/10.1108/14636691111174243
Pucinelli, N. M., Goodstein, R. C., Grewal, D., Price, R., Raghubir, P., & Stewart, D. (2009, January). Customer Experience Management in Retailing: Understanding the Buying Process.
Journal of Retailing, 85, 15-30. doi:10.1016/j.jretai.2008.11.003
Punj, G., & Stewart, D. W. (1983). Cluster Analysis in Marketing Research: Review and Suggestions for Application. Journal of Marketing Research, 134-148.
Ryan, D., Jones, C. (2012) Understanding Digital Marketing (2nd edition), Kogan Page, London
Rousseeuw, P. J. (1987). Silhouettes: A graphical aid to the interpretation and validation of cluster analysis. Journal of Computational and Applied Mathematics, 20, 53-65.
Strehl, A., & Ghosh, J. (2002). Cluster Ensembles–AKnowledge Reuse Framework for Combining Partitionings. Journal of Machine Learning Research, 583-617.
Srivastava, J., Cooley, R., Deshpande, M., & Tan, P. (1999). Web Usage Mining: Discovery and Applications of Usage Patterns from Web Data. SIGKDD, 1(2), 12-23. doi:10.1145/846183.846188
Thomas. (2015). The history of online shopping. Retrieved August 22, 2018, from https://purple.ai/blogs/the-history-of-online-shopping/
Truong, Y., & McColl, R. (2010). Practitioners’ perceptions of advertising strategies for digital
media. INTERNATIONAl JOuRNAl Of AdVERTISING, 29(5), 709-725.
doi:10.2501/S0265048710201439
University of Twente. (2018, June 25). Privacy: Secure handling of personal data. Retrieved from https://www.utwente.nl/en/news/!/2018/6/204815/privacy-secure-handling-of-personal-data
University of Twente. (n.d.). Education | Facts & Figures. Retrieved from https://www.utwente.nl/en/facts-and-figures/education/
Wagstaff, K., Cardie, C., Rogers, S., & Schroedl, S. (2001). Constrained K-means Clustering with Background Knowledge. ICML,1, 577-584.
Wang, J., Zhang, W., & Yuan, S. (2017, July 15). Display Advertising with Real-Time Bidding (RTB) and Behavioural Targeting.
20
Yao, Z., Eklund, T., & Back, B. (2010). Using SOM-Ward Clustering and Predictive Analytics for Conducting Customer Segmentation. 2010 IEEE International Conference on Data Mining Workshops. doi:10.1109/icdmw.2010.121
[image:23.595.70.411.215.367.2]8 Appendix
Table 5 Silhouette Coefficient Values
Number of Clusters Bachelor Silhouette Coefficient
Master Silhouette Coefficient
2 0.5 0.4
3 0.4 0.3
4 0.5 0.5
5 0.5 0.5
6 0.9 0.6
7 0.9 0.8
8 0.9 0.8
10 0.9 0.8
14 0.9 0.9
Table 6 Percentages for Bachelor Students
Factor Percentage of Admitted Students
Brochure Request 41%
PDF Download 02%
FAQ 00%
Application Open Days 03%
Question via Webform 54%
Managed CTA Display 08%
Managed CTA Click 01%
Source Direct 02%
Source E-mail 03%
Source Print 00%
Source Organic 17%
[image:23.595.76.523.417.589.2]21
Table 7 Percentages for Master Students
Factor Percentage of Admitted Students
Brochure Request 22%
E-Check 74%
E-Check Eligible 42%
PDF Download 03%
FAQ 00%
Application Open Days 06%
Question via Webform 31%
Managed CTA Display 03%
Managed CTA Click 00%
Source Direct 03%
Source E-mail 00%
Source Print 00%
Source Organic 09%
Source Referral 00%
Table 8 Percentages for Prospective Students
Factor Percentage of Prospective Students
Brochure Request 28.9%
E-Check 64.8%
E-Check Eligible 20.9%
PDF Download 0.1%
FAQ 0.1%
Application Open Days 0.7%
Question via Webform 14.7%
Managed CTA Display 3.3%
Managed CTA Click 0.8%
Source Direct 1.2%
Source E-mail 0.4%
Source Print 0.7%
Source Organic 8.5%
[image:24.595.72.525.354.574.2]22
Summary of the Thesis:
Name Master Student: Rouven Schoppmann
Title Thesis: Data Mining in an Educational Setting: A Cluster Analysis of Browsing Behaviour
Objective(s) or research Questions
1 What are the differences between admitted students and prospective students from Germany in their browsing behavior?
2 Which browsing behaviours are found for admitted bachelor students?
3 Which browsing behaviours are found for admitted master students?
4 Which browsing behaviours are found for prospective students?
5 Which behavioural browsing patterns characterize a high potential lead?
Focus on students from: Germany
For Education: Bachelor and Master students Main findings
1 Similar Patterns were found for bachelor and master students. 6 clusters for bachelor students and 7 for master students, each contains a behavioural pattern. Bachelor students request brochures and ask questions via a webform more often than Master students. Prospective students request brochure more often than master students but use the E-check less frequently. The result of the E-check shows that 42% of master students are eligible while only 21% of prospective students are eligible. The most frequently recorded source are
organic sources, 17% of bachelor students have a record for this source the percentages for master students and prospective students are 9% and 8.5%.
2 54% of bachelor students asked questions via a webform, 41% requested a brochure, 3% applied for open days, 17% came from organic sources.
23
4 14.7% of prospective students asked questions via a webform, 28.9% requested a brochure, 64% took the E-check, 20.9% had a positive result for the E-check, 0.7% applied for open days, 8.5 came from organic sources.
5 High potential leads are difficult to characterize. The cluster analysis shows that there are several patterns that could be attributed to high potential leads. It can only be speculated that a high potential lead for a master study requested a brochure, asked questions via a webform and got a positive result for the E-check. The same goes for a high potential lead for a bachelor study except that they cannot use the E-check. The leads would come from organic sources.
Main managerial take-aways
For this case the classification of high potential leads is hardly possible based only on the browsing behaviour. This makes it difficult to target advertisements. Many prospective students and admitted students asked questions via a webform, however only a small
percentage visited the FAQ. As many admitted students and prospective students come from organic sources it indicates that they were aware of the UT before accessing the website.
Main learning effects of the thesis for me
The main learning effects for me were that I learned a lot about digital marketing, specifically about behavioural profiles, customer segmentation and lead generation. Also learning about the different clustering methods was interesting.
Problems or negative aspects of the thesis for me
In hindsight a problem is that I did not learn how to use R but used SPSS modeler.