ISSN Online: 2151-1969 ISSN Print: 2151-1950
DOI: 10.4236/jgis.2018.105030 Oct. 25, 2018 562 Journal of Geographic Information System
A Remote Sensing Analysis of the Temporal and
Spatial Changes of Land Surface Temperature
in Calabar Metropolis, Nigeria
M. E. Awuh
1*, M. C. Officha
2, A. O. Okolie
3, I. C. Enete
11Department of Geography & Meteorology, NAU, Awka, Nigeria 2Department of Architecture, NAU, Awka, Nigeria
3Department of Architecture, Chukwuemeka Odumegwu Ojukwu University, Uli, Nigeria
Abstract
This study investigated the temporal and spatial changes of land surface tem-perature (LST) over Calabar Metropolis, Nigeria (2002 to 2016). The LST over Calabar metropolis was studied from the analysis of Landsat imageries of the investigated years (2002, 2006, 2008, 2010, 2012, 2014 and 2016). The re-sults of the LST imagery were classified using standard deviation. GIS was further applied to extract the coverage ratio of each land use in the context of Land surface temperature (LST) pixels and results were presented in degree Celsius. The result of this study revealed a great variation in the mean LST for the selected period. The highest mean LST of 25.38˚C was observed in 2016, followed by 2002 with mean LST of 25.32˚C whereas, the least LST was ob-served in 2010. This study has shown that, the changing land use pattern of the area is capable of affecting certain characteristics of the environment such as surface temperature. The study recommends that effort should be made by the government to increase urban vegetation in order to reduce potential fu-ture increased in LST.
Keywords
Landsat Imageries, Calabar, Land Surface Temperature, Spatial Changes
1. Introduction
Land surface temperature (LST) which is controlled by the surface energy bal-ance, atmospheric state and thermal properties of the surface/subsurface rocks is one of the important parameters in several environmental models [1]. As sug-gested by [2], LST provides an accurate measure for indicating energy exchange
How to cite this paper: Awuh, M.E., Of-ficha, M.C., Okolie, A.O. and Enete, I.C. (2018) A Remote Sensing Analysis of the Temporal and Spatial Changes of Land Sur-face Temperature in Calabar Metropolis, Nigeria. Journal of Geographic Information System, 10, 562-572.
https://doi.org/10.4236/jgis.2018.105030
Received: August 23, 2018 Accepted: October 22, 2018 Published: October 25, 2018
Copyright © 2018 by authors and Scientific Research Publishing Inc. This work is licensed under the Creative Commons Attribution International License (CC BY 4.0).
DOI: 10.4236/jgis.2018.105030 563 Journal of Geographic Information System
balance between the Earth and the atmosphere. Studies on LST are important to environmental studies and management of the Earth’s resources due to its ability to determine the effective radiating temperature of the Earth’s surface. Also, LST is a major factor of determining the partition of the available energy into sensi-ble and latent heat flux. For example, the rate of change of LST is sensitive to the characteristics of the land surface such as soil moisture, land use and vegetation [3].
With the advent of thermal remote sensing technology, observation of LST has become possible using Satellite and Aircraft platforms [4], which has pro-vided the new direction for the observations of thermal reflectance and the study of their effects through the combination of thermal remote sensing and urban micrometeorology [5]. Various satellites, and methods such as Landsat TM Bands are available that can be used to examine the LST [6] [7] [8] [9]. Landsat TM Bands are the data which is most widely used for these studies [6] [7] [8] [9]. Previous studies have demonstrated that the LST product retrieved from thermal infrared (TIR) sensors can be used to monitor the distribution of temperature over an area [5] [10] [11] [12] [13] [14]. Several researchers have estimated air temperatures using Landsat TM Imageries [7] [15]-[20]. This paper assesses the temporal and spatial changes of LST over Calabar Metropolis, Nigeria.
2. Materials and Method
2.1. Study Area
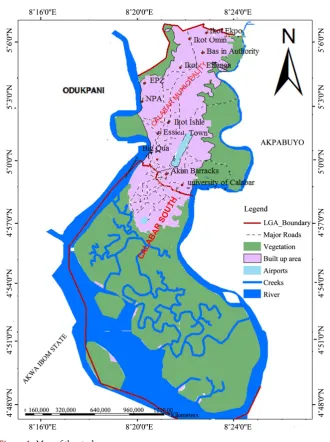
Calabar Metropolis, the study area, is the capital of Cross River State, Nigeria, located at the Southern part of the State. It encompasses of Calabar Municipality and Calabar South Local Government Areas and lies between latitudes 4˚50'N and 5˚10'N and longitudes 8˚17'E and 8˚20'E; bounded to the north by Odukpa-ni Local Government Area (LGA) and to the East by Akpabuyo LGA. Calabar Metropolis is sandwiched between the Great Kwa River to the East and the Ca-labar River to the West. The present of urban area is on the eastern bank of the Calabar River, its growth of the southern part is hindered by the mangrove swamps. It covers an estimated land area of about 274.593 km2 (Figure 1).
Calabar falls within tropical equatorial (Af) climate of high temperature, high relative humidity and abundant annual rainfall [21]. The annual rainfall is 2750 mm and the mean annual average temperature is 26.1˚C. The study area has witnessed a tremendous increase in the population of 10,000 estimated at the pre-colonial, to 99,352 in 1993; 328,876, in 1991. The last census in 2006 put the population to 371,022 [22]. The population growth of Calabar has been followed by the expansion of its physical boundaries. This increase in the physical boun-daries implies a corresponding loss of vegetation and land in the area thereby a direct impact on the micro-climate [22].
2.2. Image and Pre-Processing
DOI: 10.4236/jgis.2018.105030 564 Journal of Geographic Information System Figure 1. Map of the study area.
comprised of the Thematic Mapper (TM), Enhance Thematic Mapper plus (ETM+) image and the operational land Imager (OLI) to determine LST within
Calabar Metropolis between “2002 and 2016”. The imageries downloaded cov-ered a period of 15 years at an interval of 2 years. The software employed for desktop analysis was ArcGIS. Identifying the study area was the first step of this research which was achieved with the use of an administrative map of Calabar, showing Calabar Municipality and Calabar South LGA.
2.3. Retrieving of Land Surface Temperature
DOI: 10.4236/jgis.2018.105030 565 Journal of Geographic Information System
Conversion of Digital Numbers (DN) of the bands to Spectral Radiance
(
)
MAX MIN MIN 1 Calma CALMIN L LL DN L
Q x Q
λ
−
= × − +
−
(1)
where,
LMAX = the spectral radiance that is scaled to QCALMAX in W/(m2 * sr * μm) LMIN
= the spectral radiance that is scaled to QCALMIN in W/(m2 * sr * μm) QCALMAX =
the maximum quantized calibrated pixel value (corresponding to LMAX) in DN =
255 QCALMIN = the minimum quantized calibrated pixel value (corresponding to
LMIN) in DN = 1.
Conversion from Spectral Radiance to At-Satellite Brightness Tempera-ture [23]
2 1 273.15 1 K T K In Lλ = − + (2)
where, T = At-satellite brightness temperature, Ll = Spectral radiance (gotten from equations - and -), K1 = Band specific thermal conversion constant from the metadata, x is the thermal band number), K2 = Band specific thermal con-version constant from the metadata, −273.15 = Constant for concon-version from Kelvin to Degrees Celsius as shown in [23].
Correcting for Land Surface Emissivity (LSE) [23]
The temperature values obtained using Equation (2) are reference to a black-body. Therefore, corrections for spectral emissivity (ε) became necessary ac-cording to the nature of land cover (Equation (3))
0.004 V 0.986
e= P + (3)
where, e = Land Surface Emissivity, 0.004 & 0.986 = Constants for emissivity es-timation, PV = Proportion of vegetation [23] given by the equation
min
max min
V NDVI NDVI
P
NDVI NDVI
−
−
(4)
where, NDVI = Normalized Differential Vegetation Index as computed with Equation (1) for each of the years, NDVImin = Minimum value of NDVI for that year, NDVImax = Maximum value of NDVI for that year [23].
Estimation of the Land Surface Temperature [23]
( )
1 T TB B
LST In
W P
= × × ∑
+ (5)
where, LST= Land Surface Temperature, BT = At-satellite brightness tempera-ture, W = Wavelength of emitted radiance (µm) [23] given as:
(
1.438 102)
14380c
P h mK
s
−
= × × = (6)
DOI: 10.4236/jgis.2018.105030 566 Journal of Geographic Information System
3 Result Presentation and Discussion
Land Surface Temperature (LST) Analysis
Based on the LST retrieval algorithm mentioned earlier, seven LST maps at an interval of two years (2002 to 2016) were generated to measure the magnitude and to quantify LST spatially explicit over the whole study area. In order to play the LST map clearly, the density slice function of ArcGIS was used to dis-tinguish the LST zones by different colors. The LST over Calabar metropolis was studied from the analysis of Landsat images of the investigated years (2002, 2006, 2008, 2010, 2012, 2014 and 2016). The results of the LST imagery were classified using standard deviation. LST for the different years was also extracted and presented in degree Celsius (Figure 2 and Table 1).
The result of the LST maps revealed a great variation in the surface radiant temperature for the selected periods (Figure 2 and Table 1). Comparing radiant temperature for the selected periods we observed that, in 2002, the radiant tem-perature is confined within the range of 14.19˚C to 31.4˚C with mean of 25.32 ˚C; while the radiant temperature of 2006 falls within the range of 18.77˚C to 30.52˚C with a mean of 23.76˚C. Also, in 2008, the radiant temperature falls within the range of 18.92˚C to 32.14˚C with a mean of 24.63˚C while the radiant temperature of 2010 falls within the range of 14.18˚C to 24.77˚C, with 18.72˚C as the mean. The result also revealed a great variation in the mean LST for 2008, 2006 and 2002. Comparing mean LST of 2008 with 2002 and 2006, we observed a slight negative difference of −0.69˚C and a positive difference of 1.26˚C in 2002 and 2006 respectively (Table 1).
DOI: 10.4236/jgis.2018.105030 567 Journal of Geographic Information System
(b)
DOI: 10.4236/jgis.2018.105030 568 Journal of Geographic Information System
(d)
DOI: 10.4236/jgis.2018.105030 569 Journal of Geographic Information System
(f)
[image:8.595.241.513.64.672.2](g)
Figure 2. LST distribution over Calabar Metropolis based on Landsat
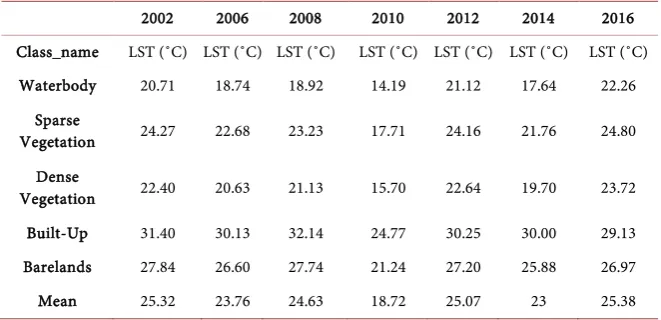
DOI: 10.4236/jgis.2018.105030 570 Journal of Geographic Information System Table 1. LST change status of Calabar Metropolis (2002-2016).
2002 2006 2008 2010 2012 2014 2016
Class_name LST (˚C) LST (˚C) LST (˚C) LST (˚C) LST (˚C) LST (˚C) LST (˚C) Waterbody 20.71 18.74 18.92 14.19 21.12 17.64 22.26
Sparse
Vegetation 24.27 22.68 23.23 17.71 24.16 21.76 24.80 Dense
Vegetation 22.40 20.63 21.13 15.70 22.64 19.70 23.72 Built-Up 31.40 30.13 32.14 24.77 30.25 30.00 29.13 Barelands 27.84 26.60 27.74 21.24 27.20 25.88 26.97 Mean 25.32 23.76 24.63 18.72 25.07 23 25.38
Furthermore, the result of the LST map of 2012 reveals the highest mean ra-diant temperature in 2012 to be 30.25˚C, followed by 21.12˚C with a mean of 25.07˚C, higher than that of 2010. In 2014, radiant temperature falls within the range of 17.64˚C to 30.00˚C with a mean of 23˚C (Table 1). The result of the 2014 LST map further revealed the mean LST of 2014 to be higher than the mean LST of 2010, but lower than the other years understudy. Comparing mean LST of 2014 and 2012, we observed that mean LST in 2012 was higher than 2014 (Table 1).
From the findings of this study, it is evident that, the highest mean radiant of 25.38˚C was observed in 2016, followed by 2002 with mean LST of 25.32˚C, while the least radiant temperature was observed in 2010 (Table 1). The low mean value of the radiant temperature in 2010 compared to the other years can be attributed to the adverse weather condition such as dust haze and fog re-ported by [24], during the months of January to March, November to December 2010, dry north easterly winds prevailed over parts of West Africa as a result of surface pressure built up over the Sahara deserts and Sahel region which trans-ported air borne dust particles southward, thus, reducing the horizontal visibility to less than 1000 m.
The findings of this study also demonstrated that, out of the five land use classes identified in the study area (water body, sparse vegetation, dense vegeta-tion, built up area and bare land) [25], built-up and bare land LULC classes ex-hibited the highest mean LST values. The mean LST value of 32.14˚C was ob-served around the bareland class while the lowest radiant temperature of 14.19˚C was observed around the water body classes (Table 1).
4. Conclusion
DOI: 10.4236/jgis.2018.105030 571 Journal of Geographic Information System
by water bodies, followed by areas over woodland. The removal of the vegetal cover exposes the land surface to insolation expressed in reflectance that signi-fies the heating or cool surface systems. The sequence indicates that abundant water is helpful in buffering urban heat islands (UHIS). Vegetation covers should be protected to reduce potential future UHIS around the urban fringe transits through a peri-urban heating system.
Conflicts of Interest
The authors declare no conflicts of interest regarding the publication of this paper.
References
[1] Becker, F. and Li, Z. (1990) Towards a Local Split Window Method over Land Sur-face. International Journal of Remote Sensing, 3, 17-33.
[2] Liu, L. and Zhang, Y. (2011) Urban Heat Island Analysis Using the Landsat TM Data and ASTER Data. A Case Study in Hong Kong. Remote Sensing, 3, 1535-1552. https://doi.org/10.3390/rs3071535
[3] Fabrizi, R., Bonafoni, S. and Biondi, R. (2010) Satellite and Ground-Based Sensors for the Urban Heat Island Analysis in the City of Rome. Remote Sensing, 2, 1400-1414. https://doi.org/10.3390/rs2051400
[4] Ema, K., Nengah, I.S. and Widiatmaka, J. (2016) Satellite-Based Land Surface Tem-perature Estimation of Bogor Municipality, Indonesia. Indonesian Journal of Elec-trical Engineering and Computer Science, 2, 221-228.
https://doi.org/10.11591/ijeecs.v2.i1.pp221-228
[5] Vought, J.A. and Oke, T.R. (2003) Thermal Remote Sensing of Urban Areas. Re-mote Sensing of Environmental, 86, 370-3884.
https://doi.org/10.1016/S0034-4257(03)00079-8
[6] Sekertekin, A., Kutoglu, S.H. and Kaya, S. (2016) Evaluation of Spatiotemporal Va-riability in Land Surface Temperature: A Case Study of Zonguldak, Turkey. Envi-ronmental Monitoring and Assessment, 188, 1-15.
https://doi.org/10.1007/s10661-015-5032-2
[7] Wang, F., Qin, Z.H., Song, C.Y., Tu, L.L., Karnieli, A. and Zhao, S.H. (2015) An Improved Mono-Window Algorithm for Land Surface Temperature Retrieval from Landsat 8 Thermal Infrared Sensor Data. Remote Sensing, 7, 4268-4289.
https://doi.org/10.3390/rs70404268
[8] Jimenez-Munoz, J.C., Sobrino, J.A., Skokovic, D., Mattar, C. and Cristobal, J. (2014) Land Surface Temperature Retrieval Methods from Landsat-8 Thermal Infrared Sensor Data. IEEE Geoscience and Remote Sensing Letters, 11, 1840-1843.
https://doi.org/10.1109/LGRS.2014.2312032
[9] Yu, X.L., Guo, X.L. and Wu, Z.C. (2014) Land Surface Temperature Retrieval from Landsat 8 TIRS-Comparison between Radiative Transfers Equation Based Method, Split Window Algorithm and Single Channel Method. Remote Sensing, 6, 9829-9852. https://doi.org/10.3390/rs6109829
[10] Lin, S.P., Moore, N.J., Messina, J.P., DeVisser, M.H. and Wu, J.P. (2016) Evaluation of Estimating Daily Maximum and Minimum Air Temperature with MODIS Data in East Africa. International Journal of Applied Earth Observation and Geoinfor-mation, 18, 128-140. https://doi.org/10.1016/j.jag.2012.01.004
DOI: 10.4236/jgis.2018.105030 572 Journal of Geographic Information System of Land-Use/Landover Change on the Change of Urban Heat Island Intensity.
Theoretical and Applied Climatology, 90, 217-226. https://doi.org/10.1007/s00704-006-0273-1
[12] Adinna, E.N., Enete, I.C. and Okolie, A.T. (2009) Assessment of UHI and Possible Adaptations in Enugu Urban Using Landsat-ETM. Journal of Geography and Re-gional Planning, 2, 030-036.
[13] Imhoff, M.L., Zhang, P., Woife, R.E. and Bounoua, L. (2010) Remote Sensing of Urban Heat Island Effect across Biomas in the Continental USA. Remote Sensing of Environment, 114, 504-513. https://doi.org/10.1016/j.rse.2009.10.008
[14] Weng, Q. (2008) Thermal Infrared Remote Sensing for Urban Climate and Envi-ronmental Studies: Methods, Applications, and Trends. ISPRS Journal of Photo-grammetry and Remote Sensing, 64, 335-344.
https://doi.org/10.1016/j.isprsjprs.2009.03.007
[15] Awuh, M.E. (2017) Assessment of the Impact of Land-Use/Land Cover Pattern on Urban Heat Island in Calabar Metropolis. Unpublished Ph.D. Thesis, Nnamdi Azi-kiwe University.
[16] Enete, I.C., Awuh, M.E. and Ikekpeazu, F.O. (2014) Assessment of Urban Heat Isl-and (UHI) Situation in Douala Metropolis Cameroon. Journal of Geography and Earth Sciences, 2, 35-40.
[17] Abutaleb, K., Ngie, A., Darwish, A., Ahmed, M., Arafat, S. and Ahmed, F. (2015) Assessment of Urban Heat Island Using Remotely Sensed Imagery over Greater Cairo, Egypt. Advances in Remote Sensing, 4, 35-47.
https://doi.org/10.4236/ars.2015.41004
[18] Allegrini, J., Dorer, V. and Carmeliet, J. (2015) Influence of Morphologies on the Microclimate in Urban Neighbourhoods. Journal of Wind Engineering and Indus-trial Aerodynamics, 144, 108-117. https://doi.org/10.1016/j.jweia.2015.03.024 [19] Keramitsoglou, I., Kiranoudis, C.T., et al. (2011) Identification & Analysis of Urban
Surface Temperature Patterns in Greater Athens, Greece, Using MODIS Imagery.
Remote Sensing of Environment, 115, 3080-3090. https://doi.org/10.1016/j.rse.2011.06.014
[20] Inyang, P.E.B. (1980) Calabar Environs: Geographical Studies. University of Cala-bar, Calabar.
[21] National Population Commission (NPC) Nigeria (2006) Population Census of the Federal Republic of Nigeria. Analytical Report at the National Level, Lagos. [22] Eni, D.D. and Ukpong, B.J. (2014) The Impact of Population Growth on Residential
Land Use in Calabar, cross River State. Research on Humanities and Social Sci-sences,4, 68-74.
[23] Zaharaddeen, I., Ibrahim, I.B. and Zachariah, A. (2016) Estimation of Land Surface Temperature of Kaduna Metropolis, Nigeria Using Landsat Images. Science World Journal,11, 36-42.
[24] Nigeria Meteorological Organization (NIMET) (2010) Climate Variability and Change: Impact, Science, Innovation and Policy. Climate Review Bulletin, 1-24. [25] Awuh, M.E., Officha, M.C., Okolie, A.O. and Enete, I.C. (2018) Land-Use/Land-Cover
Dynamics in Calabar Metropolis Using a Combined Approach of Remote Sensing and GIS. Journal of Geographic Information System, 10, 398-414.