doi:10.4236/jeas.2011.13006 Published Online September 2011 (http://www.SciRP.org/journal/jeas)
Removal of Phenol from Aqueous Solution by
Activated Mud
*
Zohra Dali-Youcef
1, Michèle Queneudec
2 1Laboratory of matérials LABMAT ,Ecole Nationale Supérieure de l’Enseignement Technique d’Oran (ENSET), BP El M’naouer Oran Algeria
2Laboratory of Innovantes Technologies, IUT département Génie Civil, avenue des Facultés, Amiens cedex 01
E-mail: zohra_dali2002@yahoo.fr
Received May 26, 2011; revised June 24, 2011; accepted July 14, 2011
Abstract
Activated mud has been employed to remove phenolic compounds, a common contaminant in wastewaters.
Because of high surface area per unit area, activated mud is the most effective adsorbent and exhibits high
capacity of adsorption of phenolic compounds. A complete study was undertaken on the adsorption of
phe-nol starting from an aqueous solution on activated mud with ammonium chloride. The removal is found to be
dependent on concentration of phenol and increasing of concentrations favour the uptake. The isotherms and
kinetics of adsorption of phenol on activated mud were studied at 20
˚C
. Equilibrium isotherm of phenol on
activated mud is obtained and the results shows that the Langmuir model provided the best fit for the
adsorp-tion data. From the experimental results obtained, the adsorpadsorp-tion process can be well described with the
pseudo-second order model.
Keywords: Activated Mud, Adsorption, Phenol, Equilibrium Isotherm, Contaminant
1. Introduction
Aromatic compounds like phenol are present in strong concentrations within wastewater generated by the pet-rochemical industry. This wastewater is often discharge- ed into the sea and represents a true danger to human health; it quickly becomes absorbed via all means of ex-posure. As an example, absorption was estimated at be-tween 70% and 80% within 6 hours for exposure to phe-nol vapour with concentrations ranging from 6 to 20 mg/m3, practically exclusively by means of skin expo-sure on healthy volunteers [1]. A number of effective and not very expensive processes have moreover already been developed in order to mitigate the presence of phe-nol in the environment [2-4].
The present work focuses on testing a new process based on the adsorption of an activated clayey material. A good number of uses for the adsorbing capacity of clay are already known; in the case of polluted water treat-ment for example, clay can be used to: adsorb organic toxic compounds [5-7], retain surfactant and dyes [8,9], pesticides and herbicides [10] present in the aqueous phase. Clay also gets used in the detergent and paper industries, in oil-well drilling, where it is called drilling
sludge after having undergone activation with sodium carbonate [11]. It often proves necessary however to in-crease capacity of clay by activation [12-15].
Sediments generated from the dredging of dams cause serious environmental problems. Given their abundance throughout the country, the opportunities offered by their reuse seem to be quite attractive. A simple acid active- tion of mud has enabled us to derive a material capable of adsorbing potential water pollutants such as phenols.
The material used in the present work contains dam sediments. In Algeria, silting constitutes the major con- cern of hydraulics engineers and weir facility managers because of its role in reducing dam capacity. For the Fergoug Dam located in Western Algeria, the silting rate reached 78.3% in 1997. Mud extracted from the dam has been targeted in this study. The sediments there have been submitted to an activation treatment by use of am-monium chloride.
ki-netic modeling has been highlighted.
2. Materials and Methods
2.1. Materials
The dam sediment used in this work is recovered mud from the breach of the Fergoug Dam (located in Western Algeria). The unpurified mud and activated mud with ammonium chloride underwent a physicochemical char- acterisation.
The chemical composition is given by the fluorescence method using an apparatus of the type FRX P.W1404. RAY. Specific surface has been calculated using the B. E. T. method with an apparatus of the type Micromeri- tics GEMINI 2375.
X-ray diffraction analysis was carried out with a stan- dard Philips PW 3710 x-ray generator with a copper anti- cathode.
Infrared spectra were obtained on a FT / IR 430 Fourr- ier transform Infrared spectrometer Jasco. Powder sam-ples were dispersed in anhydrous methylene chloride and drops of the liquid were spread on KBr plates.
Structure of materials is obtained with electron micro- scope with sweeping, Philips XL 30.
2.2. Solutions Preparatio
nThe solvent used was demineralised water with a pH of 7 and a conductivity of 0.5 µS. Phenol adsorption isoth- erms from aqueous solutions were obtained using the batch equilibration technique: 0.4 g of adsorbent was mixed with 100 ml of the aqueous solutions of various initial concentration (C0) ranges from 2 to 400 mg/L. A mechanical agitator at 500 rpm was used. Suspensions shaken for 2 h, were placed in polypropylene tubes, im- mersed in a thermostatic shaker bath at constant tem-perature 20˚C and then centrifuged. Supernatants col-lected in dark brown colored bottles were analyzed by a spectrophotometer (Perkin, lamda 25) at the wavelength of maximum absorbance (l max = 269.70 nm), then the concentration at stability (Ce) was obtained.
2.3. Preparation of Activated Mud with 2 M
Ammonium Chloride
About 100g of raw mud was mixed to 1L of ammonium chloride (2M), solution was agitated during 24 hours at 50˚C. The solution obtained was then introduced into sedimentation test-tube. After 15 minutes of decantation (in order to eliminate large particles like quartz), 2/3 of the remaining volume were recovered and decanted again. The mud was then recovered and washed several
times with demineralised water until all chlorides had disappeared. After decantation, the activated mud was dried at ambient temperature and placed in the drying oven between 80˚ and 100˚C in order to undergo the various adsorptions.
2.4. Adsorption Isotherms
The physico-phenomenon of adsorption of phenol on acidified mud, is relatively rapid and can be reversible. Several isotherms models were used to describe the equi- librium between adsorbed phenol on acidified mud and phenol in solution (Ce) at constant temperature. The Langmuir isotherm equation is given below:
0 e
q =Q bCe1 1 bCe+ (1)
where qeis the adsorbed amount (mg/g) at equilibrium, Ce is equilibrium concentration in the solution (mg/L), Q0 is the adsorption capacity (mg/g) and b is a constant related to the energy of adsorption (L/mg).
Death equation is linearised under form [16]
0 0
Ce qe=1 Q b Ce Q+ (2)
The well-known Freundlich isotherm used for isother- mal adsorption is a special case for heterogeneous sur-face energy in which the energy term in the Langmuir equation varies as a function of surface coverage strictly due to variation of the sorption.
The linear form of Freundlinch isotherm model is given by the following equation:
( )
e F
ln q =lnk + 1 n lnCe (3)
where kF (mg/g) (1/mg) 1/ n
and 1/n are Freundlich con-stants related to adsorption capacity and adsorption in-tensity, respectively, of the sorbent.
2.5. Adsorption Kinetics
The two kinetic models have been studied to deter- mine the phenol elimination mechanism on activated slu- dge. The first model is of the first order, kinetic and conven-tionally expressed by Lagregen's equation [16]:
(
)
(
)
1ln qe qt / qe− = −k t (4)
qe: amount of sorbed phenol at equilibrium (mg/g) qt: amount of sorbed phenol at time t (metal uptake) (mg/g)
k1: rate constant (min-1)
The amount of sorbed phenol per gram of adsorbent qt at time t was caculated as follows:
(
0 e)
adsqt= C −C m
37
Ce: concentration of phenol in the fluid at time t in mg/L
mads: adsorbent amount in the solution (g/L)
The second model is of the second order and ex-pressed by the following equation [17]:
(
)
2dqt dt=K qe− qt (5)
where K is the rate constant of sorption (g/mg.mn).
3. Results and Discussion
3.1. Characterization
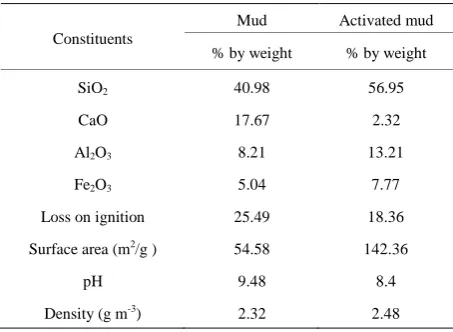
The chemical characterization of mud show (Table 1) that silica and calcium oxide are its major constituents. The percentage of the iron oxide is important.
Chemical analysis of mud activated with ammonium chloride indicatesa rise in the silica rate as well as the alumina rate which is justified by the literature [18,19]. Specific surface of mud activated increases [20,21].
X-ray powder diffraction patterns of raw mud and ac-tivated mud are shown in (Figure 1). These XRD con-firmed that mud and activated mud was illite [22].
X-ray diffraction pattern for raw mud show : diffract- tion peak with basal spacing d = 4.23 Å, characteristic of the beidellite; diffraction peak to 3.02 Å ,characteris- tic of saponite; the diffraction peak at 3.33 Å is assigned to the impurtés as quartz; diffraction peak to 2.12 Å char-acteristic of illite and diffraction peak to 1.90 Å to kao-lin.
[image:3.595.305.538.78.322.2]Activation of mud causes some change in crystal structure: diffraction peak of quartz at 3.33 Å decreased intensity in comparison to the spectra of diffraction of X-ray of the raw mud; diffraction peak of intensity 100% situated in 2.73 Å represents the family of the illite, it is essentially about the hectorite or saponite, this last is also put in evidence by the reflection in 1.73 Å .
Table 1. Characterization of mud and activated mud.
Constituents
Mud Activated mud
% by weight % by weight
SiO2 40.98 56.95
CaO 17.67 2.32
Al2O3 8.21 13.21
Fe2O3 5.04 7.77
Loss on ignition 25.49 18.36
Surface area (m2/g ) 54.58 142.36
pH 9.48 8.4
Density (g m-3) 2.32 2.48
Activated mud
[image:3.595.58.285.558.724.2]Mud
Figure 1. X-ray diffraction pattern for raw mud and acti-vated mud.
The Infrared spectrum (Figure 2) obtained for active- ted mud does not differ significantly from its “mother”: raw mud. IR analysis of activated mud confirmed the ex- istence of NH4
+
ion in mud. The band in the range 1400 - 1420 cm-1 was attributed to the deformation of NH4
+ ion, thus further confirming the presence of ammonium in mud [23].
The large band at 1031 cm-1 observed in the spectra of mud, attributed to the vibration of Si-O-Si, decreased intensity in the spectra of the activated mud; it can be du to the formation of the amorphous silica.
The bands around 533 and 469 cm-1, attributed respec-tively to deformation of four-membered siloxane ring and deformation of Si-O-Al [24,25], increased in the spectra of the acted mud.
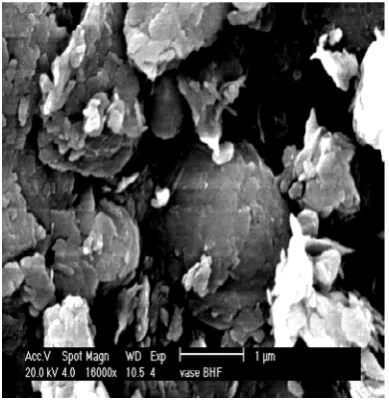
The image obtained using the electron microscope with sweeping, Image 1, shows the structure in layers of the rough vase. The image obtained using the electron microscope with sweeping, Image 2, shows the structure of the activated mud.
3.2. Effect of the Acidified Mud Mass
1435 1033 469
1438 1031 469
[image:4.595.75.270.447.648.2]533
Figure 2. Infrared spectra for mud and activated mud.
Image 1. Electron microscope with sweeping of rough mud
.
Image 2. Electron microscope with sweeping of activated mud.in the rate of phenol elimination vs. masses of untreated mud and acidified mud is given in Figure 3. The maxi- mum elimination rate value 75.05% has been derived for
a mass of activated mud equal to 0.4 g. Beyond this mass, the curve reaches a stage indicating that the quantity of fixed phenol no longer varies. The untreated mud exhib-
39
its a lower rate of phenol elimination, approx. 21.42%. These experimental results thus justify mud activation [12-26].
3.3. Effect of Stirring Velocity
In order to study the influence of stirring velocity on phenol fixation Figure 4, samples were prepared by mixing 0.4 g of acidified mud with 100 ml of phenol solution (4 mg/L) agitated for 120 min at various speeds at 20˚C. An increase in the phenol elimination rate is indeed noticeable. Faster agitation incites the diffusion of
phenol molecules and their fixation onto the activated mud.
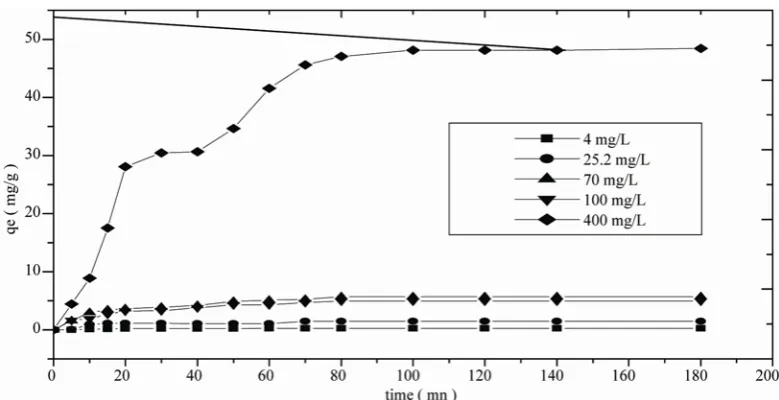
3.4. Effect on Initial Phenol Concentration
[image:5.595.106.491.240.444.2]The adsorption data for the uptake of phenol versus con-tact time at different initial concentrations is presented in Figure 5. The results show that equilibrium time re-quired for the adsorption of phenol on activated mud is almost 80 minutes. It is also seen that the remaining concentration of phenol becomes asymptotic to the time axis after 80 minutes of shaking. These results also indi-
Figure 3. Fixation of phenol according to the mass of the mud and activated mud at 20°C, [phenol]= 4 mg/L.
[image:5.595.101.498.475.702.2]Figure 5. Effect of initial concentrations to the remaining phenol at 20°C.
cate that the sorption process can be considered very fast because of the largest amount of phenol attached to the sorbent within the first 80 minutes of adsorption. The adsorbed amount at equilibrium qe, increases according to the initial concentration of the treated phenol solution. When the initial phenol concentration is 400 mg/L, the adsorbed amount at equilibrium is maximised and rea- ches 48.12 mg/g. Fixing the phenol thus becomes more heavily favoured as the initial concentration increases. The increase in concentration enhances mass transfer, thereby exerting a force on the surface of the adsorbent and leading to an increase in phenol adsorption speed on the activated mud. Since our experimental results clearly suggest Type I isotherms [27,28].
3.5. Adsorption Isotherm
During the batch experiments, adsorption isotherms were used to evaluate adsorption properties. 0.4g of adsorbent was mixed with 100 ml of the aqueous solutions of vari-ous initial concentration (C0) ranges from 2 to 200 mg/L at 20˚C. A mechanical agitator at 500 rpm was used. Suspensions shaken for 2 h.
The curves associated to the Langmuir model and Fre- undlich model are represented in Figure 6 and Figure 7.
By means of the correlation coefficients obtained from the trend curves, it can be observed that the most suitable model for the adsorption of phenol by acidified sludge would be Langmuir's (R2Langmuir >R2Freundlich)
Assuming the Langmuir isotherm model applies, the following rearrangement of Equation (2) allows the de-termination of Langmuir parameters:
0 2
[image:6.595.309.535.313.402.2]Q =28.98 mg g b=0.0066 L mg r =0.9811
Figure 6. Isotherm at 20°C for phenol on activated mud. Experimental are reported as points and Langmuir model by curve.
Figure 7. Isotherm at 20°C for phenol on activated mud. Experimental are reported as points and Freundlich model by curve.
Assuming the Freundlich isotherm model applies, the following rearrangement of Equation (3) allows the de-termination of Freundlich parameters:
Values of n and K were calculated from experimental data through linear regression:
2
[image:6.595.308.540.451.547.2]41
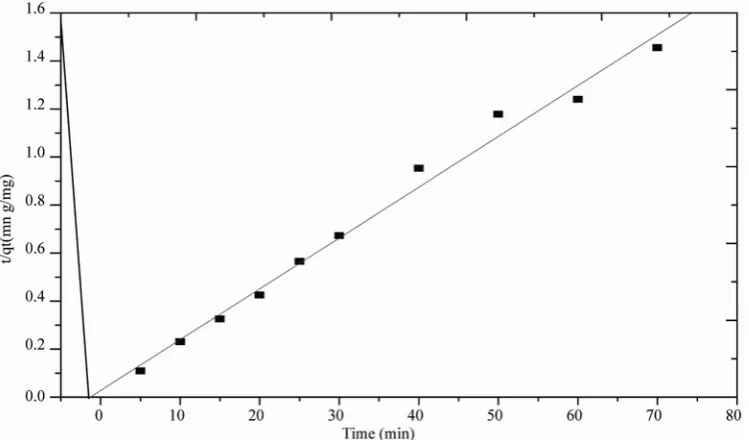
Figure 8. Pseudo-second order kinetics plot for adsorption of phenol on activated mud.
3.6. Adsorption Kinetic Modelling
The kinetics study has been applied to an initial phenol concentration equal to 400 mg/L and an activated sludge mass/volume ratio for the phenol solution of 3.75 mg/mL.
The pseudo second order kinetic equation was applied to the experimental data in order to investigate the sorp-tion mechanism of phenol. Figure 8 show the plots of the linearized form of the pseudo second order model for sorption of phenol at 20˚C .
By comparing the correlation coefficients obtained for both the first- and second-order kinetic equations, it can be noted that the most suitable kinetic model for phenol adsorption is the second-order one, with an adsorption capacity of activated mud at saturation equal to:
qe = 47.1698 mg/g. Correlation coefficient obtained for second-order kinetic: r2 = 0.9883. The rate constant of sorption K = 0.016 g/ mg.mn.
4. Conclusions
The adsorption of phenol in aqueous solution by an acti-vated mud by ammonium chloride was investigated. Activation shows an increase in specific surface.
The isotherms and kinetics of adsorption of phenol onto mud activated chemically by ammonium chloride are studied at 20˚C . The following results are obtained:
● The amount of sorbed phenol for an initial concen-tration of 400 mg/L is 48.12 mg/g.
● The adsorption isotherm onto activated mud is de-termined. The Langmuir model fits the experimental data
well.
● The adsorption of phenol on activated mud was best described by the pseudo second order rate model and sorption can not been described with first order model. The adsorption capacity of activated mud at saturation was found to be 47.1698 mg/g.
Consequently, mud activated chemically by ammo-nium chloride is successfully used as adsorbing agent and has a high adsorption capacity for phenol.
5. References
[1] ATSDR, “Toxicological Profiles for Phenol,” Agency for Toxic Substances and Disease Registry, Atlanta, 1989.
[2] M. S. Fountoulakis, S. N. Dokianakis and M. E. Kornaros, “Removal of Phenolics in Olive Wastewaters Using the White-Rot Fungus Pleurotus Ostreatus,” Water Research, Vol. 36, 2002, pp. 4735-4744.
[3] S. Yun-Hwei, “Phenol Sorption by Organoclays Having Different Charge Characteristics,” Colloids and Surfaces, Vol. 232, pp. 143-149.
[4] L. Gianfreda and F. Sannino, “Oxidative Transformation of Phenols in Aqueous Mixtures,” Water Research, Vol. 37,
2003, pp. 3205-321
[5] O. Ferrandon, G. Mas, and M. T. Moss, “Utilisation des Argiles en Dépollution des Eaux,” Tribune de l’eau, Vol. 51, 1998, pp. 25-34.
[6] S. Peker, S. Yapar and N. Besun, “Physicochemical and Engineering Aspects,” Colloids and Surfaces A, Vol. 104,
1995, pp. 249-257
from Wastewater by Bentonite,” Applied Clay Science, Vol.
9, 1994, pp. 31-4
[8] C. A. P Almeida, N. A. Debacher, A. J. Downsc, L. Cot-teta and C. A. D. Mello, “Adsorption Behaviour of a Cationic Surfactant on Montmorillonite,” Journal of Colloid and Interface Science, Vol. 332, 2009, pp.
46-
[9] W. Zhijian, A. Ik-Sung, L. Chang-Ha, K. Jung-Hyun, G. S. Yong and L. Kangtaek, “Enhancing the Organic Dye Ad-sorption on Porous Xerogels,” Colloids and Surfaces, Vol. 240, pp. 157-164.
[10] A Nennemann., S. Kulbach and G. Lagaly, “Entrapping Pesticides by Coagulating Smectites,” Applied Clay Sci-ence, Vol. 18, 2001, pp. 265-275.
[11] C. Volzone and L. B. Garrido, “The Effect of Some Physicochemical and Mineralogical Properties on the Na2CO3 Activation of Argentine Bentonites,” Applied Clay Science, Vol. 6, 1991, pp. 143-154.
[12] A. Boukeroui and M. S. Ouali, “Activation D’une bentonite Par un Sel D’ammonium: Evolution de la Capacité D’échange et de la Surface Spécifique,” Annales de Chimie Science des Matériaux, Vol. 25, 2000, pp. 583-590.
[13] R. Mokaya, W. Jones, M. E. Davies and M. E. Whittle “Preparation of Alumina-Pillared Acid-Activated Clays and Their Use as Chlorophyll Adsorbents,” Journal of Materials Chemistry, Vol. 4, 1993, pp. 381-387.
[14] K. Nakagawa, SR. Mukaï, T. Suzuki and H. Tamon, “Gas adsorption on Activated Carbons from Mixtures of PET With Metal Salt,” Carbon, Vol. 41, 2003, pp.
157-164.
[15] P. E. Gonzalez and S. E. Villafranca, “Evolution of Sur-face Properties in a Bentonite as a Function of Acid and Heat Treatment,” Journal of Chemical Technology and Biotechnology, Vol. 52, 1991, pp. 211-218.
[16] E. Erde, N. Karapinar and R. J. Donat, Journal of Colloid Interface Science, Vol. 280, 2004, pp. 309-314.
[17] G. Ozdemir and S. Yapar, “Adsorption and Desorption Behavior of Copper Ions on Namontmorillonite: Effect of Rhamnolipids and PH,” journal of Hazardous Materials,
Vol. 166, 2009, pp. 1307-1313.
[18] F. Bergaya, B. K. G. Theng and G. Lagaly, “General In-troduction,” Clay Minerals, and Clay Science, chap.1. In: (Eds.) Handbook of Clay Science. Development ofClay
Science1, Amsterdam, 2006, pp. 1-18.
[19] S. Guggenheim, “Summary of Recommendations of No-menclature Committees Relevant to Clay Mineralogy,”
Report of the International Association for the Study of Clays (AIPEA) Nomenclature Committee, Clays and Clay Minerals, Vol.54, No. 6, 2006, pp. 761-772.
[20] E. Srasra and M. Trabelsi-Ayedi, “Textural Properties of Acid Activated Glauconite,” Applied Clay Science, Vol.17, 2000, pp. 71-84.
[21] M. F. Brigatti, A. Laurora, D. Malferrari, L. Medici and L. Poppi, “Adsorption of [Al (Urea)6]
3+
and [Cr(Urea)6] 3+
Complexes in Vermiculite Interlayer,” Applied Clay Science, Vol. 30, 2005, pp. 21-32.
[22] S. Caillère and S. Hénin, “Minéralogie des Argiles,” Masson, Paris, 1963, pp. 211-225.
[23] S.Petit, D. Righi, J. Madejova and A. Decarreau, “Inter-pretation of the Infrared NH4+ Spectrum of the NH4
+
-Clays: Application to the Evaluation of the Layer Charge,” Clay Minerals, Vol. 34, 1999, pp.
543-5
[24] J. P. Coates, “A Practical Approach to the Interpretation of Infrared Spectra,” Ed. R.A. Meyers, Encyclopedia of Analytical Chemistry, Vol. 12, John Wiley and Sons Ltd, Chichester, UK, 2000, pp. 10815-10837.
[25] E. Joussein, S. Petit and A. Decarreau, “Une Nouvelle Méthode de Dosage des Minéraux Argileux en Mélange Par Spectroscopie IR,” Comptes Rendus de l'Académie des Sciences, Sciences de la Terre et des Planètes, Paris, Vol. 332, pp. 83-89.
[26] F. C. Wu, R. L. Tseng and R. S. Juang, “Preparation of Highly Microporous Carbons from Fir wood by KOH Activation for Adsorption of Dyes and Phenols from Wa-ter,” Separation and Purification Technology, Vol. 47,
2005, pp. 10-19.
[27] N. Rajic, D. Stojakovic, M. Jovanovic and N. Zabukovec Logar, “Removal of Nickel(II) Ions from Aqueous Solu-tions Using the Natural Clinoptilolite and Preparation of Nano-Nio on the Exhausted Clinoptilolite,” Applied Sur-face Science, Vol. 257, 2010, pp. 1524-1532.
[28] C. Lu, C. Liu and Su, F, “Sorption kinetics, Thermody-namics and Competition of Ni2+ from Aqueous Solutions onto Surface Oxidized Carbon Nanotubes,” Desalination, Vol. 249, 2009, pp. 18-23.