J. Range Manage.
57:130 -140 March 2004
Spatio - temporal rainfall variation and stock management in arid Namibia
DAVID WARD, DAVID SALTZ, AND BEN T. NGAIRORUE
Authors are Professor, Department of Conservation Ecology, University of Stellenbosch, Matieland 7602, South Africa, Senior Lecturer, Mitrani Department for Desert Ecology, Jacob Blaustein Institute for Desert Research, Ben Gurion University of the Negev, Sede Boger 84990, Israel, and Research Student,
Desert Research Foundation of Namibia, 7 Rossini Street, Windhoek, Namibia.
Abstract
The high inherent variability in rainfall and forage availability in arid regions makes it very difficult for a rancher to establish a herd size that is suited to the environment and also complicates management decision - making regarding the distribution of ani- mals within and between areas of a single ranch. We recorded the temporal and spatial variability in rainfall and grass produc- tion on a local scale on 3 ranches in arid Namibia over 3 years, to determine their effects on potential stocking density, stock move- ment decisions and timing of grazing. We conducted a 3 -year experiment to test the effects of the timing of grazing on grass regrowth. Furthermore, we tested the reliability of a rule -of- thumb used by ranchers to ascertain whether a drought year is likely and whether they should sell some of their cattle in advance of drought. We expanded the scale of the study to include 31 ranches over a 700 km -long rainfall gradient to deter- mine the reliability of extrapolating conclusions obtained at a local scale to a larger geographic scale. We found that rainfall and grass production varied widely, resulting in recommended stocking densities up to 10 -fold smaller than those currently rec- ommended by the Namibian Ministry of Agriculture. We found that there is no optimal spatial or temporal scale of ranch man- agement, and that ranchers could do no better than a simple rule of "move the cattle to wherever there is most grass ". This simple rule's validitywas reinforced by the results of our experiment, which showed that there was no significant effect of timing of grazing on grass regrowth. Statistical analyses of long -term rain- fall records indicated that the ranchers' rule -of -thumb regarding approaching drought was unreliable and that this could lead to substantial loss of profit if adhered to.
Key Words: variability, ranching, drought, range management, grass production, arid environments, desert, Africa
This study was funded by grant no. TA-MOU-94-C13-149 by the U.S. Agency for International Development to David Ward, Uriel Safriel and Mary Seely. We thank Iris Musli, Vilho Mtuleni, Lilo Nghinanwame, and Shimrit Ginott -Lahav for assistance in the field. This is publication number 410 of the Mitrani Department for Desert Ecology and publication number 159 of the Ramon Science Center. The Ramon Science Center receives funding from the Israeli Ministry of Science and the Local Council of Mizpe Ramon.
Manuscript accepted 14 Jun. 03.
Resumen
La alta variabilidad inherente en la lluvia y la disponibilidad de forraje en regiones áridas hace muy dificil para los rancheros establecer un tamaño de rebaño que se ajuste al ambiente y además complica la toma de deciciones sobre el manejo referente a la distribución de animales dentro y entre áreas de un único rancho. En este estudio, registramos la variabilidad temporal y espacial en la lluvia y producción de pastos en una escala local en tres ranchos en la Namibia árida a lo largo de tres años, para determinar sus efectos en la densidad potencial de la ganadería, las decisiones de movimiento de ganado y el tiempo de pastoreo.
Realizamos un experimento de tres años para probar el efecto del pastoreo en el rebrote de pastos. Además, probamos la veracidad de "la regla del pulgar" usada por rancheros para acertar sí es probable un año de sequía y sí ellos deben vender algunas de sus reces antes de la sequía. Expandimos la escala de el estudio para incluir 31 ranchos sobre unos 700 km a lo largo de un gradiente de lluvia para determinar la veracidad de extrapolar conclusiones obtenidas a una escala local a una escala geográfica mayor. Encontramos que la lluvia y la producción de
pastos varía ampliamente, resultando en densidades de
ganadería recomendadas hasta diez veces más pequeñas que las recomendadas actualmente por el Ministerio de Agricultura en Namibia. Encontramos que no hay una escala espacial o temporal óptima para el manejo del rancho, y que los rancheros no pueden hacer mejor que una simple regla de "mover las reces a donde hay la mayor cantidad de pastos ". Esta simple validez de la regla fue reenforzada por el resultado de nuestro experimento, el cual muestra que no había un efecto significativo de el tiempo de pastoreo en el rebrote de pastos. El análisis estadístico de los registros de la lluvia a largo término indican que "la regla del dedo pulgar" de los rancheros referente a la llegada de la sequía
fue no verídica y que esto puede conllevar a perdidas
substanciales de ganancias si la obedece.
Overgrazing is frequently considered to be the major source of land degradation in arid parts of Africa (see e.g. Acocks 1953, Jarman and Bosch 1973, Sinclair and Fryxell 1985, Schlesinger et al. 1990, Dean and McDonald 1994, Quan et al. 1994, Middleton and Thomas 1997). However, several authors have contended that rainfall in arid regions is the major driving variable and has the ability to "recharge" a system that suffers heavy grazing pres- sure (Ellis and Swift 1988, Tapson 1993, Werner 1994, Sullivan 1996). Indeed, high temporal and spatial variation in rainfall is characteristic of arid areas (see e.g. Sharon 1972, 1981, Evenari
et al. 1982), which results in arid grazing ecosystems that are non equilibrial, event - driven systems (see e.g. O'Connor 1985, Venter et al. 1989, Milchunas et aí.1989, Behnke and Abel 1996, Parsons et al.
1997). Indeed, it is generally agreed that where pastoralists are able to maintain their activities on a large spatial scale by
migrating to areas where key rich
resources can be exploited, negative effects of grazing on plant biodiversity do not develop (Sinclair and Fryxell 1985, Ellis and Swift 1988, Behnke and Abel 1996). Moreover, even where pastoralists are forced to settle in small areas, abiotic variables such as precipitation may be of such over - riding importance that these negative effects of grazing can not be detected (see e.g. O'Connor 1985, Archer et al. 1989, Tapson 1993, Scoones 1995, Ward et al. 1998, 2000a, 2000b).The high inherent variability in grass production in arid regions makes it very difficult for the rancher to establish a herd size that is suited to the capacity of the environment to sustain these animals and also complicates management decision making regarding the distribution of ani- mals within and between areas of a single ranch. Indeed, informal surveys conducted by us in and Namibia indicate that ranch- ers find that they are overgrazing their land even when they comply with the stocking densities recommended by agri- cultural extension officers. Clearly, there is much still to be learned about the nature of the temporal and spatial variability in rainfall and how it affects the production of natural forage.
We recorded the spatial and temporal variation in rainfall and grass production on 32,000 ha on 3 contiguous commercial ranches in an and area of central Namibia and attempted to ascertain how this vari- ability affects management decisions made by ranchers and how, if at all, cur- rent management strategies could be improved upon. To determine the general- ity of the results obtained at this local scale, we also examined the effects of temporal and spatial variation in rainfall on grass production, over a 700 km -long gradient on 31 commercial ranches from south to north in Namibia.
Management decisions pertaining to arid Namibian ranches
Some of the most important stock man- agement options available to ranchers in and Namibia include:
Stocking density.- Rangeland capacity calculations in Namibia are conventionally
made on the basis of the relationship
between grass biomass and mean annual rainfall of the region, with the assumption that livestock eat a mean amount of grass (which is related to body mass) each day.
This is known as the "biomass" concept of grazing capacity (Bester 1995). Empirical data indicate that an average cow in Namibia weighs 450 kg and eats 3% of her mass in grass per day (Van Schalkwijk 1978, Bester 1995). Through division of this intake rate into total grass biomass/ha, one can calculate stocking capacity.
However, because there is often a negative correlation between the mean and variabil- ity in rainfall quantities, the scale over which such estimates are valid varies widely. The current method of ascertain- ing stocking density in Namibia uses a regionwide stocking density calculation (see Van der Merwe 1983) based on mean annual rainfall in consecutive 100 mm iso- hyets. Because this estimation ignores the negative correlation between the mean and the variance in rainfall, it may be a very imprecise way of determining stocking density. Based on the biomass concept, we calculated stocking density over a grid of 14 raingauges on 32,000 ha of 3 ranches to ascertain the reliability of measurements made on the basis of a single regional mean annual rainfall value.
Where to move stock.- By 1958, several experimental ranches in Namibia started studies using different multi - paddock and continuous grazing systems (Bester 1995).
As a result of this research, a 4- paddock per herd system was adopted by many ranchers. In this system, the growing sea- son was subdivided into several periods, allowing an early summer, a late summer, and a winter grazing period while 1 pad- dock was rested for the full growing sea- son (Rowland 1974). This system allowed perennial plants a rest period to recover lost resources. However, there are a num- ber of cases where ranchers with a single paddock, continuous grazing strategy do as well as those using the multi - paddock system (Bester 1995). A continuous graz- ing system is less labor intensive and far cheaper than a multi paddock system due to the reduced need for fencing. Until 1990, when Namibia was still under South African control, ranchers were offered
financial incentives to erect fences
because of the perceived benefits for agri- cultural production. However, since 1990, such incentives have been cancelled and many ranchers question whether the pur- ported benefits of multi - paddock systems outweigh the substantial increased costs.
We measured the amount of grass avail- able monthly over a grid covering 3 ranch-
es to determine whether there was an appropriate spatial scale over which ranch- es should be managed. Finding such a scale would allow the rancher to manage sub - sections of the ranch in a manner that is suitable to the amount of stock that can reasonably be maintained on each section and would contribute to the understanding of the relative benefits of continuous graz- ing vs. multi - paddock systems in these arid conditions.
When to graze particular parts of the ranch.- Conventional wisdom and some empirical data (e.g. Danckwerts and Stuart-Hill 1987, Danckwerts 1993) dic- tates that grazing in the wet season has a greater negative effect on grasses than grazing in the dry season because the above - ground portions of the grass are dead in the dry season and thus no nega- tive feedback effect occurs on the plant's resources (Hoffman 1997). This rationale is clearly related to the use of multi -pad- dock systems outlined above. Following this reasoning, heavy stocking in the dry season is of little consequence, while wet season grazing needs careful monitoring to prevent depletion of plant resources.
An additional management considera- tion in terms of moving stock in central Namibia is the use of mountains as graz- ing land. Ranchers frequently use the mountains for grazing immediately after
the rains (rainy season = Septem-
ber March) but bring the animals down in the dry season because of the logistic diffi- culties involved in getting the animals to water. Also, losses to hyaenas Crocuta cro- cuta and occasionally lions Panthera leo are significant in the unguarded mountain regions. For example, one of the farmers in this study lost 17 cows to hyaenas in a sin- gle year. We designed an experiment to test the effects of dry and wet season grazing on grass production on the above - mentioned ranches.
When to sell animals in a drought.- The most obvious response to drought condi- tions is to sell some of the herd to reduce pressure on the plant resources and to maintain condition of the remaining ani- mals, in particular that of the breeding nucleus. The high inherent variability in the spatial and temporal distribution of rainfall frequently confounds ranchers' attempts at finding a reliable way to decide early on in the growing season whether the entire season will be dry to pre -empt the negative impacts of a large herd on the grazing resource. Ranchers in Namibia have a common rule of thumb when it comes to selling animals in times of drought. This rule states that "if rains
are poor by December, then sell 33% of your animals because it is likely to be a drought year ". We performed statistical analyses on long -term rainfall records
available from a number of sites in
Namibia to determine the reliability of this rule. We wished to determine whether a dry early season (September December) is likely to indicate a drought year overall.
Methods
Study ranches(i) Local -scale study
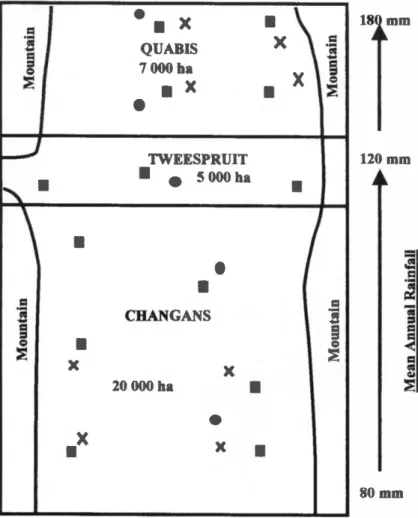
Three contiguous ranches arranged along a north -south rainfall gradient were studied in central Namibia (Fig. 1). The rainfall gradient runs from 80-180 mm per annum. The vegetation follows a savanna to grassland transition along this gradient.
All ranches have sandy soil on a single rock type, schist, minimizing possible variation in grass production due to a het- erogeneous soil layer. The 3 ranches lie in
a north -south running valley and are flanked on either side by parallel mountain ridges. The northernmost ranch, Quabis (22 °50' S, 15 °55' E), is 7,000 ha in size and has a mean ± S.E. long -term rainfall
of 160 ± 44 mm. The central ranch,
Tweespruit (22 °55' S, 15 °55' E), is 5000 ha in size and has a mean ± S.E. long -term rainfall of 122 ± 35 mm, and the southern ranch, Changans (23 °00' S, 15 °55' E), is 20,000 ha in extent and has a mean ± S.E.
long -term rainfall of 101 ± 32 mm.
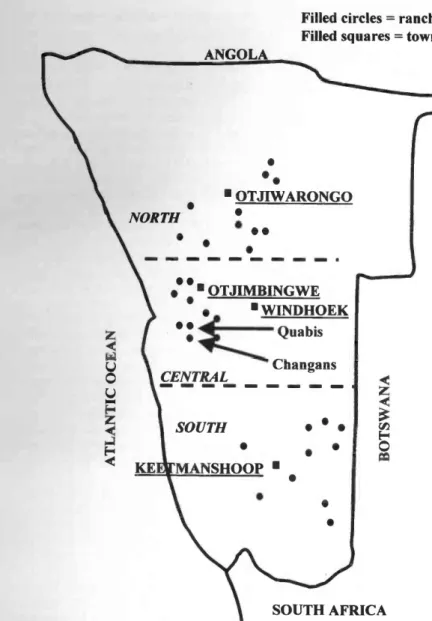
(ii) Large -scale study
The rainfall gradient in Namibia runs approximately from north to south. Thus, for the large -scale study, we chose 10 or 11 ranches within 100 km radius of each of the following towns /cities arranged along this gradient (Fig. 2) where long- term rainfall data (approx. 100 years) were available: Otjiwarongo (north; mean annu-
al rainfall = 450 mm; c.v. = 0.34),
Windhoek (central; mean annual rainfall = 361 mm; c.v. = 0.39) and Keetmanshoop
X QUABIS 7 000 ha
X
X
XTWEESPRUIT
5000ha
CHANGANS
X
20 000 ha
sx
X
X
18 mm
120 mm
80 mm
Fig. 1. Schematic map of the ranches Quabis, Tweespruit and Changans in central Namibia.
Squares indicate the position of the 14 raingauges, circles indicate the position of the exclo- sures and X indicates the position of the grass - clipping plots.
(south; mean annual rainfall = 158 mm;
c.v. = 0.66). These ranches were chosen randomly with the stipulation that at least 10 consecutive years of rain data were available for each ranch. Mean ± S.E.
annual rainfall on the northern ranches was 388 ± 17 mm, in the central region was 183 ± 26 mm, and in the south was 141 ± 13 mm. We collected stocking data from the ranchers for the 1996 -1997 sea-
son and obtained medium -term stocking data (for the 10 years prior to this season)
from the Namibian Directorate of
Veterinary Services. All stocking values were converted to Large Stock Units (LSU's) per hectare, following Meissner et al. (1983).
Rainfall
We measured monthly rainfall at 14 raingauges distributed approximately equidistantly along the length of the rain-
fall gradient on the ranches Quabis,
Tweespruit and Changans from October 1995 until September 1998. Long -term rainfall data were obtained for the 31 ranches in the large -scale study from the Namibian Weather Bureau.Grass biomass and height
We measured grass biomass within a 100 m radius of each of the 14 raingauges on Quabis, Tweespruit and Changans
monthly from October 1995 until
September 1998. All of these sites were situated on the plains. A further 2 sites were situated in the mountains on the east- ern and western sides of these ranches.
Grass was clipped to ground level within a 1m2 frame, dried and weighed. Eight sub samples of grass were taken within a 100 m radius by random positioning of the frame at each site (= replicate) each month.
The optimal number of subsamples per site was determined in a pilot study in which we plotted the coefficient of varia- tion in grass biomass against the cumula- tive number of subsamples. The mean number of subsamples (across sites) at which the asymptotic coefficient of varia- tion was reached was chosen as the level of subsampling per site.
For the large -scale study on the 31 ranches, we measured mean grass height using a point- frequency frame at the end of the wet season of 1997. The frame is made from aluminium and is 1 m high and 1 m long, has 10 guide holes bored per- pendicular through the 2 horizontal fixed bars (Mueller - Dombois and Ellenberg, 1974). A steel rod of the same length as the legs is slid through the holes which are equally spaced, 10 cm apart, along the lin- ear frame.
ANGOLA
Filled circles = ranches Filled squares = towns
NORTH
d
Ó U
E-
SOUTH
tt KE MANSHOOP
OTJIWARONGO
OTJIMBINGWE WINDHOEK
Quabis
CENTRAL Changans
SOUTH AFRICA
Fig. 2. Schematic map of the 31 ranches in the large -scale study and the position of the cities and towns (squares) mentioned in the text.
The point- frequency frame is placed with its legs over the vegetation to be measured and the pins are lowered verti- cally one after the other. Wherever the pin touches the vegetation the height is
recorded. We took the mean of each place- ment of the frame as a single data point in our analyses to avoid pseudoreplication.
This provides a measure of percentage cover for the species that are intercepted by pins, as well as the mean grass height (Mueller - Dombois and Ellenberg 1974).
The high spatial and temporal variance in plant cover, biodiversity and soil quality in and ecosystems makes comparisons of the effects of grazing on plant biodiversity across habitats and ecosystems rather com- plex. For this reason, many researchers have emphasized comparisons in the pios- phere, the region of heavy grazing around
watering points (James et al. 1999).
Clearly, animals in arid ecosystems are limited by the availability of water and hence tend to collect there. As a result, these are usually the most heavily dam- aged areas in a ranching ecosystem. To make unbiased comparisons across ranch- es, we sampled grass along a 1000 m tran- sect starting at the most active watering point on each ranch. Three placements of the frame 20 m apart were done at 100, 200, 300, 500, and 1,000 m from each watering point. At each point, we also col- lected soil samples for analysis of organic carbon, total nitrogen, phosphorus, con- ductivity, pH and water holding capacity (for further details, see Ward et al. 1998).
Ranches with good grass production should have both a greater mean and steeper slope of grass height with increas- ing distance from the watering point.
Plant cover and species richness near and far from watering points
To determine whether stocking levels on the study ranches have significant negative
impacts on the vegetation, we used
McAuliffe's (1990) log- series surveymethod to record percentage cover,
species richness and species diversity of perennial plants in a total of 39 plots on Quabis, Tweespruit, and Changans ranch- es in September 1995. This method has proved to be one of the most effective means of recording semi -desert and desert vegetation (Ward and Olsvig- Whittaker 1993, Ward et al. 1993). We used a plot radius of 12.9 m. We surveyed annual and perennial grasses within these plots using a point intercept method.Exclosures
We erected five, 20 m X 20 m exclo- sures equidistantly along the length of the north -south axis of the farms in January 1996 to compare the amount of grass growing inside to that eaten by stock out- side the exclosures. These exclosures were 3 m high and excluded all large mam- malian herbivores. In March 1998 at the end of the wet season, we measured grass height inside and outside the exclosures using a point- frequency frame. Twenty placements of the frame at random were used to measure grass height in each plot.
Grass - cutting experiment
To simulate the effects of grazing in dif- ferent seasons, we conducted an experi- ment on Quabis and Changans ranches.
Four sets of plots were set up on each ranch. Within each set, one plot was ran- domly assigned as a control (non- clipped), one as dry- season clipped and one as wet season clipped. Dry- season clips were conducted in October each year and wet season clips in March. Each plot was 10 m X 10 m in size. The experiment ran from October 1995 until March 1998. Final grass height on each plot was recorded in September 1998.
Vegetation community analyses We used detrended correspondence analysis (DECORANA) for the analysis of differences between perennial plant com- munities near and far from water. DECO RANA is an improved multivariate eigen- vector technique based on reciprocal aver- aging (also called' correspondence analy- sis') but correcting its main faults (Hill and Gauch 1980). The DECORANA pro-
gram is an effective and objective means of summarizing data on plant presence and abundance into one or more composite dimensions (axes) that represent the over- all relationships among plant communities (Hill and Gauch 1980).
Spatial analyses
We used Mantel tests to determine whether there was a significant correlation between the similarity in rainfall /grass between any pair of sites and the geo- graphic distance between them. We used semivariograms to determine if there was an appropriate spatial scale of variance in rain and grass distributions. Semivari- ograms plot the semivariance of measured parameters against the distance between sites (Davis 1986). Semivariance (yh) =
EN
xi +h) /2n, where xi = measurement at site i and xi +h = another measurement taken at distance h from i. The number of sites is n, so the number of comparisons between pairs of sites is n -h. Typically, semivariance increases from the origin with increasing distance between sites until an asymptote is reached at which the semivariance = variance, 62 (Davis 1986).The point at which the asymptote, a, is reached on the x axis is half the spatial scale at which appropriate management decisions should be made because this is the scale at which variation in the abiotic phenomena (in this case, rainfall) acts.
Should the regression of semivariance against distance increase across the entire range of measured inter -site distances without reaching an asymptote, this indi- cates that the scale of variation is greater than that of the study area. Conversely, should the regression line run parallel to the abscissa across the entire ranges of inter -site distances, this indicates that the scale of variation is smaller than the mini- mum inter -site distance measured and that variation over the measured inter -site dis- tances is ostensibly random.
Kriging was used to extrapolate con- tours of equal stocking density on the basis of grass biomass measurements near each of the 14 raingauges mentioned above. Kriging provides a means of inter- polating values for points not physically sampled using knowledge about the under- lying spatial relationships in a data set (Davis 1986). Semivariograms provide this knowledge. Kriging is based on regionalized variable theory and provides an optimal interpolation estimate for a given coordinate location, as well as a variance estimate for the interpolation
value.
Results across sites (r = 0.58, F = 6.161, P = 0.029, error d.f. = 12).
Temporal variation in rainfall on Quabis, Tweespruit and Changans
Mean annual rainfall differed consider- ably among years. Mean ± S.E. rainfall across the 14 raingauges in the 1995 -1996 season was 59 ± 8 mm, in the 1996 -1997
season was 124 ± 16 mm, and in
1997 -1998 was 85 + 8 mm. The correla- tion in rainfall between sites across years was significant for the 1995 -1996 vs.
1996 -1997 comparison (r = 0.76, F = 16.701, P = 0.002, error d.f. = 12), but not for the 1995 -1996 vs. 1997 -1998 compar- ison (F = 1.475, P = 0.248, error d.f. = 12) or the 1996 -1997 vs. 1997 -1998 compari- son (F = 1.802, P = 0.204, error d.f. =12).
There was a significant positive correla- tion between grass mass averaged over months and average seasonal rainfall
"E 60 E
: 40
(Li 30
Ó c ri á ó c ci á ó ó u.
Spatial variation in rainfall on Quabis, Tweespruit and Changans
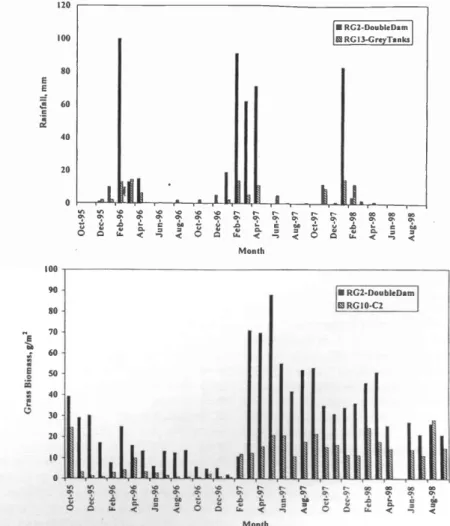
There were large differences in rainfall and grass biomass between sites (Fig. 3a and 3b). There was neither a significant correlation between monthly rainfall and distance between sites (Mantel test: r = - 0.02, P = 0.609, 999 permutations) nor between grass biomass /m2 and distance between sites (Mantel test: r = - 0.10, P = 0.792, 999 permutations). Similarly, semi variograms show no pattern in seasonal rainfall or mean grass biomass at the end of the wet season in all 3 years (Fig. 4a- 4f). The results are consistent with a ran- dom distribution of rainfall and grass across sites. Thus, there is no single appro- priate spatial scale for management of
stock movements.
120
100
80 E E
TF. 60
40
20
0
r
RO.
á ,
r-1
c;
ó
RG2-DoubleDam
®RG 13-G reyTa n ks
á
ú ç
ÿ
(i
á Q
00 0 0
a
ó Cn
ON c rn
o d ¢
s.0 rn C
P o
T
loo
Month
90 -
80 70
50
RG2-DoubleDam RG 10-C2
Month
Fig. 3. a. Histogram indicating monthly rainfall at the 2 extreme raingauges during the 3- year study. Double Dam is on Quabis ranch and Grey Tanks on Changans ranch.
b. Histogram indicating mean monthly grass biomass/m2 at the 2 extreme grass sites during the 3 -year study.
8000
o o
800 600 400 200
10 20 30
Distance between raingauges, km
d) Semivariogram of grass mass vs.
distance - March 1997
Rainfall and vegetation correlations with altitude on Quabis, Tweespruit and Changans
There was a significant positive correla- tion between average seasonal rainfall and altitude (r = 0.75, F = 15.603, P = 0.002, error d.f. = 12). There was a significant positive correlation between mean grass biomass and altitude (r = 0.53, F = 4.778, P = 0.049, error d.f. = 12). Plant species richness in McAuliffe plots was also sig- nificantly correlated with altitude (r = 0.53, F = 14.448, P < 0.001, error d.f. = 37). Contrastingly, percentage plant cover in McAuliffe plots was not significantly correlated with altitude (F = 2.676, P = 0.110, error d.f. = 37).
Effects of grazing on grass inside and outside exclosures on Quabis, Tweespruit and Changans
We found a strong positive correlation between grass biomass /m2 and mean grass height (r = 0.87, F = 40.59, P < 0.001, error d.f. = 13) at Otjimbingwe in the cen-
tral region of our study. The best -fit regression equation is: Grass Biomass (g /m2) = 0.181 *Mean Grass Height (cm) ± 4.746.
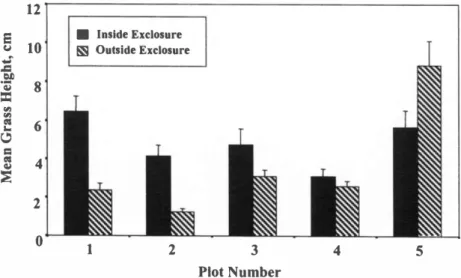
There was a highly significant differ- ence in mean ± S.E. grass height between sites inside (4.8 ± 0.3 cm) and outside exclosures (3.6 ± 0.3 cm) in March 1998 (F = 7.640, p = 0.006, error d.f. = 44) (Fig.
5). Noteworthy is the single exclosure in which the mean value is lower than that outside it, indicating the effects of either herbivory by termites or abiotic factors inside the exclosure.
Plant cover and species richness near and far from watering points on Quabis, Tweespruit and Changans
There was no significant difference in plant species richness near (6.1 ± 0.4
species per plot) and far (6.6 ± 0.4
spp. /plot) from water (F = 0.754, p = 0.391, d.f. = 37) in September 1995.Similarly, there was no significant differ- ence in the percentage plant cover in plots near (34 ± 5 %) and far (30 ± 2 %) from watering points (F = 0.662, P = 0.421, error d.f. = 37).
We used DECORANA to compare veg- etation community structure between sites near and far from watering points. The percentage of variance explained by the first 2 axes in the DECORANA was low (DC1 = 18.9 %, DC2 = 8.4 %). There was no significant correlation between DC 1
a) Semivariogram of rainfall vs. distance - 1995 -1996 season
4000 3000 2000 1000 -
0
0 10 20 30
Distance between raingauges, km
*
c) Semivariogram of rainfall vs. distance - 1996 -1997 season
16000
12000
>
E cit 4000
00 10
'
20 30Distance between raingauges, km
e) Semivariogram of rainfall vs. distance - 1997 -1998 season
2500 2000 1500 1000 500 0
0 10
Distance between raingauges, km
.
20 30b) Semivariogram of grass mass vs.
distance -1995 -1996 season
80 60 40 20
o o
250 200 150 100 50 0 0
10 20 30
Distance between raingauges, km
f) Semivariogram of grass mass vs.
distance - March 1998
.
lo 20
Distance between raingauges, km
Fig. 4. a. Semivariogram of rainfall in the 1995 -1996 season.
b. Semivariogram of mean monthly grass biomass /m2 in the 1995 -1996 season.
c. Semivariogram of rainfall in the 1996 -1997 season.
d. Semivariogram of monthly grass biomass /m2 in the 1996 -1997 season.
e. Semivariogram of rainfall in the 1997 -1998 season.
f. Semivariogram of monthly grass biomass /m2 in the 1997 -1998 season.
12
10 8 6 4
2
0
Inside Exclosure
® Outside Exclosure
1 2 3
Plot Number
4
Fig. 5. Mean ± S.E. grass height inside and outside exclosures in March 1998.
5
30
values and altitude (F = 1.337, P = 0.255, error d.f. = 37), although there was a high- ly significant positive correlation between DC2 values and altitude (r = 0.42, F = 7.750, P = 0.008, error d.f. = 12). We found a highly significant difference in DC 1 values between sites near and far from watering points (t = 2.962, P = 0.006, d.f. = 35). There was no significant differ- ence in DC2 values between sites near and far from the watering points (t = 0.893, P
= 0.378, d.f. = 35). Together these results indicate that the most important axis in this ordination (DC 1) is primarily a graz- ing intensity axis while DC2 is correlated with altitude (which is correlated with rainfall (see above)) (Fig. 6).
Large -scale study on 31 ranches Seasonal rainfall on these ranches in the year in which we conducted this study (1997) did not differ significantly from the long -term mean (paired t -test: t = 0.524, P
= 0.604, d.f. = 30). Mean ± S.E. rainfall in the 1996/1997 season was 232 + 30 mm, while the long -term mean ± S.E. rainfall on these ranches was 240 ± 22 mm.
There was a significant negative correla- tion between the coefficient of variation in annual rainfall and median annual rainfall across all sites (r = 0.97, F = 92.678, P <
0.001, error d.f. = 6). There was no signifi- cant correlation between the coefficient of determination in annual rainfall between pairs of ranches and the geographic dis- tance between them in any of the 3 regions of Namibia (Mantel tests: north r = -0.372, P = 0.994; central r = -0.043, P = 0.590; south r = -0.076, P = 0.659; 999 per- mutations used in all tests). Mean ± S.E.
coefficient of determination in rainfall between pairs of farms was low in all regions: in the north was 0.47 ± 0.02, in the central region was 0.32 ± 0.03, and in the south was 0.33 ± 0.04.
We ran a multiple linear regression between mean grass height and mean annual rainfall, a number of soil quality variables (organic carbon, water holding capacity, nitrogen, phosphorus, pH, con- ductivity) and the short-term and medium - term (11 years) stocking densities. There was a significant positive correlation between grass height and these variables (r
= 0.87, F = 6.002, P < 0.001, error. d.f. = 20). However, of all these independent variables, rainfall only had a significant effect (t = 5.457, P < 0.001). A simple lin- ear regression of mean grass height per ranch on mean annual rainfall was highly significant (r = 0.81, F = 52.41, P < 0.001, error d.f. = 29). There was also a signifi- cant, although weaker, positive correlation
-1
0 0
O Near to Watering Point Far from Watering Point
o o
o
1
o o
i o
No2 DC 1
00
3 4 5
Fig. 6. Detrended correspondence analysis of plots near and far from water on Quabis, Tweespruit and Changans. Each point indicates a plot.
between mean grass height per ranch and 1996 -1997 seasonal rainfall (r = 0.70, F = 27.796, P < 0.001, error d.f. = 29).
Effects of short -term and medium -
term grazing
We tested for the effects of short-term and mean medium -term stocking density on mean grass height on the 31 farms in the large -scale study. We regressed the residu- als from the above mentioned grass height:
mean annual rainfall regression on these stocking densities. We used mean annual rainfall rather than seasonal rainfall because the coefficient of determination was higher in the regression on mean annual rainfall (see above). There was no significant effect of either current (F = 0.715, P = 0.405, error d.f. = 29) or medium -term stocking density (F = 0.383, P = 0.541, error d.f. = 29) on grass height residuals.
Management options
Stocking densities in different years on Quabis, Tweespruit and
Changans
We calculated the geometric mean ±
S.E. stocking density for Quabis,
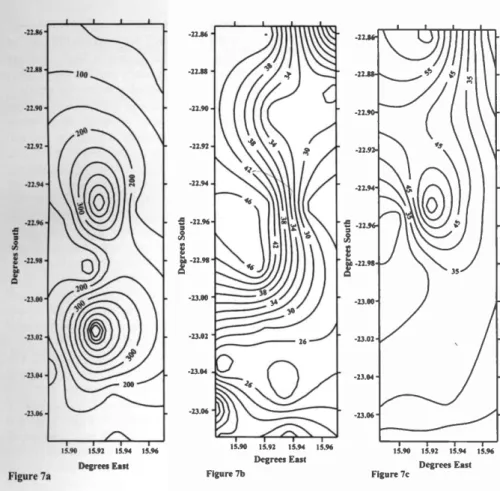
Tweespruit and Changans for each of the 3 years on the basis of the "biomass" con- cept of grazing capacity using data for grass production at the end of the wet sea- son (Bester 1995). Calculated stocking density ranged from 603.51 ha /LSU ( =LSU) at one site to 13.82 ha/LSU, with a mean ± S.E. of 77.426 ± 17.971 ha/LSU (c.v. = 0.66) (Fig. 7a -7c). These stocking densities are considerably lower than the recommended stocking density for this region of 18 -24 ha/LSU (cited by Van der Merwe 1983). These results (Fig. 7a -7c) emphasize the extreme spatial and tempo- ral variability in stocking densities, even on a small spatial scale. We also calculat- ed the relationship between the coefficient
of variation in calculated stocking density and the cumulative number of sites at which it was calculated (Fig. 8). The point at which an asymptote is reached indicates the minimum number of sites at which it is necessary to measure grass biomass to estimate the stocking density of a ranch
using the "biomass" concept. Five
(1995 -1996 season) to 7 sites (1996 -1997 and 1997 -1998 seasons) are necessary to calculate stocking density (Fig. 8).
Timing of grazing
In a Nested ANOVA (sites nested with- in ranch), there was a highly significant difference among treatments (F = 27.868, P < 0.001, error d.f. = 1177) and between ranches (F = 16.041, P < 0.001) in the grass - clipping experiment. Using Scheffe's post hoc tests, we found that the significant difference among treatments was only due to the significant difference between the control and the other 2 treat- ments (wet and dry season clips). Mean ± S.E. grass height in the control plots was 4.940 ± 0.410 cm, in the dry season clip- ping plots was 2.041 ± 0.215 cm, and in the wet season clipping plots was 2.653 ± 0.230 cm (Fig. 9). Thus, the amount of clipping but not the timing of clipping influences mean grass height.
Mountain vs. plains differences in grass biomass
There was no significant difference in grass biomass between mountain (7.5 ± 1.0 g /m2) and plain sites (6.8 ± 1.7 g /m2) in either March 1996 (t = 0.370, P = 0.715, d.f. = 22) or in March 1997 (t = 1.605, P = 0.126, d.f. = 22; mountain = 28.7 ± 1.8 g /m2, plains = 21.7 ± 4.0 g/m2).
However, in March 1998, grass biomass was significantly higher in mountain (33.9 + 2.2 g /m2) than in plains sites (19.3 ± 2.2 g /m2) (t = 4.781, P < 0.001, d.f. = 22).
_o
á+°
-22.86
-22.88
-22.90
-22.92
-22.94
-22.96
-22.98
-23.00
-23.02
-23.04
-23.06
15.90 15.92 1
15.94 15.96 Degrees East Figure 7a
-22.86
-22.88 -
-22.90 -
-22.92 -
-22.94 -
e, -22.96, 0
Vi
pq -22.98
-23.00
-22.86'
-23.02
--
-23.04
30
26
-23.06
-0
15.90 15.92 15.94 15.96
Degrees East Figure 7b
- 22.90-
- 22.92-
- 22.94-
« - 22.96- 0
c7,
-22.98
-23.00-
35
-23.02 -
-23.04
-23.06 -
1 I 1 1
15.90 15.92 15.94 15.96
Degrees East Figure 7c
Fig. 7. a. Contour plot of calculated stocking densities (ha/LSU) on Quabis, Tweespruit and Changans in 1995 -1996. Values are in ha/LSU. Contours change by 50 ha/LSU. Smaller numbers indicate higher stocking densities (i.e. fewer hectares needed for an animal to subsist).
b. Contour plot of calculated stocking densities (ha /LSU) on Quabis, Tweespruit and Changans in 1996 -1997. Contours change by 2 ha/LSU. Smaller numbers indicate higher stocking densities (i.e. fewer hectares needed for an animal to subsist).
c. Contour plot of calculated stocking densities (ha /LSU) on Quabis, Tweespruit and Changans in 1997 -1998. Contours change by 5 ha/LSU. Smaller numbers indicate higher stocking densities (i.e. fewer hectares needed for an animal to subsist).
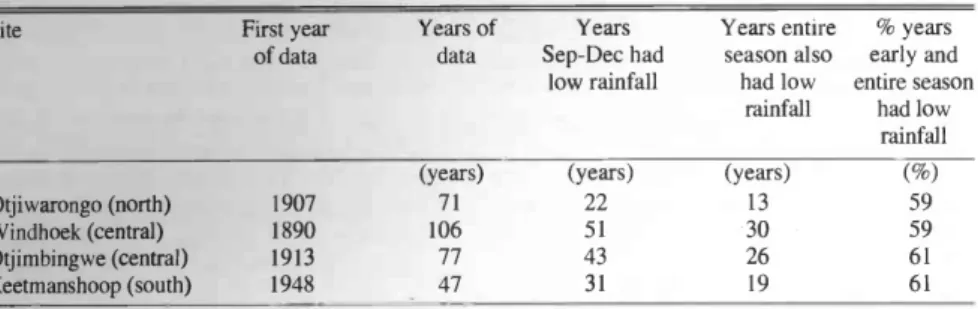
Probability of rain by Christmas At Otjiwarongo (north), 59% of the years in which early season rainfall was low had low seasonal rainfall (Table 1).
This percentage is not significantly differ- ent from parity (x2 = 0.727, P > 0.30, d.f.
= 1).
At Windhoek (center), 59% of the years in which early season rainfall was low had low seasonal rainfall (Table 1). This per- centage is not significantly different from parity (x2 = 1.588, P > 0.20, d.f. = 1).
At Otjimbingwe (center mean annual rainfall = 165.4 mm, c.v. = 0.69), 61% of the years in which early season rainfall was low had low seasonal rainfall(Table 1). This percentage is not significantly dif- ferent from parity (x2 = 1.884, P > 0.10, d.f. = 1). At Keetmanshoop (south), we had 47 years of monthly rainfall data since 1948. Of these, 31 years had September-
December rain that was below the lower 95% confidence limit of the long -term mean for those months. Of these 31 years, 19 years had a seasonal rainfall that was below the lower 95% confidence limit of the long -term seasonal mean. Thus, 61%
of the years in which early season rainfall was low had low seasonal rainfall. This percentage is not significantly different from parity (x2 = 1.581, P > 0.20, d.f. = 1).
The above mentioned results all indicate that the rule -of -thumb "if rainfall before Christmas [25 December] is low, then sell" is not reliable because the probability is not significantly better than equal that subsequent rainfall in that season will be poor. However, a more extreme definition of low rainfall as less than 50% of the mean seasonal rainfall may suffice as a rule -of- thumb. In Windhoek, there were 27 years in which September- December
rainfall fit this criterion and in 22 of these years the low seasonal rainfall criterion was fulfilled (i.e. 82% of years). This per- centage is significantly greater than parity (x2= 10.704, P > 0.01, d.f. = 1).
Discussion
Our results indicate the over riding importance of rainfall on grass production in Namibia, as has been found in several other arid ecosystems (e.g. Ellis and Swift 1988, Ward and Olsvig- Whittaker 1993, Ward et al. 1993, Ward et al. 1998). At a large spatial scale, rainfall variation appears to be the only important factor, and over -rides the effects of grazing, at least in the short to medium term (Ward
and Ngairorue 2000). The significant neg- ative correlation between c.v. and median annual rainfall indicates that the effects of grazing are likely to be less important as mean annual rainfall declines. However, this is not to say that there is no effect of grazing. Ward and Ngairorue (2000) have shown that grass production along this gradient is half the amount that it was 50 years ago (Walter 1939). Ward et al.
(2000b) have also shown that grazing may have important negative effects, but only if sustained in the longer term (see also Wiegand and Milton 1996). Our local scale study also showed that grazing can have a significant negative impact on veg- etation, as seen in: (a) our comparison of grass inside and outside exclosures, (b) in the significant differences in grass bio- mass and vegetation composition near and far from watering points, and (c) the sig- nificantly greater grass height on control plots than those grazed in either wet /dry season. Indeed, in the comparison of sites near and far from watering points, grazing had a stronger effect than altitude on vege- tation composition (which acts via its interaction with rainfall).
Timing of grazing and moving animals
There are conflicting opinions and data on the effects of the timing of grazing and the period of rest after drought on plant biodiversity. It has widely been observed that plants require a period of rest after
drought and heavy grazing
(e.g.Danckwerts and Stuart -Hill
1987, Danckwerts 1993, Van der Heyden and Stock 1995). In ecosystems where plants are not allowed to recover, land degrada- tion may occur as quickly as in ecosys- tems where stocking rates are 5 -10 times as high but plants are allowed to recover.o
Jr
Asy 1p
r.. ...Á
0.8c.o Z5
r:::
0 1.6 1.4 1.2
0.6
e
II- 95/96 SEASON A- 96/97 SEASON -G- 97/98 SEASON
I I I I
2 3 4 5 6
I 1 I
7 8 9
1 I I I I
10 11 12 13 14
No. of Sites
Fig. 8. Coefficient of variation in calculated stocking densities in three seasons plotted against cumulative number of sites at which grass biomass was measured. Mean minimum (± S.E.) distance between pairs of sites was 3.1 ± 0.2 km. The asymptotic value of 5-7 sites indicates the minimum number of sites required to reliably calculate mean stocking density by the
"biomass" method.
This may be one reason why comparisons of the effects of commercial and commu- nal ranching seldom show large differ- ences in impacts on vegetation in spite of far higher mean stocking rates on commu- nal ranches (Archer et al. 1989, Tapson 1993, Ward et al. 1998, 2000a, 2000b).
Commercial ranchers, such as those in this study, can usually afford to restock their lands soon after drought- induced mortality (or supplement forage to minimize mortal- ity), and do not allow the vegetation time to recover lost resources. Communal ranchers, on the other hand, can seldom afford to restock and thus must allow their herds to enlarge through natural reproduc- tion, much in the way that wild herbivore populations recover after drought- induced mortality (Ellis and Swift 1988). During
14
12 -
10
8 -
6 -
4 2 o
herd regrowth, stocking rates are well below capacity, allowing the plants to
recover lost resources. Indeed, the degrada- tion of the Sahel of North Africa is now considered to be a result of the settlement of pastoralists and the provision of supple- mentary feed during drought periods, resulting in increased stock survival and greater depletion of plant resources during the post drought recovery phase (Mainguet
1991, Sinclair and Fryxell 1985).
In marked contrast to the above -men- tioned studies, many studies comparing continuous and rotational grazing have found that the period of rest after grazing had little independent effect on biodiversi- ty and plant cover in semi -arid and arid systems above that induced by differences in stocking density (e.g. Denny and Steyn
Control Fl Dry Season Cut
Wet Season Cut
11\-4-1711
2 3 4 5 6
Plot Number
7 8
Fig. 9. Mean ± S.E. grass height in control and wet - season and dry- season clipped plots on Quabis (plots 1 -4) and Changans (plots 5-8) in September 1998.
1978, O'Connor 1985). Bryant et al.
(1989) compared the purported benefits of rotational short - duration heavy grazing described by Savory and Parsons (1980) with conventional continuous grazing.
They found that this stocking system pro- duced no positive influence on germina- tion or establishment of plants in arid and semi -arid regions of North America.
Furthermore, this stocking regime did not improve range condition at the same or higher stocking rates compared with con- tinuous grazing, and did not increase grass or forb standing crop. They considered stocking density to be the only important factor affecting plant cover and biodiversi-
ty. Nonetheless, they recognized that graz- ing systems that provide plants with rest periods are the only way to restore root reserves and replenish photosynthetic material (Bryant et al. 1989).
Our results indicate that there is no sin- gle appropriate spatial scale for moving animals (Fig. 4). Furthermore, there was no significant difference in the amount of grass on wet season and dry- season plots.
Thus, animals should be moved on an ad hoc basis to wherever there is most grass.
These results indicate that a multi - paddock system not particularly crucial (contra Savory and Parsons 1980, Danckwerts and Stuart-Hill 1987, Danckwerts 1993, Bester 1995). However, we note that there are sig- nificant negative effects of keeping ani- mals in a single region of a ranch; vegeta- tion density and composition was negative- ly affected in sites near to watering points relative to those further away. Thus, move- ments of animals should be designed with the purpose of minimizing damage near these watering points, rather than consider- ing whether it is the wet season or not.
The strong positive correlations of grass and rain with altitude indicate that there are some reliable features of the environ- ment that can be used as rules of thumb for moving animals. However, the fact that grass biomass was higher in the mountains than on the plains in only 1 year in 3 indicates that factors other than altitude minimize the reliability of altitude as a guide to grass availability.
Stocking densities
Our results (Fig. 7a -7c) for stocking densities based on the "biomass" concept emphasize the extreme spatial and tempo- ral variability in stocking densities in arid Namibia, even on a small spatial scale (Fig. 7a -7c). Furthermore, they emphasize the inappropriateness of calculating stock- ing densities on the basis of the mean rela- tionship between grass biomass and mean
Table 1. Probability of drought over an entire rainfall season (September - April) if the early season (September- December) was dry. The number of years in which September- December rainfall was low (i.e. below the 95% confidence limit of the mean) and the number of those years in which the entire season was also low (i.e. below 95% confidence limit of the seasonal mean) are recorded.
Site First year Years of Years Years entire % years
of data data Sep -Dec had
low rainfall
season also had low
rainfall
early and entire season
had low rainfall
(years) (years) (years) ( %)
Otjiwarongo (north) 1907 71 22 13 59
Windhoek (central) 1890 106 51 30 59
Otjimbingwe (central) 1913 77 43 26 61
Keetmanshoop (south) 1948 47 31 19 61
long -term rainfall. Furthermore, because the mean and the variance in rainfall are negatively correlated, stocking density should not be calculated for a range of mean rainfall isohyets (e.g. between 100 -200 mm) as is currently done (Van der Merwe 1983). Our calculations and results suggest a more appropriate way to calculate stocking densities: establish a grid of raingauges across the ranch, with an inter -gauge distance of about 3 km. At the end of March (end of the grass grow- ing season) at each gauge, randomly throw a 1 m2 frame at least 8 times and cut, dry and weigh the grass within the frame.
Calculate the mean grass biomass from at least 7 sites (the point at which the asym- potic c.v. is reached Fig. 8). Then calcu- late stocking density following the "bio- mass" concept as indicated above.
The results on the probability of a drought season occurring following an early dry season indicate that the current selling strategy followed by ranchers is inappropriate and unduly conservative.
We suggest that ranchers sell only 10 -15
% of their stock at the end of December (rather than 33% as is currently common) if the September- December rainfall is less
than the lower 95% confidence limit of the long -term mean. Then, if the entire season is indeed dry, the herd size can be adjusted at the end of March following the calcula- tions outlined above. This strategy is less conservative than the current strategy but is more closely consistent with the long- term variability in rainfall.
Literature Cited
Acocks, J.P.R. 1953. Veld types of South Africa. Mem. Bot. Surv. Sth. Afr. 28:1 -192.
Archer, F.M., M.T. Hoffman, and J.E.
Danckwerts, 1989. How economic are the farming units of Leliefontein, Namaqualand?
J. Grassi. Soc. S. Afr. 6:211 -215.
Behnke, R. and N. Abel. 1996. Revisited: the overstocking controversy in semiarid Africa.
World Anim. Rev. 87:4 -27.
Bester, F.V. 1995. Drought and rangeland management. p. 91 -104. In: R. Moorsom, J.
Franz and M. Mupotola (eds.) Coping with aridity: drought impacts and preparedness in Namibia. Brandes and Apsel /NEPRU, Frankfurt, Germany.
Bryant, F.C., B.E. Dahl, R.D. Pettit, and C.M. Britton. 1989. Does short duration grazing work in arid and semi -arid regions ? J. Soil Water Cons. 44:290 -296.
Danckwerts, J.E. 1993. Reserve carbon and photosynthesis: their role in regrowth of Themeda triandra Forsk., a widely distrib- uted subtropical graminaceous species.
Funct. Ecol. 7:634 -641.
Danckwerts, J.E. and G.C. Stuart -Hill. 1987.
Adaptation of a decreaser and an increaser grass species to defoliation in semi -arid grassveld. J. Grassi. Soc. So. Afr. 5:218 -222.
Davis, J.C. 1986. Statistics and data analysis in geology. 2nd ed. Wiley, New York, N.Y.
Dean, W.R.J. and I.A.W. MacDonald. 1994.
Historical changes in stocking rates of
domestic livestock as a measure of semi -arid and arid rangeland degradation in the Cape Province, South Africa. J. Arid Environs.
26:281 -298.
Denny, R.P. and J.H.S. Steyn. 1978. A com- parison of continuous and rotational grazing on open granite sandveld. Ann. Rep. of the Dept. of Agr. Harare, Zimbabwe.
Ellis, J.E. and D.M. Swift. 1988. Stability of African pastoral ecosystems: alternate para- digms and implications for development. J.
Range Manage. 41:450 -459.
Evenari, M., L. Shanan, and N. Tadmor.
1982. The Negev: the challenge of a desert.
Harvard Univ. Press, Cambridge, Mass.
Hill, M.O. and Gauch, H.G. 1980. Detrended correspondence analysis, an improved ordi- nation technique. Vegetatio 42:47 -58.
Hoffman, M.T. 1997. Human impacts on veg- etation. pp. 507 -534. In: R.M. Cowling, D.M. Richardson and S.M. Pierce (eds.).
Vegetation of southern Africa. Cambridge Univ. Press, Cambridge, England
James, C.D., J. Landsberg, and S.R. Morton.
1999. Provision of watering points in the Australian and zone: a review of effects on biota. J. Arid Environs. 41:87 -121.
Jarman, N.G. and O.J.H. Bosch. 1973. The identification and mapping of extensive sec- ondary invasive and degraded ecological types (test site D). pp. 77 -80. In: O.G. Malan (ed.). To assess the value of satellite imagery in resource evaluation on a national scale.
CSIR, Pretoria, So. Africa.
Mainguet, M. 1991. Desertification: natural background and human mismanagement.
Springer Verlag, Berlin, Germany
McAuliffe, J.R. 1990. A rapid survey method for the estimation of density and cover in desert plant communities. J. Veg. Sci.
1:653 -656.
Meissner, H.H., H.S. Hofmeyr, W.J.J. Van
Rensburg, and J.P. Pienaar. 1983.
Classification of livestock for realistic pre- diction of substitution values in terms of a biologically defined large stock unit. Tech.
Comm. 175. Dept. of Agr., Pretoria, So.
Africa.
Middleton, N.J. and D.S.G. Thomas. 1997.
World atlas of desertification. 2nd ed. Edward Arnold, London, England.
Milchunas, D.G., W.K. Lauenroth, P.L Chapman, and K. Kazempour. 1989.
Effects of grazing, topography, and precipita- tion on the structure of a semi -arid grassland.
Vegetatio 80:11 -23.
Mueller - Dombois, D. and H. Ellenberg.
1974. Aims and methods of vegetation ecolo- gy. Wiley, New York, N.Y.
O'Connor, T.G. 1985. A synthesis of field experiments concerning the grass layer in the savanna regions of southern Africa. South African Nat. Sci. Program. Rep. 114. CSIR, Pretoria, So. Africa.
Parsons, D.A.B., C.M. Shackleton, and R.J.
Scholes. 1997. Changes in herbaceous layer condition under contrasting land use systems in the semi -arid lowveld, So. Africa. J. Arid Environs. 37:319 -329.
Quan, J., D. Barton, and C. Conroy. 1994. A preliminary assessment of the economic impact of desertification in Namibia. Dept. of Environ. Affairs Res. Discussion Pap. No. 3, Windhoek, Namibia.
Rowland, T. 1974. The conservation ideal. The SARCCUS record for the period 1952 -1970.
So. African Regional Commission for the Cons. and Utiliz. of the Soil.
Savory, A. and S.D. Parsons. 1973. The Savory grazing method. Rangelands
2:234 -237.
Schlesinger, W., J.F. Reynolds, G.L Cunningham, L.F. Huenneke, W.M.
Jarrell, R.A. Virginia, and W.G.
Whitford. 1990. Biological feedbacks in global desertification. Sci. 247:1043 -1048.
Scoones, I. 1995. Contrasting savanna dynam- ics: implications for livestock populations in Zimbabwe's dryland communal areas. p.
353 -360. In: G.F. Campbell (ed.).
Sustainable land management in semi -arid and subhumid regions. Proceed. of the SCOPE workshop, Dakar, Senegal. CIRAD, Montpellier, France.
Sharon, D. 1972. The spottiness of rainfall in a desert area. J. Hydrol. 17:161 -175.
Sharon, D. 1981. The distribution in space of local rainfall in the Namib Desert. J.
Climatol. 1:69 -75.
Sinclair, A.R.E. and J.M. Fryxell. 1985. The Sahel of Africa: ecology of a disaster. Can. J.
Zool. 63:987 -994.
Sullivan, S. 1996. Towards a non - equilibrium ecology: perspectives from an arid land. J.
Biogeogr. 23:1 -5.
Tapson, D.R. 1993. Biological sustainability in pastoral systems: The kwaZulu case. pp.
118 -135. In: R.H. Behnke, I. Scoones and C.
Kerven (eds.) Range ecology at disequilibri- um. New models of natural variability and pastoral adaptation in African savannas.
ODI /IIED /Commonwealth Secretariat, London, England.
Van der Heyden, F. and W.D. Stock. 1995.
Non structural carbohydrate allocation fol- lowing different frequencies of simulation
browsing in three semi -arid shrubs.
Oecologia 102:238 -245.
Van der Merwe, J.H. (ed.). 1983. National atlas of South West Africa. National Book Printers, Cape Town, So. Africa.
Van Schalkwyk, L.P. 1978. Veld evaluation and feed intake: studies of cattle on natural grazing. PhD thesis. Univ. of the Orange Free State, Bloemfontein, So. Africa. 288 pp.
[In Afrikaans].
Venter, J., B. Liggitt, N.M. Tainton, and G.P.M. Clarke. 1989. The influence of dif- ferent land use practices on soil erosion, herbage production, and grass species rich- ness and diversity. J. Grassl. Soc. So. Afr.
6:89 -98.
Walter, H. 1939. Grassland, Savanne und Busch der ariden Teile Afrikas in ihrer ökol- ogischen Bedingtheit. J. wissensch. Bot.
87:750 -860.
Ward, D. and B.T. Ngairorue. 2000. Are Namibia's grasslands desertifying? J. Range Manage. 53:138 -144.
Ward, D. and L. Olsvig- Whittaker. 1993.
Plant species diversity at the junction of two desert biogeographic zones. Biodivers. Lett.
1:172 -185.
Ward, D., L. Olsvig- Whittaker and M.J.
Lawes. 1993. Vegetation- environment rela- tionships in a Negev desert erosion cirque. J.
Veg. Sci. 4:83 -94.
Ward, D., B.T. Ngairorue, A. Apollus, and J.
Kathena. 2000a. Perceptions and realities of land degradation in arid Otjimbingwe,
Namibia. J. Arid Environs. 45: 337 -356.
Ward, D., B.T. Ngairorue, J. Karamata, and I. Kapofi. 2000b. The effects of communal and commercial pastoralism on vegetation and soils in an arid and a semi -arid region of Namibia. pp. 344 -347. In: P.S. White, L.
Mucina, J. Leps, and E. Van der Maarel (eds.). Vegetation science in retrospect and perspective. Opulus Press, Uppsala, Sweden.
Ward, D., B.T. Ngairorue, J. Kathena, R.
Samuels, and Y. Ofran. 1998. Land degra- dation is not a necessary outcome of commu- nal pastoralism in arid Namibia. J. Arid Environs. 40:357 -371.
Werner, W. 1994. Land tenure issues in Namibia: interactions with sustainable
resource management. p. 27-41. In: S. Wolters (ed.). Proceedings of Namibia's national work- shop to combat desertification. Desert Res.
Found. of Namibia, Windhoek, Namibia.
Wiegand, T. and S.J. Milton. 1996.
Vegetation change in semiarid communities:
simulating probabilities and time scales.
Vegetatio 125:169 -183.