METHOD DEVELOPMENT AND VALIDATION OF UV
SPECTROSCOPIC METHOD FOR THE DETERMINATION OF
LERCANIDIPINE
Dr. M. Sunitha Reddy*,Navya Sai.K, S. Muhammad Fazal Ul Haq
Department of Pharmaceutics, Centre for Pharmaceutical Sciences, Jntuh, Hyderabad,
Telangana, India.
ABSTRACT
Lercanidipine is a calcium channel antagonist used as antihypertensive
agent. A suitable spectroscopic method which is specific,accurate,and
precise, has been developed for the determination of lercanidipine.The
solvent used is methanol and λmax is found to be 239nm.The method
is highly sensitive and linearity is observed at 5ppm to
25ppm.Regression equation is found to be y = 0.03566 x + 0.00620.
The method is validated for various parameters like precision,
accuracy, robustness,detection and quantification limits. The results
shows that method is precise accurate, reproducible,simple,cheap and
less time cosuming. This method can be suitable for determination of
lercanidipine in bulk formulation.
KEY WORDS: lercanidipine, method development, spectroscopic method, validation.
INTRODUCTION
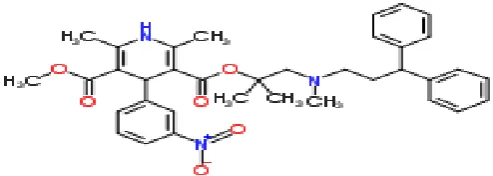
Lercanidipine is a calcium channel antagonist used as antihypertensive agent.chemically it is
3-{1-[(3,3-diphenylpropyl)(methyl)amino]-2-methylpropan-2-yl} 5-methyl
2,6-dimethyl-4-(3-nitrophenyl)-1,4-dihydropyridine-3,5-dicarboxylate . A few methods are available for
determination of lercanidipine in uv-spectroscopy.Present work shows method is precise
accurate and sensitive method for the determination of lercanidipine .The method is also
validated for various parameters.
Volume 4, Issue 10, 1341-1348. Research Article ISSN 2277– 7105
Article Received on 30 July 2015,
Revised on 22 Aug 2015, Accepted on 14 Sep 2015
*Correspondence for
Author
Dr. M. Sunitha Reddy
Department of
Pharmaceutics, Centre for
Pharmaceutical Sciences,
Jntuh, Hyderabad,
Figure 1: structure of lercanidipine
MATERIALS AND METHOD Instruments
Analytical balance
Uv-spectroscopy
Glass ware
Reagents and chemicals Lercanidipine
Methanol
Acetonitrile
Triple distilled water.
WAVELENGTH SELECTION
Different concentration of lercanidipine 5 to 25 ppm was prepared in methanol.They are
scanned under uv within 200-400nm wavelength range by using methanol as blank.The
absorption maxima from spectra was noted as 239nm.It is shown in fig.2.
PREPARATION OF STOCK SOLUTION
100mg of lercanidipine was dissolved in 100 ml of methanol in 100 ml vol.flask.The resultant
concentration is 1000ppm.
PREPARATION OF WORKING STANDARD
From the stock solution 1000ppm,10 ml was withdrawn and taken in 100ml vol.flask.Make it
PREPARATION OF SAMPLE AND CALIBRATION CURVE
From the working standard 5,10.15,20,25 ppm solutions were prepared by taking
0.5ml,1ml,1.5ml,2ml,2.5ml and made upto 10 ml with methanol.The absorbance of these
solutions were measured at λmax 239nm by using methanol as blank. Calibration curve was
shown in fig.3.
METHOD VALIDATION Accuracy
For determining accuracy of the proposed method, drug concentrations were prepared from
independent stock solution as 50%,100%,150% of the 20ppm concentration and analyzed .
Accuracy was assessed as %RSD.
Precision
Repeatability was determined by using different levels of drug concentrations (same
concentration levels taken in accuracy study i,e,. 20ppm), prepared from independent stock
solution and analyzed. Inter-day and intra-day variation and instrument variations were taken
to determine intermediate precision of the proposed methods. Different levels of drug
concentrations in triplicates were prepared three different times in a day and studied for
intra-day variation. Same protocol was followed for three different intra-days to study inter-intra-day
variation.
Linearity
The linearity is established for the proposed method. separate series of solutions of the drug
(5-25 μg/ ml in methanol medium) were prepared from the stock solutions and analyzed.
Least square regression analysis is done for the obtained data.
Detection limit and quantitation limit
Detection limit (DL) and quantitation limit (QL) for the developed method is determined by
using calibration curve standards. DL and QL were calculated as 3.3r/S and 10r/S,
respectively, where S is the slope of the calibration curve and r is the standard deviation of
y-intercept of regression equation.
Robustness
Robustness of the proposed method is determined by (a) changing the media (acetonitrile)
RESULTS AND DISCUSSIONS
After optimization methanol is selected as media which shows high sensitivity, less cost and
ease of preparation.calibration curve is shown in fig. It shows λmax of 239nm. Regression
equation is found to be Y=0.03566 X+0.00620 at 239 nm with regression coefficient
0.99976.
ANALYTICAL VALIDATION Accuracy
%Recovery values are excellent and has low standard deviation values.This shows that the
method is accurate.Mean percentage recoveries for the concentrations were found to be in the
range of 95.165% to 97.4% and the %RSD ranges from 0.000423 to 0.000665.This shows
that small change in concentrations of the sample can be accurately determined by this
method.
Presicion
Repetability results were seen under same conditions for a short time intervals and in
different days with laboratory variations.values are noted for 20 ppm.% RSD values were
within the acceptance range which shows that the method has repeatability and it is precise.
linearity
In methanol medium the linearity range was found to be 5–25 μg ml–1 at 239 nm. Lower
values of parameters like standard error of slope and intercept indicated high precision of the
proposed methods. The mean slope and intercept values are within confidence limits.
LOD AND LOQ
In methanol LOD and LOQ values were found to be 0.086618 and 0.2624 respectively.
Robustness
Variation in media by Acetonitrile and change in wavelength by ±3% do not show any
Figure 2 absorption spectrum of lercanidipine
Table 1: standard table for calibration curve.
s.no Concentration (ppm) Absorbance at 239nm
1 5 0.169
2 10 0.389
3 15 0.537
4 20 0.711
5 25 0.899
Table 1: different parameters and values
Parameter Values
Λmax 239nm
Beer’s law limit(ug/ml) 5-25
Regression equation(Y=mX+C) y = 0.03566 x + 0.00620
Slope(m) 0.03566
Intercept(c) 0.00620
Figure 3 calibration curve of lercanidipine
ACCURACY
Table 2: accuracy table. s.no Concentration
(ug/ml)
Mean
absorbance SD %RSD
Concentration
Obtained %recovery
1 30 1.049 0.000577 0.000551 29.233 97.44
2 40 1.364 0.000577 0.000423 38.066 95.165
3 50 1.736 0.001155 0.000665 48.508 97.016
PRECISION
Table 3: precision table.
s.no concentration Precision(day) absorbance±SD %RSD
1 20ppm Normal day 0.709±0.0 0
2 20ppm Intra day 0.697±0.001 0.143472 3 20ppm Inter day 0.74±0.000548 0.074054 Where n=3
DETECTION LIMIT AND QUANTIFICATION LIMIT Table 4: LOD AND LOQ.
s.no Values LOD LOQ
1 Slope 0.03566
0.086618 0.2624 2 Intercept 0.00620
ROBUSTNESS
Table 5: ROBUSTNESS.
s.no Parameter Concentration absorbance SD %RSD
1 Solvent change ACN+methanol 20ppm 0.747 0 0 2 Low wavelength (236nm) 20ppm 0.782 0.000447 0.057161
3 High wavelength
(242nm) 20ppm 0.667 0.000447 0.067016
CONCLUSION
The proposed method was simple ,precise, accurate reliable and sensitive.the method is
specific and is useful for determination of lercanidipine in pure samples and in formulations.
REFERENCES
1. G. Mubeen, Damanjit Singh Rao, Kadri Uvesh*Spectrophotometric Method for
Determination of Lercanidipine in Tablets, International Journal of ChemTech Research,
1(4): 1186-1188,
2. Amala mateti*, Manish Kumar Thimmaraju, N.Raghunandan, Development and
validation of a spectrophotometric method for determination of saquinavir in bulk drug
and pharmaceutical formulation. International Journal of Pharmacy and Pharmaceutical
Science Research., 2012; 36-41
3. Ramesh Jagadeesan* and M. Radhakrishnan, Development and Validation of RP-HPLC
Method for the Dissolution of Lercanidipine Hydrochloride in Tablet Dosage Form,
International Journal of Research in Pharmaceutical and Biomedical Sciences, Jul– Sep
2013; 4(3): 1014-1023
4. Ramesh jagadeesan*, M. radhakrishnan, development and validation of rp-hplc method
for the chromatographic purity of lercanidipine hydrochloride in tablet dosage form,
International Journal of Pharmacy and Pharmaceutical Sciences., 2013; 5(4): 0975-1491.
5. Priyadarshani S. Bansode*Development and Validation of Lercanidipine Hydrochloride
and Atenolol by Using RP-HPLC and UV Spectroscopy, Indian Journal of Pharmacy and
Pharmacology., September 2014; 1(1): 37-41.
6. Deepak Kumar Jain1 *, Pratibha Patel1 , Abu Sahma Khan2 , Nilesh Jain3, Development
and Validation of a RP-HPLC method for the simultaneous estimation of Atenolol and
Lercanidipine hydrochloride in Pharmaceutical dosage forms, International Journal of
7. a.v. ladke, anita m. ingle, pranjali s. ranaware, mrinalini c. damle*DEVELOPMENT AND
VALIDATION OF STABILITY INDICATING HPTLC METHOD FOR LERCANIDIPINE
HYDROCHLORIDE, June 2012; 2(5): 43-52
8. Kareem M. Younesa*, Ehab F. El Kadyb, A new validated bio-analytical liquid
chromatographic -tandem mass spectrometric method for the quantification of
Lercanidipine in human plasma, International Journal of Analytical and Bioanalytical
Chemistry., 2013; 3(4): 169-177.
9. Shrikant Chardea, Lajwinder Kumara & Ranendra Sahaa*Development and Validation of
High‐Performance Liquid Chromatographic Method for Estimation of Lercanidipine in