1 | P a g e
Enhanced methodologies for detecting phenotypic resistance in mycobacteria
Robert J H Hammond 1, Vincent Baron 1, Sam Lipworth 2, Stephen H. Gillespie 1
1 Medical and Biological Sciences Building, North Haugh,
University of St Andrews, St Andrews,
Fife, KY16 9TF, UK
2 University of Oxford,
Tropical Medicine and Global Health, Old Road Campus,
Roosevelt Drive, Oxford,
OX3 7FZ, UK
Summary
Lipid droplets microscopic organisms, found in in algae and other have become of interest to many researchers partially because they carry the capacity to produce bio-oil for the mass market. They are of importance in biology and clinical practice because their presence can be a phenotypic marker of an altered metabolism, including reversible resistance to antibiotics, prompting intense research
2 | P a g e
primary constituents are non-polar lipids such as triacylglycerols but bacterial cell membranes are primarily polar lipid species. In this chapter we describe an optimal method for using Nile red to distinguish lipid containing (Lipid rich or LR cells) from those without lipid bodies (Lipid Poor or LP). As part of the process we have optimised a method for separating LP and LR cells that does not require the use of an ultracentrifuge or complex
separation media. We believe that these methods will facilitate further research in these enigmatic, transient and important cell states.
1. Introduction
In recent years there has been an increasing interest in mycobacteria within which lipid bodies are seen[1-3]. This is due to the important association with low metabolic state and phenotypic resistance to key anti-tuberculosis antibiotics [4-7]. As the goal of improving tuberculosis treatment remains frustratingly out of reach, it is important that we understand what the true susceptibility of M. tuberculosis is as it is clear there is a significant difference in the susceptibility of cells with lipid bodies present in comparison with those that are not [8]. It is of considerable importance, therefore, to be able to reliably separate and quantify mycobacterial cells in different cells state. Previously published methods are effective but often complex and may result in metabolic alteration in the cells studied.
3 | P a g e
little is known about the effect of these processes on the metabolism of mycobacteria, which is often the purpose of the experiments. Sucrose separation gradients can provide a carbon source for mycobacteria that are not fastidious and can utilise almost all simple carbohydrate carbon sources including sucrose [20].
Isopycnic centrifugation refers to a method wherein a density gradient is either pre-formed or forms during high speed centrifugation[21]. After the gradient is formed particles move within the gradient to the position having a density matching their own [22]. To improve our capacity to study mycobacteria in different cell states we describe a simple isopycnic technique to separate lipid rich and lipid poor mycobacteria based on their density. Our methodology was based upon isopycnic centrifugation with or without a centrifugation step [23]. This technique can produce very pure “single state” mycobacteria at good yield for use in further experimentation.
Another advantage of the method is that a solution of D2O and pure water has no difficulties caused by evaporation. For other methods such as sucrose density centrifugation, a solution of sucrose and water will change its density if left uncovered overnight at room temperature due to the water evaporating off leaving comparatively more sucrose behind. Stability is another advantage as D2O is atomically and there will be no change in solutes from precipitation mid-experiment caused by a change in the density of the media.
Confirmation and quality checking of the lipid-state of separated sub-populations can be obtained by use of the Nile red staining technique above and we report a simple method that assists the quantification of the LR and LP fractions.
4 | P a g e
Nile red has been used for many years to visualise intracellular lipids. In this chapter we have adapted the methodology to provide a simple and reproducible technique to reliably visualise and quantify lipid bodies within mycobacterial cells. Importantly, the method can be adapted to flow cytometry. It is possible to further adapt our described Nile red staining
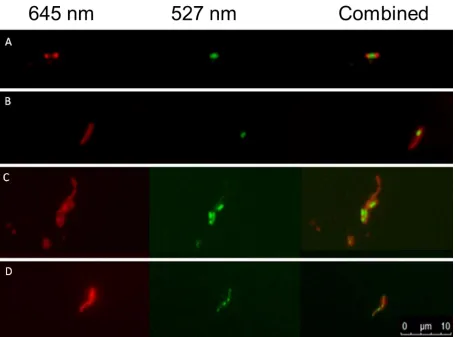
protocol to a high throughput screening method to allow for rapid quantification of the lipid body load in a particular sample. Figure 1 below demonstrates what a lipid rich cell from a few mycobacterial species looks like and how they were identified microscopically.
When the preparation is visualised at 527nm non-polar lipid fluoresce green. Polar lipid such as those found in the cell wall and membranes appear as bright red. This clear visual separation allows for easy counting so that the proportion of lipid rich (LR) and lipid poor (LP) cells can be quantified accurately. This property can also be used by flow cytometry to rapidly quantify LR and LP cells in a mycobacterial culture [8] from a single staining step. This obviates the need for two stains: an acid-alcohol method to identify the mycobacterium followed by destaining followed by Nile red staining to classify the lipid content.
2 Materials
All solutions should be made prior to beginning this procedure. Diligently follow all waste disposal regulations when disposing waste materials.
2.1 Buoyant density separation
1. Tubes –list all and the suppliers
2. Heavy water (Sigma Aldrich)
3. Centrifuge (Beckman Coulter J6-MI)
5 | P a g e
5. Micro-centrifuge tubes (Axygen)
6. Pipettes (Thermo Scientific, Finnpipette F2)
7. Glass Pasteur pipette (Thermo Scientific)
8. Parafilm (Bemis, Parafilm)
9. Large centrifuge tubes (Cellstar)
2.2 Nile red staining
1. Nile red stain: Nile red power (Sigma Aldrich) (see Note 1) 2. Clean microscope slides (Thermo Fisher)
3. DMSO (Sigma Aldrich) 4. Microscope (see Note 2) 5. Water bath
3. Method
3.1 Buoyant density separation (One g separation)
1. Take a 1mL aliquot of bacterial cells is harvested from culture
2. Washed three times by micro-centrifugation (20,000g for 3 minutes) with filter-sterilised water
3. R-suspend the washed cells in 200µL of filter sterilised dH2O
4. The full 200µL is aliquoted into an uncharged (or de-static) sterile plastic vessel (see Note 3)
5. Add 600µL of D2O to give final volume of 800µL. (D2O : dH2O; 3:1). (see Note 4 and 5) 6. Seal the D2O/dH2O solution and leave to equilibrate for 24 hours without agitation. 7. After 24 hours take 100µL of solution from within 1mm of the meniscus using a 200
µL pipette.
6 | P a g e
9. Remove the material from within 1mm of the bottom of the tube with a 200 µL pipette (see Note 6).
10. Remove 100µL from this layer and stored in a sterile Micro-centrifuge tube (see Note 7)
3.2 Micro-centrifuge (~200g) Separation (See Note 8)
1. Cells for centrifugation were prepared as described in above. 2. Take an anti-static micro-centrifuge tube is prepared.
3. Aliquot 1mL mixture of washed cells in a 3:1 D2O:H2O into the tube. 4. Seal the tube and centrifuge for 5 minutes at 200 g.
5. Take the fractions in same way as noted above in 3.1
3.3 High volume preparation (200g) separation (see Note 8)
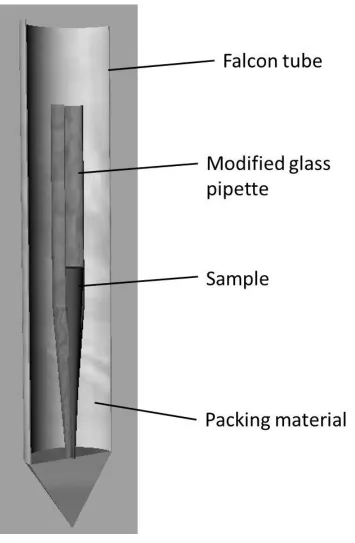
1. Take a standard short nosed glass pipette and heat in a Bunsen burner whilst gripping the end of the pipette tip with forceps.
2. When the glass of the pipette tip begins to soften twist the forceps are and pulled to sever the end of the pipette tip and seal it in one movement.
3. Use this sealed and shortened pipette as the separation vessel.
4. Prepare a 5mL solution of cells and 3:1 D2O:H2O is prepared as above and added to the sealed glass pipette.
5. Seal the pipette with parafilm at the opening and place into a 15mL centrifuge tube that has been padded with absorbent white tissue.
6. Ensure a good seal by adding more tissue paper around the pipette and above it before the cap of the large centrifuge tube is sealed.
7. Centrifuge the assembly at 200 g for 5 minutes.
7 | P a g e
1. Dissolve Nile red in DMSO (Sigma Aldrich) to a final concentration of 2mg/mL (see Note 9).
2. Nile red solution can be added directly into media containing cells at 1:10 ratio (final concentration of 100µg/mL)
3. The Nile red sample should be incubated at room temperature with constant agitation
for 20 minutes.
4. The sample is centrifuged for 3 minutes at 20,000g to pellet the cells.
5. The supernatant is removed and discarded and 200µL of 100% ethanol is added. Vortex to mix
6. The sample is centrifuged for 3 minutes at 20,000g and the supernatant discarded. 7. 100µL of PBS is added to the sample and vortexed for 1 minute.
8. The stained sample (10µL) can be applied to a clean glass slide and heat-fixed. 9. Bacterial preparations can be viewed by fluorescence microscopy (see Note10) or quantified by flow cytometry (see Note 11)
3.5 Staining cells in solid phase (see Note 12)
1. Nile red is prepared as above to 100µg/mL. 2. Sample bacterial cells using a sterile plastic loop 3. prepare a thin smear on a clean glass slide). 4. Heat fix the smear
5. Nile red bath is prepared with enough solution to flood the entire slide. 6. Place the prepared slide in a Nile red bath.
7. Bath and slide are incubated at room temperature for 30 minutes in the dark. 8. Remove the slide from bath and drain excess stain (see Note B)
9. Slide has excess stain drained from it onto absorbent towelling. 10. Slide is rinsed once with deionised water, 3 seconds.
11. Slide is rinsed with 70% ethanol, 5 seconds.
8 | P a g e 4. Notes
1. Nile red is a benzophenoxazone dye and is highly soluble in ethanol but is negligibly soluble in water which makes its use in biological situations difficult. This can be overcome by bathing the sample to be stained in a highly polar substance. This can damage or change to properties of the sample under investigation so is generally avoided. An alternative is to use DMSO (dimethysulphoxide) as the solvent for the dye. Nile red is readily soluble in DMSO and DMSO will aid in the carriage of Nile red across biological membranes.
2. Any fluorescent microscope fitted with a 100X oil emersion lens and a >8mega-pixel camera will suffice. The crucial elements that it must possess are filter cubes that fall within a fine range. We use Texas red and Bodipy FL cubes as these have a narrow spectral range, ±40nm of the stated wavelength.
3. This is achieved using an antistatic gun (Milty).
4. Deuterium oxide is a stable oxide of deuterium. Pure D2O has a specific gravity of 1.11 g/cm3. Pure water has a specific gravity of 1.00 g/cm3. This means that a solution of D
2O from 1% - 99% could have the range of specific gravities from 1.01 g/cm3 - 1.10 g/cm3. Previous work has shown that the density of lipid rich mycobacterial cells lies within this range (Lipworth, Gillespie, unpublished).
9 | P a g e
6. Take the sample with bubbling through the D2O/H2O mixture until the correct depth was reached to prevent cells from other layers entering the pipette tip and contaminating the separated material.
7 When separations failed to achieve sufficient purity by fluorescent microscopic evaluation (see figure 1) such samples can be subjected to a further round of buoyant density
separation.
8 For a micro-centrifuge tube the maximum safe volume of liquid to be used is 1200µL when centrifuging a sample. For a glass pipette, it is possible to use up to 5mL of liquid.
9. Stain can be reused for subsequent staining up to a maximum of 5 times if stored in the absence of light or if used with 1 week of preparation
10. For optimal clarity of separation we use an excitation frequencies of 480/40 and 540/40. We detect emission at 527/30, and 645/75. In our lab we use the Leica CTR 5500 DM
microscope.
11. Preparations can be quantified using flow cytometry. Cells stained by the method noted as above in liquid phase are loaded into flow cytometry vessel and processed as normal. Microscopic analysis of Nile red stained preparations is recommended to validate the results of flow cytometric analysis.
10 | P a g e References
1. Chen W, Zhang C, Song L, Sommerfeld M, Hu Q (2009) A high throughput Nile red method for quantitative measurement of neutral lipids in microalgae. J Microbiol Methods 77 (1):41-47. doi:10.1016/j.mimet.2009.01.001
2. Feng GD, Zhang F, Cheng LH, Xu XH, Zhang L, Chen HL (2013) Evaluation of FT-IR and Nile Red methods for microalgal lipid characterization and biomass composition determination. Bioresour Technol 128:107-112. doi:10.1016/j.biortech.2012.09.123
3. Greenspan P, Mayer EP, Fowler SD (1985) Nile red: a selective fluorescent stain for intracellular lipid droplets. J Cell Biol 100 (3):965-973
4. Parrish NM, Dick JD, Bishai WR (1998) Mechanisms of latency in Mycobacterium tuberculosis. In: Trends Microbiol, vol 6. vol 3. England, pp 107-112
5. Dutta NK, Karakousis PC (2014) Latent tuberculosis infection: myths, models, and molecular mechanisms. Microbiol Mol Biol Rev 78 (3):343-371. doi:10.1128/MMBR.00010-14
6. Deb C, Lee CM, Dubey VS, Daniel J, Abomoelak B, Sirakova TD, Pawar S, Rogers L, Kolattukudy PE (2009) A novel in vitro multiple-stress dormancy model for Mycobacterium tuberculosis generates a lipid-loaded, drug-tolerant, dormant pathogen. PLoS One 4 (6):e6077.
doi:10.1371/journal.pone.0006077
7. Baek SH, Li AH, Sassetti CM (2011) Metabolic regulation of mycobacterial growth and antibiotic sensitivity. PLoS Biol 9 (5):e1001065. doi:10.1371/journal.pbio.1001065
8. Hammond RJH, Baron VO, Oravcova K, Lipworth S, Gillespie SH (2015) Phenotypic resistance in mycobacteria: is it because I am old or fat that I resist you? Journal of antimicrobial chemotherapy. doi:10.1093/jac/dkv178
9. Schmidt WA (1919) Process and apparatus for separating finely-divided materials. Google Patents, 10. Holter H, Ottesen M, Weber R (1953) Separation of cytoplasmic particles by centrifugation in a density-gradient. Experientia 9 (9):346-348
11. Balentine R, Burford DD (1960) Differential density separation of cellular suspensions. Anal Biochem 1:263-268
12. Brakke MK, Daly JM (1965) Density-Gradient Centrifugation: Non-Ideal Sedimentation and the Interaction of Major and Minor Components. Science 148 (3668):387-389.
doi:10.1126/science.148.3668.387
13. Boogaerts MA, University Hospital (Hematology) Leuven B, Vercelotti G, University of Minnesota M, USA, Roelant C, University Hospital (Hematology) Leuven B, Malbrain S, University Hospital (Hematology) Leuven B, Verwilghen RL, University Hospital (Hematology) Leuven B, Jacob HS, University of Minnesota M, USA (1986) Platelets augment granulocyte aggregation and cytotoxicity: uncovering of their effects by improved cell separation techniques using Percoll gradients.
Scandinavian Journal of Haematology 37 (3):229-236. doi:10.1111/j.1600-0609.1986.tb02302.x 14. Kurnick JT, Department of Immunology UU, Uppsala, Sweden, ÖSTBERG L, Department of Immunology UU, Uppsala, Sweden, STEGAGNO M, Department of Immunology UU, Uppsala, Sweden, Kimura AK, Department of Immunology UU, Uppsala, Sweden, ÖRN A, Department of Immunology UU, Uppsala, Sweden, Sjöberg O, Department of Immunology UU, Uppsala, Sweden (1979) A Rapid Method for the Separation of Functional Lymphoid Cell Populations of Human and Animal Origin on PVP‐Silica (Percoll) Density Gradients. Scandinavian Journal of Immunology 10 (6):563-573. doi:10.1111/j.1365-3083.1979.tb01391.x
15. Makinoshima H, Nishimura A, Ishihama A (2002) Fractionation of Escherichia coli cell populations at different stages during growth transition to stationary phase. In: Mol Microbiol, vol 43. vol 2. England, pp 269-279
11 | P a g e
17. Sartain MJ, Dick DL, Rithner CD, Crick DC, Belisle JT (2011) Lipidomic analyses of Mycobacterium tuberculosis based on accurate mass measurements and the novel "Mtb LipidDB". J Lipid Res 52 (5):861-872. doi:10.1194/jlr.M010363
18. Daniel J, Maamar H, Deb C, Sirakova TD, Kolattukudy PE (2011) Mycobacterium tuberculosis uses host triacylglycerol to accumulate lipid droplets and acquires a dormancy-like phenotype in lipid-loaded macrophages. PLoS Pathog 7 (6):e1002093. doi:10.1371/journal.ppat.1002093
19. Martin NJ, Department of Microbiology WoSAC, Auchincruive, Ayr KA65HW, U.K., MACDONALD RM, Department of Soil Microbiology RES, Harpenden AL52JQ, U.K. (2015) Separation of Non‐ filamentous Micro‐organisms from Soil by Density Gradient Centrifugation in Percoll. Journal of Applied Bacteriology 51 (2):243-251. doi:10.1111/j.1365-2672.1981.tb01238.x
20. Tsukamura M, Tsukamura S (1965) [Grouping of mycobacteria by utilization of propylene glycol, glucose, fructose, and sucrose as sole carbon sources]. Nihon saikingaku zasshi Japanese journal of bacteriology 20:229-232
21. Vincent R, Nadeau D (1984) Adjustment of the osmolality of Percoll for the isopycnic separation of cells and cell organelles. Anal Biochem 141 (2):322-328
22. Arrowood MJ, Sterling CR (1987) Isolation of Cryptosporidium oocysts and sporozoites using discontinuous sucrose and isopycnic Percoll gradients. The Journal of parasitology 73 (2):314-319 23. Ishidate K, Creeger E, Zrike J, Deb S, Glauner B, MacAlister T, Rothfield L (1986) Isolation of differentiated membrane domains from Escherichia coli and Salmonella typhimurium, including a fraction containing attachment sites between the inner and outer membranes and the murein skeleton of the cell envelope. J Biol Chem 261 (1):428-443
24. LEIFSON E (1951) Staining, shape and arrangement of bacterial flagella. J Bacteriol 62 (4):377-389 25. Auty MAE, Gardiner GE, McBrearty SJ, O'Sullivan EO, Mulvihill DM, Collins JK, Fitzgerald GF, Stanton C, Ross RP (2001) Direct In Situ Viability Assessment of Bacteria in Probiotic Dairy Products Using Viability Staining in Conjunction with Confocal Scanning Laser Microscopy.
doi:10.1128/AEM.67.1.420-425.2001
26. Nicoletti I, Migliorati G, Pagliacci MC, Grignani F, Riccardi C (1991) A rapid and simple method for measuring thymocyte apoptosis by propidium iodide staining and flow cytometry. J Immunol
Methods 139 (2):271-279
27. Amann RI, Binder BJ, Olson RJ, Chisholm SW, Devereux R, Stahl DA (1990) Combination of 16S rRNA-targeted oligonucleotide probes with flow cytometry for analyzing mixed microbial
12 | P a g e
Figure 1 Left to right; Nile red fluorescence of polar lipids at 645 nm, Nile red fluorescence
of non-polar lipids at 527 nm, composite image lipid rich cells extracted from D2O
separation top layer. A; M. marinum, B; BCG, C; M. smegmatis, D; M. fortuitum. It can be
seen that in M. marinum the lipid body is single and large in the centre of the cell. In BCG
the lipid body (or bodies) is found at the polar end of the cell. M. smegmatis is similar to
M. marinum in that it will have large lipid bodies situated in the centre of the cell but M.
smegmatis regularly displays more than one lipid body. M. fortuitum is similar again to
BCG as it shows lipid bodies at the poles of the cells but much more commonly there will
13 | P a g e
Figure 2 Schematic diagram of the assembly used to centrifuge D2O and bacterial samples