1
Mapping Collaboration in Open Source Geospatial Ecosystem
Jianhua Shao
Horizon Doctorial Training Centre University of Nottingham
George Kuk
Nottingham University Business School University of Nottingham
Suchith Anand
Centre for Geospatial Science University of Nottingham
Jeremy G. Morley
Centre for Geospatial Science University of Nottingham Mike J. Jackson
Centre for Geospatial Science University of Nottingham
Tyler Mitchell
Open Source Geospatial Foundation
2 Abstract:
Over the last decade, there has been a tremendous growth and exploitation of open source geospatial software and technologies. A combination of factors is driving this momentum including the contributions made by hundreds of OSGeo developers and the leading role played by the Open Source Geospatial Foundation (OSGeo), aiming primarily to support and promote the collaborative development of open source geospatial technologies and data. This paper seeks to map out the social history of collaborative activities within the OSGeo ecosystem. We used the archival logs of developers’ contributions, specifically looking for boundary spanning activities where contributions crossed multiple projects. The analysis and visualization of these activities allow us to have a better understanding of the role of boundary spanning in the resourcing of each project, the incubation mechanism advocated by OSGeo, and the significance of the social interrelatedness among projects. The data consisted of the subversion (SVN) commit history made by individual developers in the programming code repository. We applied several network analytical and visualization techniques to explore the data. Our findings indicate that more than one in seven developers spanned multiple projects which potentially had the effects of shaping the projects’ directions, and increased knowledge flow and innovation. Also the OSGeo’s incubation mechanism provided an important encouragement for boundary spanning and increased knowledge sharing. By studying the social history of contributions, further tools can be developed in future to assist tracking of the social history, and make developers mindful of the significance of the interdependence among projects and hence continuously contribute to the healthiness of the OSGeo ecosystem.
3 1 Introduction:
Open source development attracts a great number of participants from various backgrounds. Participants perform different roles to push forward the development cycles including code developers, software testers, policy makers, and normal users (Mockus et al. 2000). They contribute to and influence development within open source communities, and themselves benefit by being involved in this ecosystem (Lerner and Tirole 2002). Open source geospatial communities are a large group showing rapid growth in the last decade (Steiniger and Bocher 2009). A more recent development among some communities is to have a formalised organisation to help assist projects developing under its umbrella. In the geospatial open source domain, this organisation is the Open Source Geospatial Foundation (OSGeo).
OSGeo1 is a non-profit, non-governmental organization whose mission is to support and promote the collaborative development of open geospatial technologies and data (Mitchell 2010). The foundation was formed in February 2006 to provide financial, organizational, and legal support to the broader free and open source geospatial community. It also serves as an independent legal entity to which community members can contribute code, funding and other resources, secure in the knowledge that their contributions will be maintained for public benefit. OSGeo provides a common forum and shared infrastructure for improvising cross-project collaboration.
OSGeo provides an umbrella organisation with multiple sub-projects applying to join (Mitchell 2010). It is different from other open source communities in terms of the governance structure and the use of incubation as a decision mechanism. The
4
decisions to sanction new projects are largely subject to an incubation mechanism, where OSGeo incubators have the responsibility of preparing and recommending newly joined projects to the OSGeo Board of Directors (Christl 2010). The incubators essentially review applications and appoint mentors for incubating projects. Yet there is no mandate that incubated projects have to work collaboratively with other existing OSGeo projects as each project can develop separately and in some instances, compete with others for developers. Although anecdotal evidence exists suggesting that interaction among projects is common, and that innovation and knowledge can be transferred and shared across OSGeo projects, it is not clear whether the interactions are largely restricted to the technical dependency among projects, for example, similar projects using the same library of codes. We know less about the social aspects of OSGeo ecosystem relative to the technical interrelatedness of projects (Sanz Salinas 2009).
5
that contribute to and crisscross multiple projects can increase the liquidity of knowledge flow and sharing, and collectively move innovation forward.
6 2 Data collection
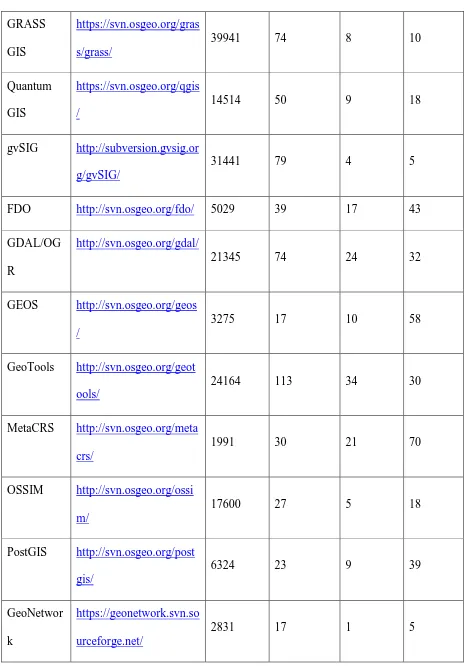
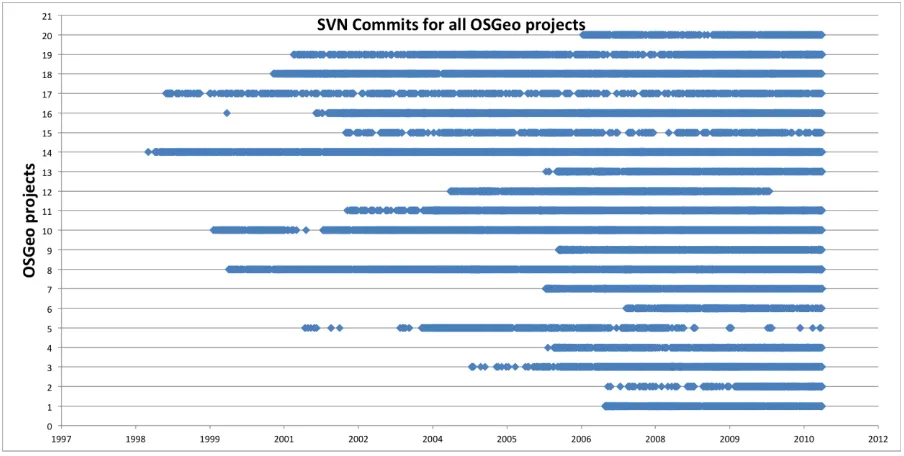
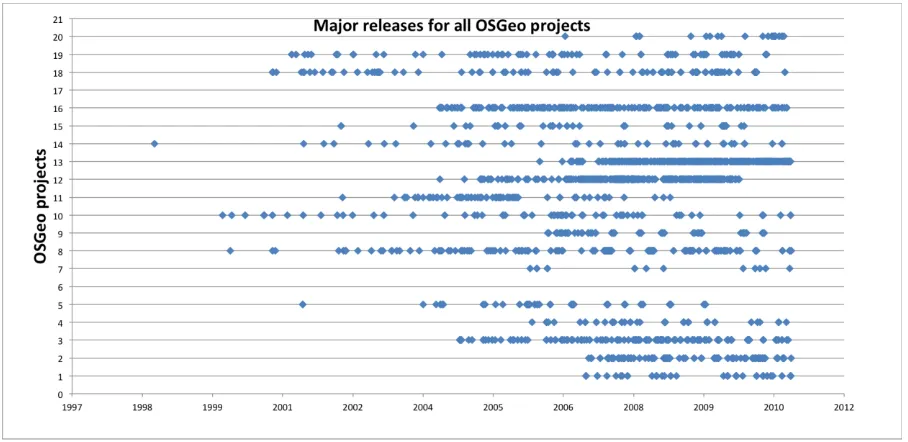
Due to the openness, open source participants leave rich digital footprints online, especially for those people who directly contribute to the source code of a project. For example, they make comments to reflect the change of code; they also identify the places that code could be improved; they can even discuss how the code may be used in practice (Kogut and Metiu 2001). This phenomenon also occurs in the OSGeo community. Our aim has been to collect data that reflects user activities when contributing to the development of software within OSGeo. Three publicly available data sources were identified for deriving contribution metrics: Subversion (SVN) code repository commits; mailing lists; and issue trackers (Gutwin, Penner et al. 2004). SVN commits are used to track individual and aggregate contributions of source code and are taken directly from a project's source code repository. Most projects in OSGeo use SVN to track and manage source code development, and it makes it easy to publicly fetch for analysis (see Table 1). The open source community also uses mailing lists to communicate with each other for a broad range of purposes. Each project has its own set of mailing lists and the whole OSGeo community has a general set of mailing lists for cross-project or organisational discussion. Issue trackers are another data source available to study the interaction between community members. People report, create and assign bugs, tasks and feature requests within communities, at various scales, from branches to project to community. Here we focus on SVN commits as our data source, as they are easiest to access and understand. Further research will consider the other two types of data sources.
7
Sowe et al. 2008). SVN is a software versioning and a revision control system (Collins-Sussman et al. 2004). Developers use SVN to maintain current and historical versions of files in projects, such as source code and documentation. SVN maintains versioning for file directories, source files, and file metadata. There are many other versioning control tools, like CVS (Cederqvist and Pesch 1993) and Git (Torvalds and Hamano 2010), but SVN is, historically, the most popular (Hammond et al. 2011). The open source community has used SVN widely; nearly all OSGeo projects use SVN or provide an SVN mirror. A commit, in the context of SVN, refers to submitting the latest changes of the source code to the repository, making these changes part of the head version of the repository and then allowing them to be synchronised with other users. Therefore, people make commits when they make any change to the source code, and the changing records would reflect how that project's source code has developed. Thus it is a great source to analyse the process of collaborative coding in OSGeo.
8
release and new features. SVN uses a standard method for locating those three sources. It all starts with a root repository URL, and then follows with the resource name. Therefore, once we know one resource address, it is easy to figure out the other resource addresses. For example, the commit path for the PostGIS project’s trunk is http://svn.osgeo.org/postgis/trunk
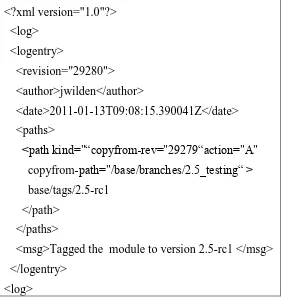
Each SVN commit message is well structured and we can retrieve it as a consistent rich data source. SVN Commits are stored internally within the repository but can be output in XML format using a command similar to the following:
svn log svn_path –v –xml > output_file_name
Each commit includes data such as: revision, author, date, path and message. Table 3 shows an example from the deegree project. Each commit is a logentry message. Each logentry will show the unique revision ID within the project, it will also record who
made the change to the code and what time it happened. SVN commits also record what files have been changed and the actions, such as adding, deleting or modifying a file. Developers usually leave a meaningful, human-readable message for each change as well, which provides the opportunity to do further text mining in future research. All SVN commits data sources use this same format to host the message, regardless of whether it is trunk, tags or branches. The only differences are where those commits come from within the resource URL, and the msg tag which will have a different message. As with the message demonstrated below, we can easily understand that it is a commit from a tag by looking at the msg element.
9
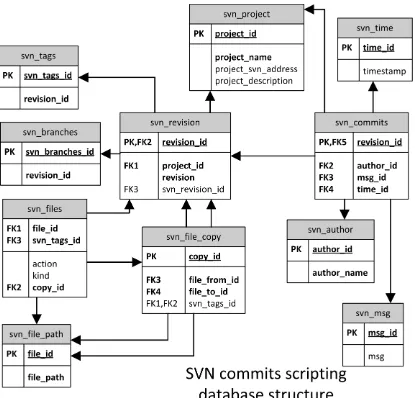
commits standard, we designed and implemented a database as shown in Figure 1. It was designed to be easy to add new commit logs and provide a quick query searching. This database is also easy to adapt when we study new data sources. The design is implemented using SQLite32 for its flexibility. The data collection server was written in the Python3 language and has been running and stable for more than three months from February 2011. At this stage of the project we only studied the mature projects that had already graduated from OSGeo Incubation. At the time of writing this paper, the database file had passed 300MB in size with more than 300,000 SVN commits records. These records were historic information from the SVN repositories of each OSGeo projects.
2
http://www.sqlite.org/
10 3 Data analysis
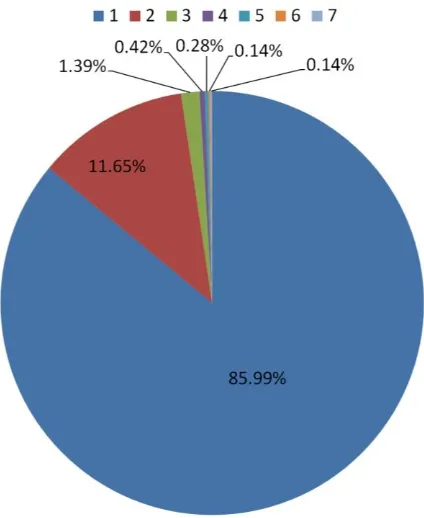
Through some basic analysis of the data, we found there are about 700 developers who have been actively contributing to the source code development and left their name on it. It is reasonable to expect that there are a much larger number of people who use the software but who do not contribute to the source code. More importantly, we find about 1 in 7 of the active developers contribute to 2 or more projects (see Figure 2). About 80% of the developers working on multiple projects only work on 2 projects. A small number of developers work on more than 5 projects. We even find one developer working for 7 different projects and who is also active in OSGeo community (see Figure 2). To study the social collaboration, we are interested in analysing those people who work on multiple projects. We describe the analysis process and results below from four successive angles: social network analysis; development effort overlap; boundary spanning; and the impact of OSGeo incubation.
3.1 Social Network Analysis
11
play a critical role in determining the way problems are solved, organisations are run, and the degree to which individuals succeed in achieving their goals. The small world phenomenon (Watts and Strogatz 1998) is the hypothesis we are interested in for this research, saying that the chain of social acquaintances required to connect one arbitrary person to another arbitrary person anywhere in the world is generally short. In this theory, the network comprises a number of cohesive groups or connected components. They are connected to each other via bridges or “short-cuts”.
12
social network relationship in OSGeo should naturally show diversity, but they all aim for the same target: to encourage the use and development of OSGeo software. These reasons have attracted us to study the social collaboration within OSGeo.
3.2 Development effort overlap
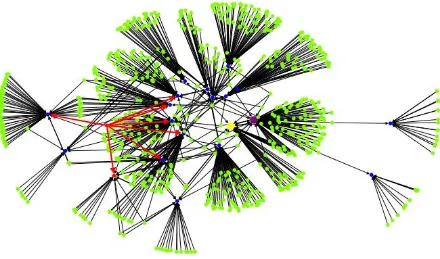
We can view the connection between projects by looking at the relationship of people to projects. People are definitely connecting to a project if they contributed to project source code development - they have to understand existing code before committing code. Therefore, individual users may also establish connections with each other if they contribute to the same part of the source code with operations like create, copy, delete, rewrite and modify. Based on this assumption, we created Figure 3 which is a diagram based on historic SVN commit data that represents the relationship of people to projects. Each green dot represents an individual developer and each blue dot means one individual project. The edge, or tie, bridging a green dot and a blue dot means the person has contributed to the project. This figure does not include any edge weights, but this is analysed in section 3.3 with weights calculated from how much contribution a person has made to a project.
13
on other projects and those developers connect different projects together. Those developers distribute their development time into different projects, and more importantly we find that they transfer knowledge and innovation between projects. For example, the GeoServer project is partly built based on the GeoTools project. There are a number of developers working on both projects. They would import libraries from GeoTools project into GeoServer projects, like data access, rendering and referencing. Meanwhile, those developers would also transform functional demands from GeoServer project into GeoTools project, like efficiency of data rendering, supporting for new data format.Because OSGeo is a big umbrella on top of a number of open source projects, it provides an opportunity for people to communicate and share new ideas and information, so it makes this kind of overlapping development effort more common compared to other open source communities, like the Linux Foundation4 and the Apache Foundation5. The Linux Foundation is a single-source open source community where most development efforts are around the Linux operating system. Even though there are several projects on going, it is still considered as a single project because those projects integrate with each other so much (Welsh 1994). Apache Foundation is the opposite, it also holds many projects, but those projects are loosely connected (Roberts et al. 2006). OSGeo’s operation lies in the middle. It has many projects, but those projects are not considered as components of a giant system, they are all excellent in their own application areas. Those projects are also not loosely connected, as they all address geospatial subjects. This unique phenomenon significantly encourages the communication between projects in the OSGeo community.
4http://www.linuxfoundation.org/
14
In addition, this network diagram (Figure 3) also illustrates a cohesion distance between the projects (represented as blue dots in the diagram). The cohesion distance is represented by the distance between the pairs of project dots. This distance is calculated based on Harel-Koren Fast Multiscale algorithm (Harel and Koren 2001) to present the interaction of development between projects. Projects in the middle of the diagram, which have more open connections to other projects, have a much shorter distance than individual, closed projects away from the middle of diagram. Openness here means how much connection it has to others, which could be project software dependencies and also participants’ involvement. The open projects normally also have more participants involved in development. OSGeo projects have dependencies between projects, for example the relationship between the GeoServer and GeoTools projects, and so we see much interaction between clustered projects. Yellow and purple dots in the diagram represent GeoTools and GeoServer project. The GeoServer project is heavily dependent on data access, rendering and referencing system libraries from GeoTools. GeoServer developers have a policy to contribute back to GeoTools whatever code has the potential to be shared with other projects. We can also view this relationship from the diagram. Their distance is very short and many developers connect both projects. This contributes greatly to boundary spanning which will be discussed more in sections 3.3.
15
for project-to-project connectivity. Those projects are closer to each other and they normally have more contributors. In turn, such short project distances would also increase the possibility of people becoming involved in different projects. Because those projects share similarities in development the developers should find it easier to apply their knowledge in a different project. The diagram also shows that people working on different projects are more commonly clustered in the middle of diagram, close to the projects with more open connectivity. The red arrows are an example to demonstrate that one person is committing to seven projects and is near to this central cluster. It is interesting to see in section 3.3 what value those people make by connecting different projects.
3.3 Boundary spanning
Boundary spanning describes the phenomena where people divide their time between different projects, linking the development between different projects across the “boundaries” of projects (Daft 2009). The linking could be information exchange, relationship building, and using “boundary objects” as a way to create shared meaning and trust across the boundary (Williams 2002). It has been studied several times as a topic in leadership (Yip et al. 2009). Here we have applied this for the first time to an open source community. From the literature, boundary spanning is concerned with the detection of information. It has two primary roles. One is to detect information and bring it into the organisation. The second is to send information into the environment, presenting the organisation in a favourable light.
16
experiencing, boundary spanning by contributing to multiple projects. Most of them have a primary project to work on, meaning that they will contribute most of their time to a single primary project. However, for many reasons, they spend part of their time on several other projects. Boundary spanners serve strategic roles in OSGeo projects by gathering critical information, obtaining feedback and perception from the external environment through their networks and then interpreting and translating that information back into their primary projects. For example, some boundary spanners in GeoServer projects would bring feedback and expectation back to their primary
project, GeoTools, to support the development of the additional library functions necessary for GeoServer. Ultimately, if the boundary spanner is effective, the process can lead to innovation in strategy, processes or products (Ansett 2005). We summarise the key activities of the boundary spanner in OSGeo as:
1. Creating internal and external networks for open source projects, 2. Acting as the identifier for solution development,
3. Translating the knowledge back into the project culture,
4. Influencing and educating internal and external users of projects.
17
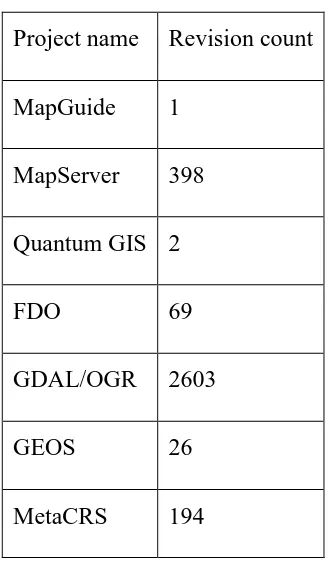
motivation, helping to enumerate a developer's contribution to innovation and knowledge transformation across projects. In practice, boundary spanning would be evaluated indirectly over time. Studying OSGeo's boundary spanning can help us understand the open source development organisation and stimulation. Table 3 and Figure 4 demonstrate the metrics for one boundary spanning developer who has been working on 7 projects. From the statistics, we can see his primary project is GDAL, but he also spends significant effort on MapServer and other projects. GDAL (Geospatial Data Abstraction Library) is an access and translation library for geospatial data formats. MapServer supports rendering maps from various data sources, using, in particular, the GDAL library. Similar to other projects, this person boundary spans different projects to transform the knowledge and innovation among them, thereby reducing development costs and increasing the development speed and code reuse across projects.
3.4 Incubation
18
commercial entity, for example MapGuide Open Source where Autodesk changed the development and governance structures so the code was opened to the broader community. To become a successfully incubated project, the project team should manage themselves, striving for consensus and encouraging participation from all contributors, from beginning users to advanced developers. Contributors are the scarce resource. OSGeo counts successful incubated projects and encourage those projects to share their contributors Projects are also encouraged to adopt open standards and collaborate with other OSGeo projects; they are responsible for reviewing and controlling their code bases to ensure the integrity of the open source baselines.
19
20 4 Limitations & Future work
The aim of this project is to study the social collaboration of the OSGeo community. Even though this paper only introduces the project and the initial work being carried out, further research activities have been planned and more activities will be introduced as data collection and analysis improve. At present, we only collect SVN commits as a starting point to study the social collaboration in development. SVN commits records the history of project code evaluation. Yet SVN commits cannot help us measure the project delivery in a more precise way. There are three reasons for this.
1. Because, in practice, the SVN commits do not necessarily identify real people. We can only find the SVN commits’ user names but this is not a match to a real name and we cannot guarantee that multiple users don’t share the same account. SVN commit accounts are not open to all people who want to contribute to the codes. Therefore, we are missing some people who may want to contribute but are not recorded in the central repository.
21
22 5 Conclusions
23 Acknowledgements
24 References
Ansett, S. 2005. Boundary spanner: The gatekeeper of innovation in partnerships. Barnes, J. A. 1954. "Class and committees in a Norwegian island parish." Human relations 7(1): 39.
Barthes, R. and L. Duisit 1975. "An introduction to the structural analysis of narrative." New Literary History 6(2): 237-272.
Cederqvist, P. and R. Pesch 1993. "Version management with CVS." Signum Support AB.
Christi, A. 2010. "The State of OSGeo and the global SDI."
Collins-Sussman, B., B. W. Fitzpatrick, et al. 2004. Version control with subversion, O'Reilly Media, Inc.
Daft, R. L. 2009. Organization theory and design, South-Western Pub. Granovetter, M. S. 1973. The strength of weak ties. The American journal of sociology 78(6): 1360-1380.
Gutwin, C., R. Penner, et al. 2004. Group awareness in distributed software development, ACM.
Hammond, J. S., M. Gilpin, et al. 2011. "The State Of Application Development In Enterprises And SMBs."
Harel, D. and Y. Koren 2001. A Fast Multi-scale Method for Drawing Large Graphs. Proceedings of the 8th International Symposium on Graph Drawing, Springer-Verlag: 183-196.
Kogut, B. and A. Metiu 2001. Open Source Software Development and Distributed Innovation. Oxford Review of Economic Policy 17(2): 248.
Kuk, G., 2010, Eyeballs, bugs, and releases in open source software, at European Conference on Information Systems, South Africa, June.
Lerner, J. and J. Tirole 2002. Some simple economics of open source. The journal of industrial economics 50(2): 197-234.
Lopez-Fernandez, L., G. Robles, et al. 2004. Applying social network analysis to the information in cvs repositories, Citeseer.
Mitchell, T. 2010. 2009 Annual Report-All Reports. OSGeo Journal 7(1): 28. Meneely, A. and Williams, L. 2009. Secure open source collaboration: An empirical study of Linus' law. Paper accepted at the 16th ACM Conference on Computer and Communications Security, Chicago, November.
http://www4.ncsu.edu/~apmeneel/ccs221-meneely.pdf
25
Müller-Prothmann, T. (2006). "Leveraging knowledge communication for
innovation." Framework, Methods and Applications of Social Network Analysis in Research and Development. Frankfurt a. M. et al.: Peter Lang.
Perera, D., J. Kay, et al. "Mining learners’ traces from an online collaboration tool." Educational Data Mining: 60.
Roberts, J. A., I. Hann, et al. (2006). "Understanding the motivations, participation, and performance of open source software developers: A longitudinal study of the apache projects." Management Science 52(7): 984.
Sanz Salinas 2009 Panorama of the ecosystem of Open Source GIS. Available at https://confluence.prodevelop.es/display/pan/Panorama+del+ecosistema+de+Software +Libre+para+SIG+-+completo
Scott, J. (2000). "Social network analysis."
Sowe, S. K., I. Samoladas, et al. (2008). Are FLOSS developers committing to CVS/SVN as much as they are talking in mailing lists? Challenges for Integrating data from Multiple Repositories.
Steiniger, S. and E. Bocher (2009). "An overview on current free and open source desktop GIS developments." International Journal of Geographical Information Science 23(10): 1345-1370.
Torvalds, L. and J. Hamano (2010). "GIT-fast version control system." URL http://git-scm. com.
Watts, D. and S. Strogatz (1998). "Small world." Nature 393: 440-442. Welsh, M. (1994). "Cooking with Linux: Linux Leadership." Linux Journal 1994(2es): 13.
Williams, P. (2002). "The competent boundary spanner." Public Administration 80(1): 103-124.
26 List of Tables
Project SVN URL Commits Developers Developer
s on multi- projects
Boundary spanning rate % deegree https://svn.wald.intevatio
n.org/svn/deegree/
9624 26 1 3
geomajas https://svn.geomajas.org/ majas/
6915 16 3 18
GeoServer http://svn.codehaus.org/g eoserver/
12103 58 29 50
MapBender https://svn.osgeo.org/ma pbender/
7723 38 3 7
MapBuilder http://svn.codehaus.org/ mapbuilder/
3111 30 10 33
MapFish http://www.mapfish.org/s vn/mapfish/
3758 31 14 45
MapGuide https://svn.osgeo.org/ma pguide/
5072 59 18 30
MapServer http://svn.osgeo.org/map server/
11089 53 18 33
27 GRASS
GIS
https://svn.osgeo.org/gras
s/grass/
39941 74 8 10
Quantum GIS
https://svn.osgeo.org/qgis
/
14514 50 9 18
gvSIG http://subversion.gvsig.or g/gvSIG/
31441 79 4 5
FDO http://svn.osgeo.org/fdo/ 5029 39 17 43
GDAL/OG R
http://svn.osgeo.org/gdal/
21345 74 24 32
GEOS http://svn.osgeo.org/geos /
3275 17 10 58
GeoTools http://svn.osgeo.org/geot ools/
24164 113 34 30
MetaCRS http://svn.osgeo.org/meta crs/
1991 30 21 70
OSSIM http://svn.osgeo.org/ossi m/
17600 27 5 18
PostGIS http://svn.osgeo.org/post gis/
6324 23 9 39
GeoNetwor k
https://geonetwork.svn.so
urceforge.net/
[image:27.595.83.548.61.727.2]2831 17 1 5
28 <?xml version="1.0"?> <log>
<logentry>
<revision="29280"> <author>jwilden</author>
<date>2011-01-13T09:08:15.390041Z</date> <paths>
<path kind="“copyfrom-rev="29279“action="A" copyfrom-path="/base/branches/2.5_testing“ > base/tags/2.5-rc1
</path> </paths>
<msg>Tagged the module to version 2.5-rc1 </msg> </logentry>
[image:28.595.158.439.202.499.2]<log>
29
Project name Revision count MapGuide 1
MapServer 398 Quantum GIS 2
FDO 69
GDAL/OGR 2603
GEOS 26
[image:29.595.216.380.228.512.2]MetaCRS 194
30 List of figures
31
32
[image:32.595.96.536.108.367.2]33
Figure 4: Boundary spanning diagram for a person who contributes on 7 OSGeo projects.
[image:33.595.89.541.402.630.2]34