
Characterization of Rust Layers on Weathering Steels Air Exposed for a Long Period*
8
0
0
Full text
(2) Characterization of Rust Layers on Weathering Steels Air-Exposed for a Long Period. 2819. Table 1 Chemical compositions of steels. Steel A B C D E. Chemical composition (mass%). Steel type SM50 SMA50AW SMA50AW P–Cu–Cr–Ni P–Cu. C. Si. Mn. P. S. Cu. Cr. Ni. Nb. Ti. V. 0.17 0.12 0.11 0.06 0.06. 0.32 0.39 0.20 0.36 0.53. 1.39 0.90 0.68 1.26 1.42. 0.016 0.008 0.014 0.091 0.085. 0.012 0.006 0.010 0.006 0.004. — 0.36 0.30 0.34 0.32. — 0.61 0.51 0.35 —. — 0.22 0.13 0.30 —. — 0.014 — — 0.02. — — — 0.015 0.02. — — — 0.05 —. Table 2 Environments of the exposure sites. Site No. 08 19. Bridge. Exposure location. Oominezawa bridge Yokkaichi overhead bridge. Mikuni Pass, Gumma Pref. Rural region Yokkaichi, Industrial region. Deposition rate of Cl− , gNaCl·m−2 ·s−1. Concentration of sulfurous acid Gas, gSO3 ·m−2 ·s−1. Distance from coastline, km. 1.04 × 10⁻⁸. 1.16 × 10⁻⁹. 155.0. 9.49 × 10⁻⁸. 12.6 × 10⁻⁹. 1.6. in the form of NaCl. Similarly, the deposition of sulfur is expressed in the weight of SO3 . Steel coupons were placed horizontally on weathering test racks under bridges at respective sites. Accordingly, the measurements for the skyward face “A” were distinguished from those for the earthward face “B” because skyward faces can not be equal to the earthward faces from the environmental point of view. Notation of specimens was expressed by a combination of steel name, exposure site number, facing direction (all “horizontal” in this report), and specimen face (skyward or earthward). For example, A19HB corresponds to a specimen of “Steel A” exposed at Site “19”, with its face parallel to the ground (horizontal), “H”, and the earthward side face “B”. Rusts on skyward and earthward surfaces of specimens were examined by EPMA (JEOL JXA-8621MX) and XRD (Rigaku Rotaflex RU-200B with a rotary Cu target and monochromator of pyrolytic graphite; λ = 0.15148 nm for Cu Kα) without removing the rusts from the steels after the surfaces were just cleaned with water, but the loose components such as loose rust on surfaces were removed, which spalled off easily from the surface of the steels during handling and specimen preparation. XRD measurement was carried out by glancing angle incidence XRD method (α − 2θ method) where the X-ray incidence angle α was fixed to 10◦ . For EPMA measurements, a wave length dispersive X-ray spectrometer was used. The electron acceleration voltage was 20 kV and the incident electron beam current was 50 nA. Pentaerythritol (PET) crystal was used for measurements of P, S, Cl, K, Ca, Ti, Cr and Mn, thallium acid phthalate (TAP) crystal for Na, Mg, Al and Si, and lithium fluoride (LIF) crystal for Fe, Ni, Cu and Zn. Quantitative analysis was carried out by a standardless method with ZAF (atomic number, absorption, fluorescence) matrix correction using intensities of Kα lines of all the detected elements in rust layer except oxygen, and the data were normalized to 100%. Quantitative and ZAF correction softwares used in this experiment were XM-86PACWE and XM-86PACZAF, respectively, which were installed to the EPMA apparatus. A mean value of a set of data at different five positions on the same surface of a specimen was taken as an EPMA analysis re-. sult. Composition of the rust layer from the surface to about 1 µm deep was obtained by EPMA measurements from the surface. For compositions at deeper regions in the rust layer, the cross-section was also analyzed by EPMA. Cross-section of a specimen was obtained by embedding the specimen in resin followed by cutting it. The cross-section was finished by polishing with silicon carbide paper followed by diamond paste polishing. Thickness of rust layer was estimated from the cross-section images of the rust layer observed by SEM. The elemental distribution in the cross-section was also quantitatively measured by EPMA. Two-dimensional distribution of major elements for a region of 200 µm or 250 µm square was first measured by mapping method, and the data was converted to depth profiles by summing up all the counts parallel to the steel surface. For quantitative estimation of the mapping data, the background was subtracted. The EPMA measurements were done at the position where the thickness of rust layer was largest or the most corroded region within the cross-section of 3 cm. Rust constituents in the rust layer were determined by TEM and electron diffraction (ED) for the plain carbon steel specimens (A19H-A and A19HB) and weathering steel specimens (E19H-A, E19H-B) exposure to air in Yokkaichi. The proportion and distribution of α-FeOOH, β-FeOOH, γ -FeOOH, magnetite, and amorphous rust were estimated from TEM observation. Here, amorphous rust was judged from electron diffraction pattern. TEM specimen were prepared by ion-milling of the thinly sliced crosssection of rust layer. Observation was done at the thin portion around a hole where the electron beam can pass through. By controlling the size of a hole, it was possible to observe the whole range of the rust layer from the surface to the interface between the rust layer and the steel. Observation was done at 20–30 points for each specimen. 3. Results and Discussion 3.1 XRD and EPMA results of rust layer surfaces There is no clear difference between the XRD pattern of rust layers formed on a plain carbon steel and those on weath-.
(3) 2820. K. Asami and M. Kikuchi. ering steels. However, there was clear difference between the XRD patterns of the skyward surfaces and those of earthward surfaces. The averaged XRD patterns of the skyward surfaces of all the specimens and that of earthward surface of all specimens are compared in Fig. 1, where XRD patterns of the standard substances, α-FeOOH and β-FeOOH are also plotted. In Fig. 1, the differential diffraction pattern between the skyward and earthward surfaces is also shown. The main difference in XRD pattern between the skyward and earthward surfaces appeared between 2θ = 30◦ and 40◦ where the patterns obtained from earthward surfaces had two strong peaks while the rust layer on skyward surfaces had only one strong peak. As can be seen clearly in the figure, the main constituent is α-FeOOH in both the skyward and earthward surfaces, and, in addition, β-FeOOH and γ -FeOOH also exist although the pattern of the standard γ -FeOOH XRD pattern is not shown here. There is apparent difference between the XRD patterns of skyward and earthward surfaces. By comparing with the standard XRD patterns, it can be understood that the differential pattern between the skyward and earthward surfaces correspond to β-FeOOH, that is, all specimens contain much β-FeOOH on the skyward surfaces. It can be said that the concentration of β-FeOOH was especially high on all the specimens irrespective of steel composition. The same results were obtained for specimens exposed at Site 08, Mikuni Pass. Magnetite was not detected on both surfaces. Because the incident angle of the X-ray was fixed to 10◦ , the depth of the rust layer where diffraction signal comes from is limited to ca. 1.2 µm under the assumption of a completely flat surface.9) The sampling depth by XRD will be much less than the total rust layer thickness although there is remarkable unevenness in the sample surface. The results shown in Fig. 1 are, therefore, the results of the rust layer in the range of 2–3 µm from the top surface at maximum. It can be said that the results are just for the surface region of the rust layer. It means these results does not deny the existence of magnetite underneath. The rust layer in deeper region should be containing different species from those in the surface region. Fig. 1 X-ray diffraction pattern of the skyward and earthward of rusted specimens exposed at Yokkaichi (Site 19) and their difference together with standard patterns of α-FeOOH and β-FeOOH.. observed by XRD. The average concentrations of main elements detected by EPMA on the surface regions of the rust layer are shown in Figs. 2(a) and (b) for specimens exposed at Site 08 (Mikuni Pass) and Site 19 (Yokkaichi), respectively. The concentrations in Fig. 2 are those normalized to 100 at% for all the elements detected except oxygen, and they are also averaged for all steels. At Mikuni Passs (Site 08), Cl and Ca are remarkably concentrated on skyward surface in comparison to the earthward surface, suggesting they are coming down as big drops rather than aerosol. If chloride ion had come as aerosol, it should have deposited on both side equally. The concentration of Na is very low in comparison with Cl while that of Ca is comparable to Cl at Site 08 indicating the origin of Cl is calcium chloride rather than NaCl. It is well known that calcium chloride is used for melting snow on road during winter. Actually, there is a large amount of snow fall in the region of Site 08 during winter. Probably, data shown in Table 2 did not take the chloride sprayed on road during winter into the Cl− deposit measurement. On the other hand, the data at Yokkaichi (Site 19) shown in Fig. 2(b), concentration of Na is almost equal to that of Cl indicating its origin is NaCl. Actually, the distance from the ocean to Site 19 is only 1.6 km as shown in Table 2. Moreover, NaCl should be very fine particles or aerosol because both Na and Cl appear almost equally on both the earthward and skyward surfaces.. Fig. 2 EPMA results of the rusts on the skyward and earthward surfaces of steels exposed at (a) Mikuni Pass (Site 08) and (b) Yokkaichi (Site 19) for 17 years..
(4) Characterization of Rust Layers on Weathering Steels Air-Exposed for a Long Period. Concentrations of S on specimens exposed at Site 19 are about 4–5 fold of that at Site 08. It is reasonable because the SO3 concentration in air at Site 19 is very high as shown in Table 2. However, the concentration of S measured on specimens at Site 08 is also high in comparison with the SO3 concentration in air as shown in Table 2. The concentration of S at Site 08 can not be realized from the SO3 concentration in air. Its origin is, therefore, unable to be attributed to SO3 gas in air. It can be derived from MnS in steels since concentrations of Mn and S are approximately equal on specimens exposed at Site 08. Nickel and chromium were found only on steels which contain them as alloying elements. On specimens exposed at Site 08, Cu was detected only on few specimens. On the other hand, on all the Cu-containing specimens exposed at Site 19, Cu was detected. 3.2 Observation of cross section of rust layers An example of SEM image of cross section of specimen is shown in Fig. 3. It can be seen that corrosion proceeds deeply in part but it does not develop at another place, and accordingly the thickness of rust layer is also changing with places. The rust layer thickness appeared in Fig. 3 does not correspond to real corrosion depth because the loose rust layer on surfaces had been removed when cross section was prepared. The average corrosion rate of a plain carbon steel (Steel A) at the coastal industrial region was 4.2 × 10⁻¹³ m·s−1 , and that of a weathering steel (Steel B) was 3.0 × 10⁻¹³ m·s−1 , and those values at Site 08 were reported as 1.3 × 10⁻¹³ m·s−1 and 0.93 × 10⁻¹³ m·s−1 , respectively.10) The ratio of corrosion rates of Steel A to Steel B can be calculated as about 1.4 at both the coastal industrial region and the rural mountainous region. The maximum thickness of the rust layer of Steel A at the rural mountainous region is 165 µm, and 115 µm for Steel B; that is, thickness ratio is 1.44, which is almost equal to the ratio of the corrosion rates. At the coastal industrial region, the thickness of the rust layer on Steel A is 142 µm, and that on Steel B is 150 µm. It results in the ratio of rust layer thickness 0.95, indicating that the rust layer on Steel A (a plain carbon steel) easily spalled off from the surface, and the measured thickness of the rust layer on Steel A appeared thin whereas that on Steel B did not exfoliated because of high adhesiveness.. 2821. converted to quantitative depth profiles. For conversion from mapping data into depth profiles, background counts were removed. By removal of background counts, the accuracy of the quantitative measurements was markedly improved. The results are shown in Figs. 4–7. In general, a rust layer consists of inner and outer layers, and Si, Cu and Cr distribute in the inner layer. On the other hand, P and Ni are uniformly distributed over the whole layer although they are slightly more in the inner layer. Manganese is more in the outer layer. On the skyward rust layer of Steel A (a plain carbon steel), Cl and S distribute mainly in the outer layer, and Na in the inner layer, but it is not clear on the earthward rust layer. On the weathering steel specimen D19H, Cl and Na situate in the outer layer; Na especially is in the outer layer, but S does not show a clear deviation of distribution. Figures 4–7 show results at the coastal industrial region, Yokkaichi. It is essentially the same when exposed at the Mikuni Pass, a rural mountainous region. Moreover, almost the same results were obtained for the other steels shown in Table 1. The structure of rust layer is typically shown in Fig. 8 based on the above observation and the analysis of the rust layer surface. In Fig. 8, the distribution of the detected elements except Fe, O, Ni and P is shown. It is well known that Ni and P are important elements which impart protective function to the weathering steel. But they are omitted in the figure because their distribution is rather flat and do not show enrichment in a special layer. Rust consists of three layers fundamentally,. 3.3 EPMA results of rust layer cross sections In order to examine distribution of elements in rust layers, cross sections of specimens were measured by EPMA. Mapping of elements were first measured and the results were. Fig. 3 SEM image of the cross section of skyward side of a weathering steel (E19H-A) exposed at Yokkaichi (Site 19) for 17 years.. Fig. 4 Depth profiles of (a) Fe, Si, Na, Cl and (b) S, Mn and P in the rust on the skyward side of a mild steel specimen (A19H-A) exposed at Yokkaichi (Site 19) for 17 years..
(5) 2822. K. Asami and M. Kikuchi. Fig. 5 Depth profiles of (a) Fe, Si, Na, Cl and (b) S, Mn and P in the rust on the earthward side of a mild steel specimen (A19H-B) exposed at Yokkaichi (Site 19) for 17 years.. the outermost layer with a thickness of 3 µm or less, an outer layer, and an inner layer. The thicknesses of an outer layer and an inner layer depend on steels, sides (skyward side or earthward side) and the environment of the exposure sites. Thickness of inner layer seemed not sensitive to the side of surface, that is, there is no large difference between the skyward and earthward surfaces. The thickness of outer layer is, however, dependent on side; the thickness is smaller on the earthward side surface than the skyward side surface. Concentration of Mn is generally high in the outer layer. In steels, manganese exists as MnS particles. When the concentration of SO2 is low in the exposure environment, the most of S in the rust layer comes from MnS in steels. However, distributions of Mn and S in the rust layer are not in accordance because MnS react with air easily and form stable substances in the rust layer. Sulfer in the rust layer comes also from the environment when the concentration of SO2 is high in environment. It was reported that the corrosion loss of weathering steels at Yokkaichi (Site 19) was in general about twice that of Mikuni Pass (Site 08).10) However, both specimens do not show such a difference in the rust layer thickness obtained from cross-sectional observation. Rust on weathering steels is compact, and difficult to exfoliate. This characteristic will contribute to the protective property. Okada et al.1) reported that a large quantity of amorphous rust were formed because of Cu and P were condensed in the inner layer within the rust layer, which could impart protective property to the weather-. Fig. 6 Depth profiles of (a) Fe, Si, Na, Cl, (b) S, Mn and (c) Cr, Cu, Ni and P in the rust on the skyward side of a weathering steel specimen (D19H-A) exposed at Yokkaichi (Site 19) for 17 years.. ing steels. However, the enrichment of P in the inner layer was not observed in this report, and the relation of P and amorphous rust was not clear, either. Misawa et al.2, 3) studied Cr-containing steels and found that α-FeOOH in which Cr was partly substituted for Fe had much higher protectiveness than conventional α-FeOOH. It was made clear in this work that not only Cr but also Cu and Si are enriched in the inner rust layer as shown in Figs. 4–7. According to Sakashita and Sato,11) the ion selectivity of rust has an important role for the protectiveness of rust; i.e., oxyhydroxides in general has anion selectivity, but that it changes to cation selective when some anions such as phosphate and molybdate ions adsorbed. This means that if the rust layer formed on a weathering steel is cation selective, the penetration of anions such as Cl− will be hindered, and the rust layer will be protective against corrosion. If elements enriched in the inner layer can impart cation selectivity to the rust layer, the rust layer formed on.
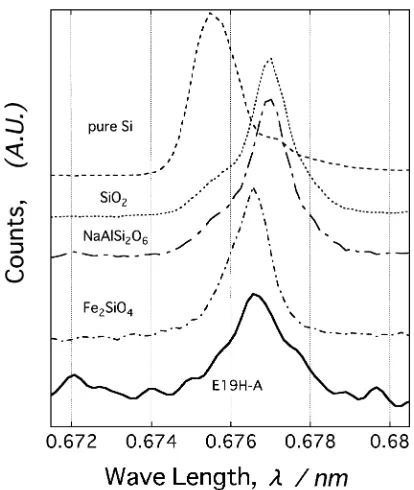
(6) Characterization of Rust Layers on Weathering Steels Air-Exposed for a Long Period. 2823. Fig. 8 Rust structure on a weathering steel estimated from EPMA measurements.. Fig. 7 Depth profiles of (a) Fe, Si, Na, Cl, (b) S, Mn and (c) Cr, Cu, Ni and P in the rust on the earthward side of a weathering steel specimen (D19H-B) exposed at Yokkaichi (Site 19) for 17 years.. the steels will be protective. Yamashita et al.12) reported that Cr(III) was substituted for Fe(III), cation selectivity increased certainly. However, effect of Si which is also enriched in the inner layer was not mentioned. In order to make the role of Si clear, the chemical state of Si in the rust layer was estimated by measuring Si Kβ X-ray spectrum. In Fig. 9, Si Kβ spectrum from the rust layer of E19H-A is shown. For comparison, Si Kβ spectra of several standard substances, pure Si, NaAlSiO6 , SiO2 and Fe2 SiO4 are also measured and shown in Fig. 9. By comparison with the Si Kβ spectra of standard substances, it can be said that the spectrum of E19H-A is most close to Fe2 SiO4 ; pure Si shows a peak at a clearly different position, and it is also different from the spectra of NaAlSiO6 and SiO2 . It is, therefore, most probable that most of Si in the inner rust layer is in the form of iron silicate. Similarly, Si in the rust layer on A19H-A showed a peak at the same position. It can be said that the Si. Fig. 9 Si Kβ spectrum of Si in the rust on specimen E19H-A together with those of pure silicon, NaAlSi2 O6 , SiO2 and Fe2 SiO4 .. in the rust layer comes from steels rather than the deposition from outside. However, its role is not known yet, and more examination will be required about the role of the Si in the rust layer. 3.4 Results of TEM and ED analyses For specimens A19H-A, A19H-B, E19H-A and E19HB, distribution and abundance of α-FeOOH, β-FeOOH, γ FeOOH, amorphous rust and magnetite in a rust layer were investigated using TEM and ED. Examples of TEM images of rust and their diffraction patterns are shown in Figs. 10(a) and (b). The former and the latter correspond to regions where α-FeOOH and β-FeOOH are exclusively observed, respectively. Other than the five components listed above, a rust expressed by (FeOOH)3 ·(Fe2 O3 )4 was found, but it was found to be an artifact during specimen preparation for TEM. αFeOOH consists of fine crystallites. It can be observed that.
(7) 2824. K. Asami and M. Kikuchi. Fig. 11 Percentage among crystalline rust components on skyward side and earthward side of a mild steel (A19H) and a weathering steel (E19H).. Fig. 10 Typical bright field images and electron diffraction patterns from a rust layer on a corroded steel: (a) α-FeOOH and (b) β-FeOOH.. their grain sizes are several nm and more, and it is very fine fiberous structure. They are intricately entangled. On the other hand, β-FeOOH is beltlike shaped with several nm in width and several µm in length; the length can not be seen in the figure. Since beltlike crystallites are gathered well ordered, it turns out that ED shows strength distribution peculiar to fiber structure. Among rust constituents, α-FeOOH was the main consituent in all specimens. The distribution of β-FeOOH was not regularly distrbuted, but it was rather abundant at outer region. On a plain carbon steel specimen (A19H-A), amorphous rust and magnetite were abundant at the bottom of the rust layer. The clear boundary between the inner layer and outer layer observed by EPMA was not observed by TEM/ED. It might be caused the fact that the distribution of constituents of rust layer was judged only from observation of a certain specific domain along the edge of a hole made with ion milling technique. Future examination is required much more on the distribution of rust constituents. The average abundance of α-FeOOH, β-FeOOH, γ FeOOH, and magnetite in the rust layer formed on a plain carbon steel (A19H) and a weathering steel (E19H) after air exposure for 17 years in Yokkaichi was estimated semi-. quantitatively from the relative electron diffraction intensity belonging to respective components at each observation. Within the present experiment, the correlation between abundance of amorphous rust and steel materials or exposure side (skyward or earthward) was not clear. In general, it is difficult to quantify amorphous rust from electron diffraction intensities. Especially quantification of amorphous species should cause large uncertainty. In Fig. 11, abundance among only crystalline rusts in the rust layer is shown. In the same way as the results of X-ray diffraction of the rust layer from the surface, it is clear that the α-FeOOH is the main constituent in rust layer on a plain carbon steel (A19H) and on a weathering steel (E19H). Magnetite appears more on earthward side than skyward side, and more on Steel A than Steel E, while γ -FeOOH is more abundant on skyward side than earthward side. Moreover, γ -FeOOH appears much more on the plain carbon steel than the weathering steel. There is no special tendency in abundance of β-FeOOH in contrast to XRD from the rust layer surface. The depth range observed by XRD from the surface is only in the range of at most 2–3 µm from the surface. As shown in Fig. 1, XRD observation of the rust layer surface clearly shows high abundance of β-FeOOH on the skyward surface for every specimen. This may caused by the fact that the elements convoluted in the outermost region are different in quantity and species from other part (both inner layer and outer layer) of the rust layer. On the other hand, that of TEM/ED measurements of the cross section can cover whole the specimen rather than the surface region. There is a view where the quantity ratio of α-FeOOH to β-FeOOH + γ -FeOOH+ magnetite (α/γ ∗ ratio) detected by X ray diffraction can be used as an index for protection nature of a rust layer.12, 13) Based on this view, the α/γ ∗ ratio was taken from TEM/ED observation. Without counting amorphous rust by TEM/ED to α-FeOOH, the α/γ ∗ ra-.
(8) Characterization of Rust Layers on Weathering Steels Air-Exposed for a Long Period. tios were 1.51 and 1.15 for E19H-A (skyward) and E19HB (earthward), respectively, and 0.97 and 0.74 for A19H-A (skyward) and A19H-B(earthward), respectively. On a weathering steel, the ratio α/γ ∗ > 1, while that on a plain carbon steel, it is less than 1, and the α/γ ∗ value was larger on the skyward side than that on earthward side. It can be said that the α/γ ∗ ratio determined by ED seems to be good index for the protective nature of the rust layer. When amorphous rust by ED was counted as a part of α-FeOOH, every α/γ ∗ was more than 1.2, and it was largest on the earthward side of plain carbon steel. Although a part of XRD-amorphous rust was judged as crystalline in this work, there exists also still more amorphous rust even in TEM/ED observation. As mentioned above, however, the quatitative results can not be obtained for TEM/ED-amorphous rust because the intensity from TEM/ED-amorpous rust is not much clear. The α/γ ∗ ratio by TEM/ED will be applicable to the evaluation of rust layer without counting TEM/ED-amorphous rust. 4. Conclusions Several weathering steels and a plain carbon steel exposed to atmosphere for 17 years at a coastal industrial region (Yokkaichi) and at a rural region (Mikuni Pass) with their faces being placed horizontally were investigated by EPMA, XRD, SEM and TEM/ED, and following conclusions were drawn: (1) Rust consists of three layer essentially; the inner, outer and outermost layers irrespective of a plain carbon steel or a weathering steel. The rust layer consists of α-FeOOH, β-FeOOH, γ -FeOOH, magnetite and amorphous rust. (2) The outermost layers is about 3 µm thick and enriched with atmospheric deposits. In the outer layer, Cl and S are enriched. Alloying elements, Cu, Cr and Si are concentrated in the inner layer while P and Ni is mostly distributed uniformly over the whole rust layer. (3) Irrespective of steels, the major component of the rust layer in the outermost layer is α-FeOOH and minors are β- and γ -FeOOH. β-FeOOH is especially abundant on the skyward surfaces. (4) In the outer and inner layers, the main constituent is α-FeOOH, which is formed more on skyward side than earthward side, and more on weathering steel than plain carbon steel. Abundance of γ -FeOOH is higher on the skyward rust layer than the earthward rust layer, and it exists more on a plain carbon steel. Magnetite appears more on the earthward side than on the skyward side, and more on a plain carbon steel than a weathering steel. There is no special tendency in abundance of β-FeOOH.. 2825. (5) Silicon in the inner layer is in the forms of silicates. (6) The quantity ratio of α-FeOOH to β-FeOOH + γ -FeOOH+magnetite, the α/γ ∗ ratio, obtained by TEM/ED, is larger than 1 on a weathering steel, and less than 1 on a plain carbon steel. The TEM/ED determined α/γ ∗ value can be used as an index to evaluate the protective natutre of a rust layer as have been done with conventional XRD technique. (7) XRD and EPMA results shows almost no difference between specimens exposed at the industrial region (Site 19) and the rural region (Site 08) because of calcium chloride sprayed for melting snow on road during winter at Site 08. Acknowledgments The authors are very grateful to Public Works Research Institute, Japan Association of Steel Bridge Construction and the Kozai Club for specimens and environmental data, and to Dr. T. Nakayama, Kobe Steel for several standard X-ray diffraction patterns. Thanks are also to Mr. Y. Murakami for EPMA measurements, to Mr. S. Itoh and Mr. T. Sato for preparation of TEM specimens, and to Miss Y. Hitomi for data arrangement. The present work is supported in part by Grant-in-Aids for Scientific Research (A) (2) No. 10355027 from the Ministry of Education, Culture, Sports, Science and Technology, Japan. REFERENCES 1) H. Okada, Y. Hosoi, K. Yukawa and H. Naito: Tetsu-to-Hagane (J. Iron and Steel Institute of Japan) 55 (1969) 355–365. 2) T. Misawa, M. Yamashita, Y. Matsuda, H. Miyuki and H. Nagano: Tetsu-to-Hagane (J. Iron and Steel Institute of Japan) 79 (1993) 69–75. 3) M. Yamashta, H. Miyuki, H. Nagano and T. Misawa: Zairyo-to-Kankyo (Corros. Eng.) 43 (1994) 26–32. 4) M. Yamamoto, H. Katayama and T. Kodama: Current advances in Materals and Processes (CAMP-ISIJ): 12 (1999) 422. 5) K. Shiotani, W. Tanimoto, C. Maeda, F. Kawabata and K. Amano: Zairyo-to-Kankyo (Corros. Eng.) 49 (2000) 67–71. 6) H. Kihira: Electrochemical Phenomena at Interface, ed. by H. Ohshima and K. Furukawa (Marcel Dekker, New York, 1998) pp. 429–440. 7) J. T. Keiser, C. W. Brown and R. H. Heidersbach: Corros. Sci. 23 (1983) 251–259. 8) M. Yamashita, K. Asami, T. Ishikawa, T. Ohtsuka, H. Tamura and T. Misawa: Zairyo-to-Kankyo (Corros. Eng.) 50 (2001) 521–530. 9) K. Asami: Trans., JIM 21 (1980) 302–308. 10) Private communication: Public Works Research Institute Ministry of Construction, Japan Association of Steel Bridge Construction and the Kozai Club. 11) M. Sakashita and N. Sato: Boshoku Gijutsu (Corros. Eng.) 28 (1979) 450–461. 12) M. Yamashita, H. Miyuki, Y. Matsuda, H. Nagano and T. Misawa: Corros. Sci. 36 (1994) 283–299. 13) H. Kihira, T. Misawa, T. Kusunoki, T. Tanabe and T. Saito: Zairyo-toKankyo (Corros. Eng.) 48 (1999) 727–732..
(9)
Figure



+3

Related documents
Alcohol use disorder Beck Depression Inventory Body Mass Index Center for Epidemiologic Studies Depression Scale Composite International Diagnostic Interview Clinical Interview
The SNR quantifies the distinguishability between signals conditioned on states with different parity, while the overlap fidelity measures the undesired back action the measurement
We turn now to the analysis of global banks aggregate funding patterns in international markets: international bond issuances, cross-border interbank liabilities, and global banks
Two of the significant parameters not present in the EHS are heating set-points (HSPs) and infiltration rates. A number of surveys of internal temperature or
With these mechanisms in place, the City is confident that we can stop urban decay in the selected areas and create vibrant public spaces in which business and ordinary residents
DeVry University offers a variety of degree programs* and areas of specialization through the college of Engineering & Information Sciences, to help start you on the right path
Khi các giải pháp trên ít hiệu quả chúng ta có thể sử dụng phương pháp tăng công suất phát để tăng tỉ số C/I, hoặc giảm công suất của trạm gây nhiễu.. Ngoài
ing the total throughput and energy efficiency of the system. Throughput maximization requires using excess power thus it is in contrast with energy efficiency. Therefore,
