1 This is a pre-print version of the article
A. Mauri, M. Perrini, A.E. Ehret, D.S.A. De Focatiis and E. Mazza (2014), Time-Dependent Mechanical Behavior of Human Amnion: Macroscopic and Microscopic Characterization, Acta Biomaterialia, in press. DOI: 10.1016/j.actbio.2014.09.012
The post-print can be found at http://dx.doi.org/10.1016/j.actbio.2014.09.012
Time-Dependent Mechanical Behavior of Human Amnion: Macroscopic and
Microscopic Characterization
Arabella Mauria, Michela Perrinia,b, Alexander E. Ehreta, Davide S.A. De Focatiisc, Edoardo
Mazzaa,d
a
Department of Mechanical and Process Engineering, ETH Zurich, 8092 Zurich, Switzerland
b
Department of Obstetrics, University Hospital Zurich, 8091 Zurich, Switzerland
c
Division of Materials, Mechanics and Structures, Faculty of Engineering, University of Nottingham, NG7 2RD Nottingham, United Kingdom.
d
Swiss Federal Laboratories for Materials Science and Technology, EMPA, 8600 Dübendorf, Switzerland
Abstract
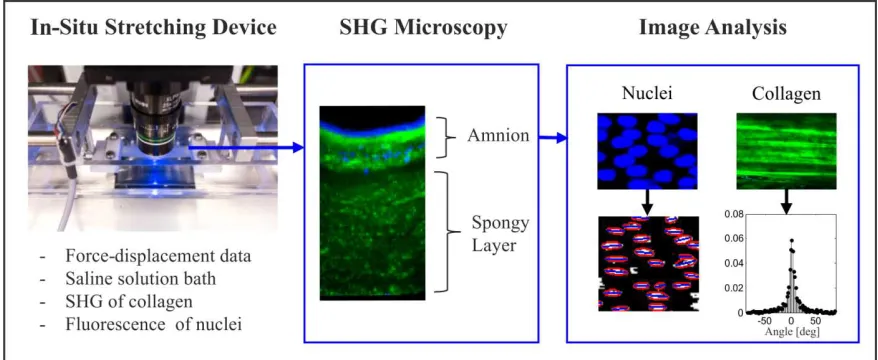
Characterizing the mechanical response of the human amnion is essential to understand and to eventually prevent premature rupture of fetal membranes. In this study, a large set of macroscopic and microscopic mechanical tests has been carried out on fresh unfixed amnion to gain insight into the time-dependent material response and the underlying mechanisms. Creep and relaxation responses of amnion were characterized in macroscopic uniaxial tension, biaxial tension and inflation configurations. For the first time, these experiments were complemented by microstructural information from nonlinear laser scanning microscopy performed during in-situ uniaxial relaxation tests.
2
investigation revealed a large volume reduction at the beginning, but no change of volume was measured long-term during relaxation. Tension-strain curves normalized with respect to the maximum strain were highly repeatable in all configurations and allowed the quantification of corresponding characteristic parameters. The present data indicate that dissipative behavior of human amnion is related to two mechanisms: (i) volume reduction due to water outflow (up to ~20 seconds) and (ii) long-term dissipative behavior without macroscopic deformation and no systematic global reorientation of collagen fibers.
1. Introduction
The fetal membrane (FM) surrounds the growing fetus and ensures its environment during gestation. Preterm premature rupture of the membrane affects about 3% of all pregnancies and increases the risk of morbidity in the newborn [1]. The etiology of preterm premature rupture of the membrane is complex and not completely understood. Repeated mechanical loading, such as that occurring as a result of fetal movement and labor, was recently shown to affect the microstructure of the membrane [2] and to reduce its toughness [3]. These results suggest that the time- and history-dependent behavior of FM tissue plays a critical role. To understand this behavior, detailed analysis of both macroscopic stress and kinematic responses, and the microstructural mechanisms are required.
The FM is a multilayered structure [4] with two main components, the amnion and the chorion, which are connected by an interface called spongy layer. The amnion is the inner layer of the FM facing the amniotic liquid. This thin membrane has a mean thickness of about 60-120 µm [5, 6, 7, 8] and is composed of a monolayer of epithelial cells, a compact layer of collagen and a layer of collagen fibers containing fibroblast cells [4]. The amnion is considered to be the load-bearing layer of the FM [9] becoming the focus of mechanical investigations. In addition to its essential physiological function, it was also proposed as a promising candidate to be used as scaffold material for tissue engineering applications [10, 11].
3
alone [15, 16, 32]. Lavery and Miller analyzed creep and relaxation phenomena in the inflated intact membrane, identifying conditions of non-recoverable deformation and quantifying a pressure-dependent rate of relaxation [26]. The authors showed that preterm membranes were less affected by strain hardening, underwent thickness thinning to a greater degree than term membranes [28], and that membrane integrity reduced more in labored than in unlabored membranes [29]. Stress-relaxation and cyclic experiments on human amnion showed a stress-level-dependent response and, surprisingly, lower dissipation at higher strain levels, which could indicate an intrinsic coupling of strain- and time-dependency [15, 16].
Stress-relaxation in soft biological tissues arises from microstructural mechanisms, such as relaxation of single collagen fibrils [33, 34], global rearrangement of collagen microstructure [34, 35, 36], progressive failures of crosslinks [37, 38, 39], liquid phase rearrangement or dehydration [40, 41], and may depend on the stress level reached [42]. The specific mechanisms determining the mechanical time-dependence of amnion have not yet been identified.
Bürzle et. al. [18] observed extremely large lateral contraction of the amnion in uniaxial tension tests. In contrast to the common large inter- and intra-membrane variability of the tension-stretch curves, this kinematic response was highly repeatable. In the present work, repeatable features of the time-dependent behavior will be investigated at macroscopic and microscopic length scales. A new in-situ experimental setup that allows for macroscopic deformation while simultaneously performing multiphoton microscopy was developed to gain microstructural insights. By this means, for the first time, thickness measurements, collagen orientation and microscopic in-plane kinematics were quantified for fresh, unfixed and hydrated human amnion during relaxation experiments. Macroscopic uniaxial tension tests with free or constrained lateral contraction were performed. A new normalization procedure is introduced, which extracts highly repeatable features of the time-dependent behavior of the amnion from the scattered experimental data typical for soft biological tissue samples, providing a valuable basis for the development and validation of corresponding constitutive models.
[image:3.595.78.517.481.661.2]4 2. Material and Methods
2.1 Amnion samples
Fresh FM were collected from patients who underwent elective caesarean sections between 37 and 39 gestational weeks. Patients were recruited with informed written consent using a protocol approved by the Ethical Committee of the District of Zürich (Stv22/2006 and Stv07/07). The selected pregnancies had no labor contractions prior to delivery, no preterm rupture of the membrane, no diabetes mellitus and were negative for streptococcus B, HIV, hepatitis A and B, chlamydia and cytomegaly. Immediately after collection, the amnion was gently separated from the chorion and stored in physiological solution (NaCl 0.9%) for about half an hour. Samples were cut with a razor blade and stored in saline solution at room temperature until testing, which took place within a few hours after delivery. A series of mechanical tests (section 2.2) were performed to characterize creep and relaxation response in uniaxial and multiaxial stress states. Other mechanical tests (section 2.3) were performed within the multiphoton microscope for microstructural characterization during relaxation. A total of 26 specimens from 8 different membranes were investigated and test duration ranged between 10 minutes and 2 hours. Corresponding sample geometries and testing configurations are summarized in Table 1.
Table 1: Summary of all experiments.
Samples No. of Specimens
Testing Configuration
Specimens Dimensions
Holding Time
Repeated Loading
R-U n=5 Uniaxial Tension
Relaxation 60 mm x 15 mm 10 min After 100 min
R-U-M n=3 Uniaxial Tension
Relaxation 60 mm x 15 mm 10 min -
R-B n=4 Biaxial Tension
Relaxation 15 mm x 60 mm 10 min After 100 min
C-U n=5 Uniaxial Tension
Creep 60 mm x 15 mm 10 min After 100 min C-I n=4 Inflation Creep ∅ = 50 mm 10 min After 100 min R: relaxation; C: creep; U: uniaxial; B: biaxial; I: inflation; M: microscope.
2.2 Macroscopic Experiments
5 2.2.1 Relaxation experiments
Relaxation tests (R) were performed with our custom experimental setup [18, 43] consisting of two hydraulic actuators with calibrated 20 N load cells, a video extensometer system and a buffered saline solution bath. Amnion was gently positioned on a plastic sheet, sprayed with saline solution and marked in the central region with a water resistant pen (GEOCollege Pigment Liner 0.05). With the help of a sand paper jig, specimens were clamped while immersed in saline solution to minimize dehydration and artifacts arising from the high surface tension of the amnion. Relaxation experiments were carried out in two testing configurations. Uniaxial tension (U) was achieved by elongating a long, narrow specimen (free dimensions: 60 x 15 mm) in the direction of the long axis and allowing free contraction in the other directions to reach stress-free boundaries. For uniaxial extension with constrained contraction, specimens with a large width-to-length ratio (free dimensions: 15 x 60 mm) were used, so that lateral (but not thickness) contraction was strongly restrained by the clamping and a planar biaxial state of tension (B) was obtained, see e.g. [44].
The reference configuration and the reference length L were defined by a force threshold of 0.01 N (U) and 0.04 N (B), respectively, corresponding to an equivalent reference membrane tension T of 0.0006 Nmm-1. By this means the nominal strain was defined as ε = ∆L L⁄ and the loading was performed at a fixed nominal strain rate of 0.2 s-1. The dwell phase started after reaching a target force of 0.8 N (U) and 2.4 N (B), corresponding to a membrane tension T of 0.054 Nmm-1 in both cases. This value was chosen as a significant loading level with a membrane tension of the order of that generated by early contractions [3], while still being beyond a critical value potentially causing membrane rupture. To investigate the influence of loading history, the loading protocol was repeated with the same specimen after a recovery phase of 100 minutes in the unloaded clamped state. Force and displacement signals were recorded at 8 Hz, while images of the central region of the specimen were acquired at 4 Hz and used to extract the sample width.
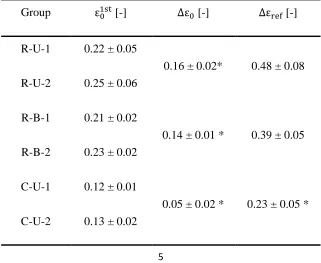
Table 2: Extracted parameters (see Fig. 6 for definitions) are reported as mean ± standard deviation. *: significantly different groups (p<0.05).
Group ε [-] Δε [-] Δε [-]
R-U-1 0.22 ± 0.05
0.16 ± 0.02* 0.48 ± 0.08 R-U-2 0.25 ± 0.06
R-B-1 0.21 ± 0.02
0.14 ± 0.01 * 0.39 ± 0.05 R-B-2 0.23 ± 0.02
C-U-1 0.12 ± 0.01
[image:5.595.137.458.496.759.2]6 2.2.2 Creep Experiments
Uniaxial creep experiments were performed with the same handling protocol and on the same experimental setup as described in 2.2.1, but the target force of 0.8 N was held constant during 10 minutes. To avoid an overshoot at the target force, the loading ramp was force-controlled. A posteriori analysis showed that by this means a nominal strain rate of approximately 0.04 s-1 was achieved over the major part of the loading phase. Additionally, creep inflation tests (I) were performed with our custom-built inflation device [31] modified in order to perform creep experiments with a fast initial loading: a large reservoir filled with physiological saline solution and placed on a platform with an adjustable vertical position, was connected to the inflation chamber through a tube equipped with a valve. The reservoir was placed at a specific height to generate a target pressure in the chamber within a very short time of the opening of the valve. The target pressure of 35 mbar was chosen to achieve a similar creep tension to that used in the uniaxial stress configuration (0.054 Nmm-1). Tests were performed in saline solution to ensure hydration of the tissue during the experiment. Specimens with 50 mm diameter were clamped on the inflating cylinder with the help of sand paper rings [31]. The pressure values and images were recorded at 4 Hz. We remark that relaxation experiments with the inflation device were not possible due to the permeability of the amnion, which has a leaky epithelium to regulate the intramembranous water flow [45].
[image:6.595.141.446.363.698.2]7
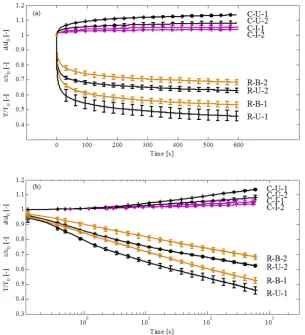
different configurations: uniaxial tension (U); biaxial tension (B); and inflation (I). The specimens underwent two sequential loadings: a first holding (1) of 10 minutes, an intermediate recovery phase of 100 minutes, and a second holding (2) of 10 minutes. Tension (relaxation) and deformation (creep) curves are normalized with respect to their value at the beginning of the holding phase (T , ε and d ). Normalized relaxation curves (T/T ) show the reduction in tension during the dwell phase, whereas normalized creep curves (ε/ε and d/d ) show the accumulation of creep deformation during constant force loading.
2.2.3 Data Analysis
Instead of stress, membrane tension [Nmm-1] was used to analyze the data, due to the variability and difficulty in measuring the thickness, and the inhomogeneity of the layered structure of amniotic samples. For U and B experiments, nominal membrane tension was calculated as measured force over initial width. The average transverse stretch (λ ) in U configuration was computed from the specimen’s width in the central region. To this end, the recorded images were converted to black and white upon appropriated adjustment of the threshold level; the area of the specimen was divided by the length of the image in the direction of elongation to obtain width. Finally, λ was calculated as current divided by initial width. For inflation experiments, membrane tension was evaluated as described in [31] from pressure values and current curvature of the specimen. The apex displacement d was quantified with a custom-made algorithm in Matlab (The MathWorks Inc., Massachusetts, USA).
In relaxation and creep curves, tension, strain and displacement were divided by the values (T , ε or d ) at which the target force was reached (Fig. 6) to compensate for the variation in tissue content in different specimens and membranes inducing a different material stiffness, see e.g. [16, 32]. A normalization procedure was introduced also to interpret the tension-strain and pressure-displacement representation of the relaxation and creep experiments. To this end, the nominal strain ε λ 1 was normalized with respect to ε . This is equal to the constant strain during the first relaxation in the R-tests and to the strain at the beginning of the first creep phase in C-tests.
[image:7.595.100.484.494.663.2]8 2.3 Microscopic Experiments
In-situ relaxation experiments were performed with a custom-made stretching device placed under a multiphoton microscope (Fluoview 1000 MPE, Olympus; Facility: Center for Microscopy and Image Analysis, University of Zurich). This device consists of two collinear actuators driven by servo motors, connected to a control box, and a force sensor (Fig. 1). The symmetric setup minimizes translations of the imaged region during loading. The clamps are submerged in saline solution to avoid tissue dehydration, and images were taken from the top with a water objective (XLPlan N 25x, NA 1.05).
Specimens were stained with Hoechst 33342 (2'-[4-ethoxyphenyl]-5-[4-methyl-1-piperazinyl]-2,5'-bi-1H-benzimidazole trihydrochloride trihydrate), a cell-permeable dye which binds to the DNA. Mounting of the amnion specimens was done in saline solution with the help of a sacrificial plastic jig, which was cut off after tightening of the clamps. Second harmonic generation (SHG) signals of the collagen and fluorescence of the nuclei were detected with specific filters (Olympus FV10-MRROPT, BA397-412 and BA455-490) using an excitation wavelength of 820 nm. Microscope acquisition settings were optimized to allow fast scanning through the thickness and to ensure sufficient resolution for the analysis of the data. 3D stacks were taken at the initial configuration, continuously during relaxation, and again after unloading, by collecting images at 5 μm intervals through the whole amnion thickness. Specimens were stretched slowly up to the force threshold of 0.01 N and then up to a nominal strain of 0.2 at a constant loading velocity, corresponding to a nominal strain rate of 0.01 s-1. The relaxation strain was chosen on the basis of the mean value of the strain obtained in the macroscopic experiments, and used instead of a force threshold due to present limitations in the control software. Force and displacement signals were recorded at 10 Hz. After loading, the specimen moved slightly in the vertical direction, so that new start and end positions of the image stack needed to be defined. The adjustment time during relaxation was recorded with a stop watch and considered in the data post-processing.
Microscopic in-plane deformations were extracted from the position and shape of the epithelial cell nuclei (Fig. 1). An orthogonal image only containing the fluorescence signal from the second channel was taken at each time increment. The nuclei were fitted by circumscribing ellipses, the center points of which were tracked during relaxation and used to quantify the microscopic stretches in the direction of loading, λ , and perpendicular to it, λ .
Given the large variability in the amount of the spongy layer that remained attached to the amnion (Fig. 1), the thickness of the amnion was extracted manually using the software Imaris (Bitplane AG, Switzerland). For each stack, seven lines perpendicular to the epithelial layer were drawn through the amnion (without the interface layer) and the mean length of the lines was used as a measure of thickness. The microscopic stretch λ was defined as the current thickness divided by the initial thickness.
9 2.4 Statistical Analysis
Quantified parameters are reported as mean ± standard deviation in Table 2. Differences between loading cycles were analyzed with a paired t-test, whereas differences between configurations were analyzed with a two-sample t-test. A significance level of 0.05 was chosen.
3. Results
3.1 Macroscopic Response
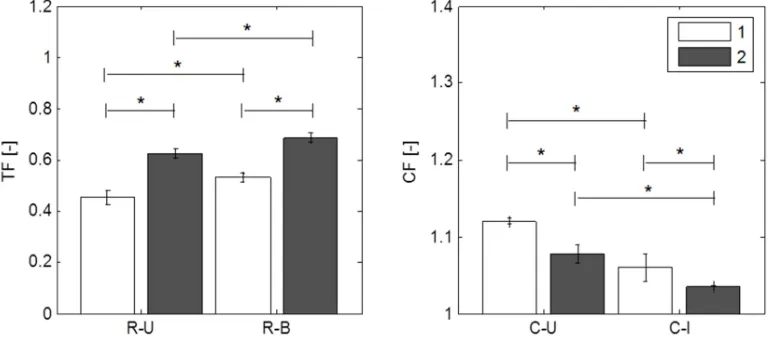
The time-dependent behavior of human amnion in creep and relaxation experiments is summarized in Fig. 2, where mean curves of normalized histories of tension and displacement are reported for the times following the first and second loading of each configuration. The curves show a clear distinction between uniaxial and biaxial tension configurations as well as between first and second loading, indicated by the tension and creep fractions (TF and CF) in Fig. 3. TF defines the normalized tension (T/T ) which has not relaxed at the end of the relaxation time. This parameter was significantly different between each group. In creep experiments, amnion shows little strain accumulation in both uniaxial and inflation configurations. CF is defined as the normalized nominal strain (ε/ε ) and apex displacement (d/d ), respectively, evaluated at the end of the creep phase. Creep and relaxation show larger dissipation in the first compared to the second loading cycle, and lower dissipation for the state of biaxial tension (I and B) than for uniaxial tension (U). The logarithmic representation (Fig. 2b) of the relaxation curves indicates short-term and long-term mechanisms in the time-dependent response of the tissue. In the initial phase (approx. 0-20 s) the slope differed notably between the U and B configurations, whereas in the long-term phase the difference is more pronounced between the loading cycles within one of the loading configurations.
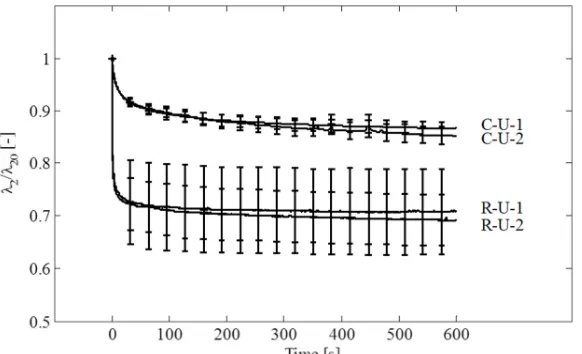
The normalized transverse contraction during relaxation, defined as the stretch λ divided by the stretch at the beginning of the holding phase λ , , was found to be time-dependent with two
characteristic time scales (see Fig. 4). During the initial phase (up to 20 s), the width of R-U samples contracts to ~80% of λ , , stabilizing afterwards with less than 5% additional contraction
over further ~580 seconds. During creep, the transverse contraction along with the longitudinal deformation follows the large Poisson’s ratio characteristic of the fetal membrane reported in [18].
[image:9.595.147.438.522.699.2]10
beginning of the holding phase (λ , ) and shows the additional lateral contraction accumulating
during the holding phase.
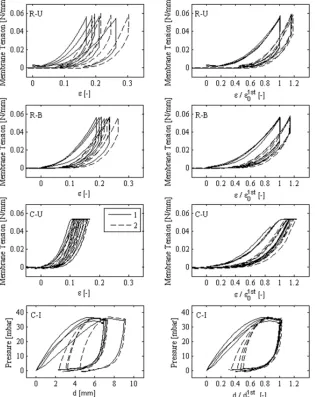
Tension-strain curves of planar tensile configurations (U and B) are shown in Fig. 5 (top rows). The right panel displays the curves after normalization with respect to the holding strain of the first loading ε . This procedure led to a remarkably consistent and highly repeatable response across different specimens in each experimental configuration. Curves including the loading, the holding and the unloading of the first and second cycle, were analyzed, and characteristic parameters were extracted. A similar reproducibility of the curves was obtained for the inflation (I) tests. In this case, the characteristic curves are reported as pressure versus apex displacement d and normalized with respect to the apex displacement reached after the first loading d (Fig. 5, bottom rows). The influence of the choice of the reference configuration, predefined by the value of the initial force threshold, on the proposed normalization was also studied. Remarkably, varying the preforce by a factor as big as two, did not significantly affect the result.
[image:10.595.142.457.305.702.2]11
membranes. After normalization with respect to the beginning of the first relaxation or creep phase (ε , cf. Fig. 6), the curves fall remarkably close together (right column).
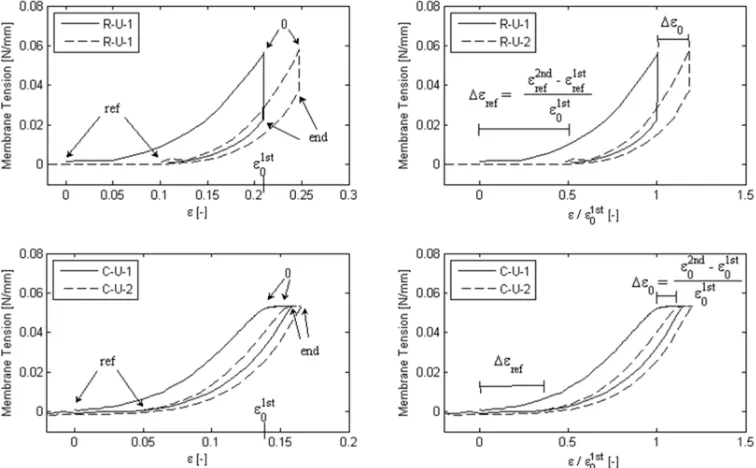
The definition of parameters characterizing each curve is illustrated by representative relaxation and creep curves in Fig. 6. The corresponding parameter values are reported in Table 2. The value of ε varies between samples, especially for the uniaxial configuration, owing to the protocol defined in terms of a target tension T . In contrast to the tension fraction TF, ε was not statistically different between the two groups (R-U and R-B). The difference in holding strain between the first and the second loading, normalized with respect to the first loading value ε , was defined as Δε and was significantly different between R-U, R-B and C-U. The initial relative residual strain Δε is the strain needed in the second loading to achieve the target force threshold, normalized with respect to the holding strain of the first loading ε , and represents the non-recoverable strain developed during the first dwell phase with respect to its loading level.
3.2 Microscopic Response
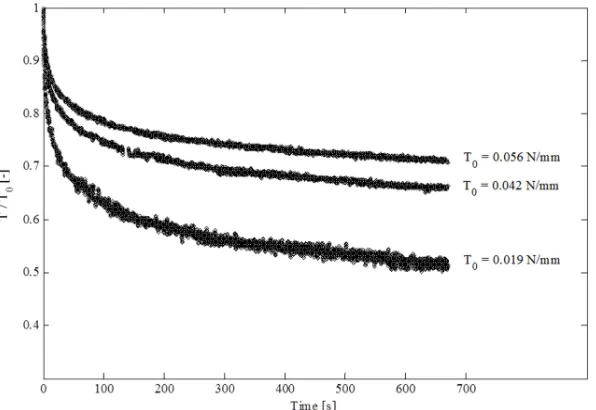
The microstructural layers of the amnion were investigated in their hydrated and unfixed state. The amnion consists of the epithelium, the compact layer and the fibroblast layer. The amount of attached amnion-chorion interface (spongy layer) varies from almost none to substantial remainders with a thickness that exceeds that of the amnion layer itself (Fig. 1). Relaxation curves of specimens stretched to 20% of nominal strain are shown with the corresponding tension
T reached at the beginning of the relaxation period (Fig. 7). Microscopic in-plane deformation was extracted from the displacement of cell nuclei, leading to microscopic longitudinal and lateral stretches, λ and λ shown in Figure 8c. 3D image stacks were used to determine values of current thickness enabling the quantification of the out-of-plane stretch λ in Figure 8a. During in-situ stretching, the specimen moves in the vertical direction so that the focal plane needs to be adjusted. Due to this adjustment, the tissue response in the first 30-40 seconds could not be recorded. The first and the last measurement of the thickness correspond to the unloaded samples before relaxation and the unloaded samples after relaxation, respectively. A large thickness reduction was visible between unloaded and loaded configurations, but no significant changes in thickness could be observed during the 10 minutes of relaxation (Fig. 8a). Collagen alignment in the loading direction was characterized from the second harmonic generation signals and quantified through the collagen orientation index, as shown in Figure 8b. The collagen orientation index indicates that no systematic change in the global orientation of the collagen occurred during relaxation. Finally, microscopic axial elongation and lateral contraction did not change during relaxation (Fig. 8c) in agreement with the stable macroscopic response (cf. Fig. 4).
4. Discussion
A normalized representation of relaxation and creep curves was proposed in this study to quantify and compare the response to different test protocols (Fig. 5). This representation provides a powerful tool to achieve master-curves that characterize the time-dependent behavior of the human amnion. Curves from different specimens and different membranes coincide to a remarkable extent, and this effect is highly reproducible for all tested configurations, independently of the choice of the reference configuration predefined by the tension threshold
12
independent of the strain level. Microscopic relaxation tests with different peak stress values confirmed the observation by Oyen et al. [16] that the elastic fraction (equivalent to TF) is lower for lower peak stresses. The low inter- and intra-membranous variability of the normalized relaxation response - in large contrast to un-normalized curves - was confirmed by the very small difference (< 8%) between our mean curve R-U-1 and the curve reported by Oyen et al. [15]. Higher tension reduction was measured for R-U samples compared to R-B, for which the prevented transverse contraction reduces the alignment of fibers in the direction of loading. This difference is already evident during the short-term response and this is in agreement with the observed ongoing lateral contraction during this phase. Interestingly, the long-term slope of the normalized tension curves (Fig. 2) was similar for both configurations when compared in the same loading cycle. Our macroscopic results suggest the existence of distinct relaxation mechanisms which act at two different timescales (short- and long-term), and which are differently affected by the loading configuration and history.
Fig. 6: Representative uniaxial relaxation (R-U) and creep (C-U) curves illustrating the nomenclature and the extracted characteristic parameters. “ref” refers to the reference configuration and denotes the beginning of the loading ramp. The beginning of the holding phase is referred to as “0” and is defined trough the target force F0. After 10 minutes holding phase (“end”), the specimen is unloaded. These characteristic points are shown (on the left column) for the first (1) and the second (2) consecutive loading. The parameter Δε represents the non-recoverable strain developed during the first dwell phase with respect to its loading level. The parameter Δε shows the additional strain needed to achieve the same target force F0 with respect to its loading level. Corresponding definitions apply also for data from inflations tests.
[image:12.595.107.485.296.530.2]13
mechanisms involved in creep and in relaxation may be different [52], Thornton et al. [35] proposed a model able to account for mechanisms of continuous fiber recruitment during creep. This model was able to predict a sufficiently different response in creep and relaxation tests. According to the model, the progressive fiber recruitment minimizes creep strain accumulation at the physiological stress level [42] and can be interpreted as the same microstructural mechanism that induces the stress-strain nonlinearity in this range [53]. Additionally, the collagenous crimp pattern visualized from frozen histological sections was shown to change significantly after creep, and was larger in straightened fibers with higher loading stresses [35]. From this point of view, the large reduction in tension observed in relaxation experiments at lower tension levels might arise from a substantial un-recruitment of fibers upon initial volumetric relaxation. In addition to fiber recruitment and uncrimping, global fiber alignment towards the direction of loading needs to be considered as an important mechanism that contributes to the time-dependent response. Creep [54] and relaxation [41] behavior are also affected by tissue hydration, due to the fact that fibers move in a viscous hydrated matrix. The present data indicate a pronounced volume decrease during loading and holding phases, related to water outflow from the collagenous network. Creep and relaxation responses of collagenous tissues are intrinsically related to the nonlinear nature of their mechanical behavior, arising from microstructural deformation mechanisms. These are affected by the loading configurations, the loading stress levels and the interaction with the liquid phase. The two characteristic timescales visible in our macroscopic experiments suggested two acting mechanisms. Microstructural insight was useful to provide better understanding.
Fig. 7: Relaxation response from in-situ (microscopic) uniaxial experiments. The specimens were stretched to a nominal strain of 20% giving rise to different peak tensions T0. The amount of dissipated tension was larger for smaller values of peak tension.
[image:13.595.148.446.400.605.2]14
field, providing insight into the 3D microscopic local history of deformation, as shown in Figure 8.
A variable portion of the spongy layer remains attached to the amnion during separation and has a looser appearance than in the intact fetal membrane [2]. Although the variability in thickness of the remaining spongy layer is large, macroscopically the mechanical response showed a very small variability in the time-dependent response. This indicates that either the effect of the spongy layer was negligible, or that it is characterized by the same deformation mechanism as the amnion.
ref 0 100 200 300 400 500 600 700 unloaded
0.4 0.6 0.8 1 1.2
^63
[-]
Time [s]
0 100 200 300 400 500 600 700
0 5 10 15 C o ll ag en O ri en ta ti o n I n d ex [ -] Time [s]
0 100 200 300 400 500 600 700
0.7 0.8 0.9 1
^6i
=
^6i0
[-] Time [s] (c) (b) (a) ^ 61/
^ 62/ ^620
15
Fig. 8: Microstructural parameters quantified from in-situ (microscopic) uniaxial relaxation experiments (R-U-M), showing the large volume reduction upon loading followed by a stable 3D geometry during the long-term phase of relaxation. Microscopic out-of-plane kinematics (a), collagen orientation index (b) and microscopic in-plane kinematics (c) are reported over the relaxation time. Investigations of the unloaded samples are denoted with “ref” and “unloaded”. These configurations were defined through a force threshold equivalent to the reference membrane tension Tref. Similarly to Fig. 4, in-plane stretches are normalized with their values at the beginning of the holding phase (λ , and λ , ). Macroscopic in-plane kinematics (λ/λ, ) are
shown in light gray.
The corresponding microscopic deformation during relaxation (as determined from the analysis of the relative displacement of the deformed cell nuclei) was found to be in line with macroscopic data of the central region of the sample. Amniotic thickness reduction was measured between the initial and the long-term loaded configuration, indicating a large reduction of volume. In fact, the initial average volume of 12.60 ∙ 10 μm , reduced to 3.8 ∙ 10 μm (volume change of J =
V'(/V = 0.30) upon long-term loading and recovered to 10.51 ∙ 10 μm (J = 0.83) after
unloading, see Fig. 8. Note that the large volume reduction associated with water outflow is restricted to the loading period and to the initial phase of the relaxation. Interestingly, no significant volume change was measured during the long-term relaxation. The constant volume and the stable orientation of fibers suggest that the long-term phase of relaxation arises from lower length scale dissipation in collagen fibers. This identifies for all configurations two distinct mechanisms and two corresponding time scales: volume reduction due to water outflow in the short-term response (up to ~20 seconds); long-term dissipative behavior without a macroscopic shape change and without systematic global reorientation of collagen fibers. At lower tension level, the first mechanisms might have a stronger influence on the initial tension level, leading to a lower TF as observed in Fig. 7 and reported by Oyen et al. [16].
A recent work [55] describes two mechanisms responsible for stress relaxation in polymer gels: viscoelastic relaxation of the polymer network and solvent flow induced volume change. Similar to the present case, the latter is the mechanism with larger contribution to stress reduction, but, remarkably, unlike the present observations volume increases during gel relaxation, instead of decreasing.
5. Conclusion
Experiments were performed to characterize the time dependent mechanical behavior of human amnion in uniaxial and biaxial tensile configurations. This test campaign provided data on creep and relaxation response for uniaxial and biaxial tension states, thus forming the basis for formulation and validation of constitutive model equations for human amnion. One original finding of the present work is that the first and second cycle relaxation and creep curves for uniaxial and biaxial loading can be accurately described using one single specimen specific input, i.e. the normalizing parameter ε (see Figure 5, right column). The high repeatability of the normalized curves indicates highly repeatable deformation mechanisms leading to the observed time history of mechanical response. One other remarkable finding concerns the strong volume reduction (down to 30% of the initial value) observed for amnion subjected to uniaxial deformation. This reduction is partially recoverable when unloading.
16
deformation behavior (in-plane and out-of-plane stretches, i.e. λ , λ and λ ) and to assess the evolution of collagen fiber orientation. This information helped rationalizing the data and proposing hypotheses on relevant mechanisms of deformation.
Characteristic parameters of tension relaxation, strain accumulation and transverse contraction were determined from macroscopic experiments. These parameters were significantly different in first vs. second loading, and in different loading configurations. Amnion displayed a large tension relaxation, but small creep strain accumulation, which might arise from the intrinsic nonlinearity of the deformation mechanisms of its collagenous network. The microstructure showed two characteristic responses: (i) a large volumetric reduction and fiber alignment upon loading and in the initial phase of relaxation; (ii) stable microscopic kinematics during long-term relaxation. These findings suggest that the long-term relaxation is related to fiber dissipation, whereas the short-term relaxation is related to water flow and fiber alignment.
Acknowledgments
The authors are grateful to the Swiss National Science Foundation (SNSF) for financial support (Project number: 205321_134803/1) and to the team of Prof. Zimmermann at the University Hospital Zurich for providing FM samples. The authors would like to thank the Center for Microscopy and Image Analysis (University of Zurich), in particular J.M. Mateos, for their collaboration and support with nonlinear laser scanning microscopy. AEE gratefully acknowledges the support within the ETH Zurich Postdoctoral Fellowship and Marie Curie Actions for People COFUND programs. DSADF gratefully acknowledges financial support from the Faculty of Engineering at the University of Nottingham that enabled a 3-month stay at the ETH Zurich during the first half of 2013.
References
[1] Calvin SE, Oyen ML. Microstructure and Mechanics of the Chorioamnion Membrane with an Emphasis on Fracture Properties. Ann NY Acad Sci 2007;1101:166-185.
[2] Mauri A, Perrini M, Mateos JM, Maake C, Ochsenbein-Koelble N, Zimmermann R, Ehrbar M, et al. Second harmonic generation microscopy of fetal membranes under deformation: Normal and altered morphology. Placenta 2013;34:1020-1026.
[3] Perrini M, Bürzle W, Haller C, Ochsenbein-Kölble N, Deprest J, Zimmermann R, Mazza E, et al. Contractions, a risk for premature rupture of fetal membranes: A new protocol with cyclic biaxial tension. Med Eng Phys 2013;35:846-851.
[4] Bourne GL. The Foetal Membranes. Postgrad Med J 1962;38:193-201.
[5] Fawthrop RK, Ockleford CD. Cryofracture of human term amniochorion. Cell Tissue Res 1994;277:315-323.
17
[7]Jabareen M, Mallik AS, Bilic G, Zisch AH, Mazza E. Relation between mechanical properties and microstructure of human fetal membranes: An attempt towards a quantitative analysis. Eur J Obstet Gyn R B 2009;144:S134-S141.
[8] Ilancheran S, Moodley Y, Manuelpillai U. Human fetal membranes: a source of stem cells for tissue regeneration and repair? Placenta 2009;30:2-10.
[9]Oyen ML, Calvin SE, Landers DV. Premature rupture of the fetal membranes: Is the amnion the major determinant? Am J Obstet Gynecol 2006;195:510-515.
[10]Jin CZ, Park SR, Choi BH, Lee K-Y, Kang CK, Min B-H. Human amniotic membrane as a delivery matrix for articular cartilage repair. Tissue Eng 2007;13:693-702.
[11] Amensag S, McFetridge PS. Rolling the Human Amnion to Engineer Laminated Vascular Tissues. Tissue Eng Pt C-Meth 2012;18:903-912.
[12] Artal R, Sokol R, Neuman M, Burstein A, Stojkov J. The mechanical properties of prematurely and non-prematurely ruptured membranes. Methods and preliminary results. Am J Obstet Gynecol 1976;125:655-659.
[13] Oxlund H, Helmig R, Halaburt J, Uldbjerg N. Biomechanical analysis of human chorioamniotic membranes. Eur J Obstet Gyn R B 1990;34:247-255.
[14] Helmig R, Oxlund H, Petersen LK, Uldbjerg N. Different biomechanical properties of human fetal membranes obtained before and after delivery. Eur J Obstet Gyn R B 1993;48:183-189.
[15] Oyen ML, Calvin SE, Cook RF. Uniaxial stress-relaxation and stress-strain responses of human amnion. J Mat Sci-Mater M 2004;15:619-624.
[16] Oyen ML, Cook RF, Stylianopoulos T, Barocas VH, Calvin SE, Landers DV. Uniaxial and biaxial mechanical behavior of human amnion. J Mater Res 2005;20:2902-2909.
[17] Borazjani A, Weed BC, Patnaik SS, Feugang JM, Christiansen D, Elder SH, Ryan PL, et al. A comparative biomechanical analysis of term fetal membranes in human and domestic species. Am J Obstet Gynecol 2011;204:365.e25-365.e36.
[18] Buerzle W, Mazza E. On the deformation behavior of human amnion. J Biomech 2013;46:1777-1783.
[19] Joyce EM, Moore JJ, Sacks MS. Biomechanics of the fetal membrane prior to mechanical failure: Review and implications. Eur J Obstet Gyn R B 2009;144:S121-S127.
[20] Schober E, Kusy R, Savitz D. Resistance of fetal membranes to concentrated force applications and reconciliation of puncture and burst testing. Ann Biomed Eng 1994;22:540-548. [21] Pressman EK, Cavanaugh JL, Woods JR. Physical properties of the chorioamnion throughout gestation. Am J Obstet Gynecol 2002;187:672-675.
18
and constitutes a significant component of the work required. Am J Obstet Gynecol 2006;194:211-217.
[23] Oyen ML, Cook RF, Calvin SE. Mechanical failure of human fetal membrane tissues. J Mat Sci-Mater M 2004;15:651-658.
[24] Pandey V, Jaremko K, Moore RM, Mercer BM, Stetzer B, Kumar D, Fox JM, et al. The force required to rupture fetal membranes paradoxically increases with acute in vitro repeated stretching. Am J Obstet Gynecol 2007;196:165.e1-165.e7.
[25] Polishuk WZ, Kohane S, Peranio A. The Physical Properties of Fetal Membranes. Obstet Gynecol 1962;20:204-210.
[26] Lavery JP, Miller CE. The Viscoelastic Nature of Chorioamniotic Membranes. Obstet Gynecol 1977;50:467-472.
[27] Miller CE, Lavery JP, Donnelly TA. Determination of Elastic Parameters For Human Fetal Membranes. J Rheol 1979;23:57-78.
[28] Laver JP, Miller CE. Deformation and creep in the human chorioamniotic sac. Am J Obstet Gynecol 1979;134:366-375.
[29] Lavery JP, Miller CE, Knight RD. The Effect of Labor on the Rheologic Response of Chorioamniotic Membranes. Obstet Gynecol 1982;60:87-92.
[30] Schober EA, Kusy RP, Whitley JQ, Savitz DA. Effect of thickness on the fracture characteristics of fetal membranes. J Mat Sci-Mater M 1994;5:130-137.
[31] Buerzle W, Haller CM, Jabareen M, Egger J, Mallik AS, Ochsenbein-Koelble N, Ehrbar M, et al. Multiaxial mechanical behavior of human fetal membranes and its relationship to microstructure. Biomech Model Mechan 2013;12:747-762.
[32] Xu D, Zhao C, Ma H, Wei J, Li D. Comparison of viscoelasticity between normal human sciatic nerve and amniotic membrane. Neural Regen Res 2013;8:1269-1275.
[33] Svensson RB, Hassenkam T, Hansen P, Magnusson PS. Viscoelastic behavior of discrete human collagen fibrils. J Mech Behav Biomed 2010;3:112-115.
[34] Screen HRC, Seto J, Krauss S, Boesecke P, Gupta HS. Extrafibrillar diffusion and intrafibrillar swelling at the nanoscale are associated with stress relaxation in the soft collagenous matrix tissue of tendons. Soft Matter 2011;7:11243-11251.
[35] Thornton GM, Frank CB, Shrive NG. Ligament creep behavior can be predicted from stress relaxation by incorporating fiber recruitment. J Rheol 2001;45:493-507.
[36] Screen HR. Investigating load relaxation mechanics in tendon. J Mech Behav Biomed 2008;1:51-58.
19
[38] Raischel F, Kun F, Herrmann HJ. Failure process of a bundle of plastic fibers. Phys Rev E 2006;73:066101.
[39] Guo Z, Vita RD. Probabilistic constitutive law for damage in ligaments. Med Eng Phys 2009;31:1104-1109.
[40] Provenzano P, Lakes R, Keenan T, Vanderby R. Nonlinear Ligament Viscoelasticity. Ann Biomed Eng 2001;29:908-914.
[41] Legerlotz K, Riley GP, Screen HR. GAG depletion increases the stress-relaxation response of tendon fascicles, but does not influence recovery. Acta Biomater 2013;9: 6860-6866.
[42] Thornton GM, Shrive NG, Frank CB. Ligament creep recruits fibres at low stresses and can lead to modulus-reducing fibre damage at higher creep stresses: a study in rabbit medial collateral ligament model. J Orthop Res 2002;20:967-974.
[43] Roehrnbauer B, Mazza E. Uniaxial and biaxial mechanical characterization of a prosthetic mesh at different length scales. J Mech Behav Biomed 2014;29:7-19.
[44] Hollenstein M, Ehret AE, Itskow M, Mazza E. A novel experimental procedure based on pure shear testing of dermatome-cut samples applied to porcine skin. Biomech Model Mechan 2011;10:651-661.
[45] Beall M, van den Wijngaard J, van Gemert M, Ross M. Amniotic Fluid Water Dynamics. Placenta 2007;28:816-823.
[46] Feng X, Milanfar P. Multiscale Principal Components Analysis for Image Local Orientation Estimation. Proceedings of the 36th Asilomar Conference on Signals, Systems and Computers, Pacific Grove, CA, November 2002.
[47] Thornton GM, Oliynyk A, Frank CB, Shrive NG. Ligament creep cannot be predicted from stress relaxation at low stress: A biomechanical study of the rabbit medial collateral ligament. J Orthop Res 1997;15:652-656.
[48] Lee JM, Boughner DR. Mechanical properties of human pericardium. Differences in viscoelastic response when compared with canine pericardium. Circ Res 1985;57: 475-481. [49] Purslow PP, Wess TJ, Hukins DW. Collagen orientation and molecular spacing during creep and stress-relaxation in soft connective tissues. J Exp Biol 1998;201:135-142.
[50] Grashow J, Sacks M, Liao J, Yoganathan A. Planar Biaxial Creep and Stress Relaxation of the Mitral Valve Anterior Leaflet. Ann Biomed Eng 2006;34:1509-1518.
[51] Liao J, Yang L, Grashow J, Sacks MS. The Relation Between Collagen Fibril Kinematics and Mechanical Properties in the Mitral Valve Anterior Leaflet. J Biomech Eng-T ASME 2006;129:78-87.
20
[54] Thornton GM, Shrive NG, Frank CB. Altering ligament water content affects ligament pre-stress and creep behavior. J Orthop Res 2001;19:845-851.