warwick.ac.uk/lib-publications
Manuscript version: Author’s Accepted ManuscriptThe version presented in WRAP is the author’s accepted manuscript and may differ from the published version or, Version of Record.
Persistent WRAP URL:
http://wrap.warwick.ac.uk/106388
How to cite:
Please refer to published version for the most recent bibliographic citation information. If a published version is known of, the repository item page linked to above, will contain details on accessing it.
Copyright and reuse:
The Warwick Research Archive Portal (WRAP) makes this work of researchers of the University of Warwick available open access under the following conditions.
This article is made available under the Creative Commons Attribution 2.0 International license (CC BY 2.0) and may be reused according to the conditions of the license. For more details see: http://creativecommons.org/licenses/by/2.0/.
Publisher’s statement:
Please refer to the repository item page, publisher’s statement section, for further information.
Original Paper
Responsiveness, reliability, and minimally important and minimal detectable change of three electronic patient reported outcome measures for low back pain: a validation study
Froud R*, PhD – Warwick Medical School, University of Warwick, Coventry, UK and Kristiania University College, Oslo, Norway
Fawkes C, PhD – Barts and the London School of Medicine and Dentistry, Queen Mary University of London, London UK
Foss J, PhD – Department of Computer Science, University of Warwick, UK
Underwood M, MD – Warwick Medical School, University of Warwick, Coventry, UK
Carnes D, PhD – Barts and the London School of Medicine and Dentistry, Queen Mary University of London, London, UK, and Faculty of Health, University of Applied Sciences and the Arts, Western Switzerland
* Corresponding author: R Froud, Warwick Medical School, University of Warwick, Coventry, UK.
Abstract
Background: The Roland Morris Disability Scale (RMDQ), Visual Analogue Scale of pain
intensity (VAS) and Numerical Rating Scale (NRS) are among the most commonly used outcome measures in trials of interventions for low back pain. Their use in paper form is well-established. Few data are available on the metric properties of electronic counterparts.
Objective: To establish responsiveness, minimal important change (MIC) thresholds, reliability, and minimal detectable change (MDC95) for electronic (e) versions of the RMDQ, VAS, and NRS as
delivered via iOS app, Android app, and web app.
Methods: We recruited people with low back pain who visited osteopaths. We invited participants to complete the eRMDQ, eVAS, and eNRS at baseline, one-week, and six-weeks, along with a health transition question (TQ) at one and six-weeks. Data from participants reporting recovery were used in responsiveness and MIC analyses, using Receiver Operator Characteristic curves. Data from participants reporting stability were used for analyses of reliability (ICC agreement) and minimal detectable change (MDC95).
Results: We included 442 participants. At one and then six-weeks, ROC AUCs were 0.69 (95%CI 0.59 to 0.80) then 0.67 (0.46 to 0.87) for the eRMDQ; 0.69 (0.58 to 0.80) then 0.74 (0.53 to 0.95) for the eVAS; and 0.73 (0.66 to 0.80) then 0.81 (0.69 to 0.92) for the eNRS. Associated MIC thresholds were estimated as 1 (0 to 2) then 2 (-1 to 5), 13 (9 to 17) then 7 (-12 to 26), and 2 (1 to 3) then 1 (0 to 2) points, respectively. Over one-week in stable and ‘about the same’
participants ICCs were 0.87 (0.66 to 0.95) and 0.84 (0.73 to 0.91) for the eRMDQ, with MDC95 of
4 and 5; 0.31 (-0.25 to 0.71) and 0.61 (0.36 to 0.77) for the eVAS with MDC95 of 39 and 34; and
0.52 (0.14 to 0.77) to 0.67 (0.51 to 0.78) with MDC95 of 4 and 3 for the eNRS.
Conclusions: The eRMDQ was reliable with borderline adequate responsiveness. The eNRS was responsive with borderline reliability. While the eVAS had adequate responsiveness it did not have an attractive reliability profile. Thus, the eNRS might be preferred over the eVAS for measuring pain intensity. The observed electronic outcome measures’ metric properties are within the range of values reported in the literature for their paper counterparts and are adequate for measuring changes in a low back pain population.
Introduction
Low back pain (LBP) is a common and costly problem resulting in a substantial personal, social and economic burden, and is the number one cause of disability globally.[1, 2] LBP is a symptom rather than a specific disease as most LBP is non-specific; i.e. where no specific underlying cause has been identified, but where the term lacks formal definition and where definitions in trials have been diverse.[1, 3] The lifetime prevalence of LBP is between 60-84%. [4, 5] The global problem of LBP is getting worse due to aging and increasing population size.[6, 7] The number of clinical trials of interventions for LBP has been increasing, with over 30 trials of interventions for LBP now being published annually.[8] Patient-reported outcome measures (PROMs) in the form of paper questionnaires are typically used in these trials to judge the effectiveness of the health technology under investigation.[8]
Disability and pain are by far the most commonly measured domains in trials of interventions for LBP; each is measured at least twice as often as any other domain.[8] The Visual Analogue Scale (VAS), and the Numerical Rating Scale (NRS) are most commonly used for measuring pain, and the Roland Morris Disability Scale (RMDQ), is most commonly used for measuring
disability.[8] These are quasi-continuous measures of pain intensity (VAS, NRS) or functional disability, and for each the relationship between the observed item responses and the unobserved latent variable each is assumed to be consistent with a reflective conceptual
framework.[9] There is evidence that paper forms of VAS and NRS have been in use since at least the early to mid 20th century, and the RMDQ has been used since 1983.[10-12]
The validity of a PROM is defined as ‘the degree to which an instrument truly measures the
construct(s) it purports to measure’.[13] Several aspects that comprise what we consider to
constitute good development and validation of PROMs post-date the introduction of these particular instruments. Validation exercises have been performed retrospectively, results have accrued over time, and endorsement and use of the measures has survived the process.[14-16] Notwithstanding healthy academic debate, it is generally accepted that these outcome measures have reasonable face validity, content validity, and have at times been considered the legacy gold standard for comparison for assessing the criterion/convergent validity of other instruments. [17-19]
Measuring patient/participant change in health status using browser-based technology and mobile device technologies is a natural progression. Digital PROMs and ports of existing paper PROMs to digital media have become known as electronic patient reported outcomes measures (ePROs).[20] When migrating existing paper PROMs into ePROs, there are aspects relating to the metric validity of the instrument that may need to be reassessed. Some aspects of validity are clearly independent of whether the instrument is completed on paper or digitally—for example, the content wording (unless it is culturally/clinically out-of-date), and the extent to which this content is judged to appropriately span the domains of the health construct being measured (i.e.
content and face validity). However, other aspects of validity that relate directly to measurement performance should not be assumed to be unchanged.
change measurement properties is necessary before advocating their widespread use in health research.
In analyses of trials, or evaluations of health interventions, using PROMs to decide when an individual participant has responded, facilitates interpretation of intervention effect.[23] Responder analysis permits the number of improvements to simply be counted and compared by arm using several clear statistics. These are intuitive reporting methods and there is
consensus that back pain trials should incorporate these.[23-25] However, to be able to do this it is necessary to know (1) the minimum thresholds considered important to an individual
participant – the minimally important change (MIC); and (2) what magnitudes of change can be detected beyond the inherent measurement error of the instrument – the minimal detectable change (MDC).[26, 27] These thresholds may be altered by the change in media from paper to digital, and these thresholds may also be population-specific.[28, 29]
We aimed to determine reliability and responsiveness, MIC and MDC, for electronic versions of the VAS, RMDQ, and NRS as administered to adults with LBP who visit osteopaths, using a web browser, Android or iOS app on their own computers, smart phones, or tablets.
Methods
Recruitment
We recruited participants with LBP from osteopathic clinics in England and Wales. Participants were recruited by osteopaths on our behalf and provided with an enroll code and instructions for installing the iOS or Android app (from the App Store or Google Play) or completing the outcome measures using a web browser.
We assumed an attrition rate of 30%, and a recovery (i.e. participants who state they are much better or completely recovered on a health transition question – below) rate of over 90% in those with acute and sub-acute LBP (i.e LBP present for less than three months).[30] Thus, for our responsiveness study, for which we required improved participants, we sought to recruit a minimum of 200 people with acute and sub-acute LBP to ensure at least 50 eligible six-week measurements (see Sample Size section). For people with chronic LBP receiving manual therapy, we assumed the same rate of attrition, but a lower rate of recovery, of 45%.[24] For our test-retest study, we required stable participants who identified as remaining stable over a period of one–week; thus, we sought to recruit 400 chronic patients to find 50 participants
self-identifying as stable (i.e. reporting ‘no change’ on a health transition question – below).
Participants were invited to complete the electronic versions of outcome measures at baseline, one-week, and six-week follow-up time points.
Software
We used Android and iOS apps, and a web app with an associated form builder that was developed by Clinvivo Ltd, a University of Warwick spin-out company.[31] The apps, which function identically across platforms, permitted PROMs to be typeset and then administered to patients securely on their own devices. Data in transit are encrypted using a secure socket layer (SSL) and data at rest are encrypted using an Rivest-Shamir-Aldeman (RSA) and Advanced Encryption Standard (AES) encryption hybrid. At the end of the study period, data were
follow-up measurement due, were sent directly to devices for app-enrolled participants, and web-enrolled participants were sent up to two reminder e-mails.
Electronic Versions of Patient Reported Outcome Measures
The Visual Analogue Scale of Pain Intensity (VAS) is a continuous scale running from 0 to 100mm, measuring current pain intensity.[32] It is the most commonly used outcome measure in trials of interventions for non-specific LBP overall.[8] Huskisson is commonly credited with its development in 1974; however, there is evidence that it was being used at least as far back as 1921.[11] Intellectual Property Rights (IPR) are in the public domain and no permissions are required for use, reproductions, or modifications. Completion of the paper scale involves a person marking a line on the scale indicating their level of pain between to anchored scales that typically have wordings of ‘No pain’ on the left (i.e. 0mm) and ‘Worst possible’ or ‘Worst
imaginable’ pain on the right (i.e. 100mm).[33, 34] On paper, the distance of the marked line is then measured from the point of zero pain and reported in mm. In migrating this to an
electronic version (eVAS), we implemented a slider that could be dragged into position. We did not force the scale to render at 10cm, so as to allow for resizing to screens of different devices. Thus, we report scores in units rather than mm, where one unit is 1/100th of the scale (i.e. where
[image:6.595.72.507.351.404.2]the pointer can be set at any one of 101 different positions), as rendered (Figure 1).
Figure 1: Electronic Visual Analogue Scale (eVAS) for pain intensity. The figure shows a screenshot of the eVAS set to show 63 units of pain intensity
Figure 2: Electronic Roland Morris Disability Scale (eRMDQ). The figure shows a screenshot of part of the eRMDQ showing a part score of 3 units.
The NRS is an 11-point ordinal scale measuring current pain intensity.[40, 41] Validation of the paper version is well established.[41-43] It is the fourth most commonly used outcome in trials of interventions for LBP overall.[8] It is well established with IPR in the public domain. Scores on the NRS range from zero, which typically is anchored ‘No pain’, and 10, which typically is anchored ‘Worst pain possible’. Our electronic (eNRS) migration was an exact copy with these anchor wordings (Figure 3). As the range of responses is exhaustive, completion of the scale was required for submission.
Figure 3: Electronic Numerical Rating Scale (eNRS) for pain intensity. The figure shows a screenshot of the eNRS showing a part score of 6 units.
Participants were also asked to complete (electronically) a health transition question (TQ) at one and six-week follow-up time points. The TQ was a single question with the wording ‘Overall,
how would you rate the change in your symptoms since beginning this study?’ and where the
participant could respond on a seven-point scale: 1) Completely recovered; 2) Much improved; 3) Slightly improved; 4) No change; 5) Slightly worsened; 6) Much worsened; 7) Vastly
worsened.[44]
Assessment
We aimed to have 50 completed paired measurements in ‘improving’ participants for
[image:7.595.75.507.529.571.2]‘Completely recovered’ using the TQ. Improving participants’ scores were used to assess
responsiveness at one and six-weeks. For our test-retest study, we defined stable participants, a
priori, as those who select ‘no change’ at one-week, and in the case of having too few
observations, a post hoc sensitivity analysisincludingthose who selected either ‘slightly worsened’, ‘no change’, or ‘slightly improved’. This alternative ‘about the same’ approach to marking stability has been used elsewhere.[45] Allowing one-week is typical in low back pain test-retest studies; clinically, this is close enough for the people with chronic pain to remain stable, but far enough apart that participants cannot easily recall their initial responses. It was anticipated that the chronic population would predominantly contribute participants to the test-retest study, and that improving participants would come from across all chronicity
sub-populations.
Statistical Analyses
To measure responsiveness in a way that is consistent with the Consensus-Based Standards for the Selection of Health Measurement Instruments (COSMIN) definition, we constructed Receiver Operator Characteristic (ROC) curves for one and six-week data using a dichotomised TQ as the external criterion.[22] The area under the ROC curve (AUC) is then a metric of responsiveness, accepting that the external criterion reasonably includes the construct of interest.[46] The approach has previously been used to quantify responsiveness across all three paper versions of instruments.[47] ROC AUCs of over 0.70 were considered to be adequate.[9, 48] We
dichotomized the TQ such that participants responding ‘Completely recovered’ and ‘Much improved’ were considered ‘improved’, and all other responses were considered ‘not improved’.
We also used ROC curves and the TQ external criterion for one and six-week data to quantify minimally important change (MIC), which was defined as: “the smallest [change] in score in the domain of interest which patients perceive as beneficial and which would mandate, in the absence
of troublesome side effects and excessive cost, a change in the patient’s management.” (See Note 1
of Multimedia Appendix 1) [43, 49] We used a MIC estimator based upon the minimum sums of squares method, which consistently selects the cut-point closest to the top-left corner of ROC space; as required when sensitivity and specificity are valued equally.[50] We calculated confidence intervals for MIC point estimates using bootstrapping.[51]
To estimate reliability, we calculated intra-class correlation coefficients (ICCs).[52, 53] ICC values usually range from 0 to 1.[54] ICC values above 0.75 may be interpreted as excellent agreement, values of 0.40 to 0.75 indicate poor to fair agreement, and values of below 0.40 indicate poor agreement.[55] We calculated the standard error of measurement (SEM).[53] We used this to estimate the minimal detectable change (MDC95)(See Notes 2 to 4 of Multimedia
Appendix 1).[53, 56, 57]
TQs can be highly correlated with follow-up score rather than change.[24, 43, 58] Guyatt et al
assert that if a TQ is truly measuring change then a correlation between baseline score and the TQ, and follow-up score and the TQ should ideally be present, equal, and opposite.[58] In addition, they suggest that in a linear regression model with follow-up score entered as the initial explanatory variable, the baseline score should explain a significant proportion of the residual variance in the transition rating.[58] We performed Pearson correlations and fitted regression models to explore the degree to which the TQ measured change or simply reflected follow-up status. Log rank tests were used to assess significance of the addition of baseline score.
All analyses were performed using Stata version 14.2 (Statacorp, Texas). The program rocmic
Power and Sample Size
With the notable exception of construct validity, sample sizes in validation studies generally are not calculated based on power to test hypotheses: the estimation of reliability and
responsiveness parameters is focused on the extent to which the coefficients describing these parameters approach 1 (which would represent perfect reliability/responsiveness), rather than their difference from zero or some other null value. Generally, a sample size of at least 50 participants is considered adequate for this purpose.[9, 60] Assuming an ICC of 0.7, with 50 participants we would be able to estimate the ICC to within a 95% confidence interval of +/- 0.14. Alternatively, for an ICC of 0.8, we would be able to estimate to within a 95% CI of +/- 0.10. [9] For responsiveness, with 50 participants and assuming an AUC of 0.8, and equal numbers of cases and non-cases, we would be able to estimate AUC to within a 95%CI of +/- 0.12.[61]
As standard errors (SEs) for MIC estimates are not readily calculable, we used bootstrapping to generate standard errors and 95% CIs.[51, 62] Previous simulation work on the paper-based RMDQ in a similar population suggested that 2,500 bootstrap samples was sufficient to ensure standard error convergence.[63] To explore whether this is the case for the eRMDQ (and also whether it is an appropriate number of replications for the eNRS and eVAS) we simulated SEs by randomly sampling n observations (with replacement) from our dataset, for an increasing number of n; where n is an integer, beginning at 20 and increasing by increments of 20, up to 6,000.[62, 64] We then graphically assessed SE convergence and used the point of convergence to inform the number of bootstrap replications.
Data exclusions, assumptions, and variations
Prior to the addition of the ‘none’ box we imputed zero scores for all baseline submissions with no eRMDQ boxes ticked, and assumed and imputed a zero score for eRMDQ follow-up scores in the case that the baseline eRMDQ score was greater than zero, and a submission had been made for the follow-up period in question. When the eVAS rendered it did so with the slider in the zero position. In the case of a submission for an untouched eVAS, zero slider zeros were assumed valid. The eNRS is a required response and necessitated a selection for submission.
As part of the basic demographic details we collected, we included a list of presenting complaints, featuring LBP among 15 other common musculoskeletal presentations and the opportunity to report a complaint not listed in a free-text box. The list of complaints was derived from earlier survey work developed as part of a national data collection initiative.[65, 66] We excluded all cases where a participant had not checked the LBP box (data from non-LBP cases were used in unrelated research).
Ethics approval
Ethics approval was obtained from the research ethics committee at Queen Mary University of London (QMERC2014/18).
Results
User Statistics and Demographics
We collected data from 575 people from 30 osteopathic clinics, between July 15, 2014 and May 3, 2017. Of these, 442 (77%) reported LBP as their main complaint. The average submission time for one-week scores was 7.4 (standard deviation (SD)=0.79) days after baseline. The average submission time for six-week scores was 42.5 (SD=0.9) days after baseline. Of the 442 participants, 267 were female (60%); 306 (69%) identified as being in full or part-time
0.10
0.16
0.21
0.25
0.18
0.10
0.01
0.00
0
.0
5
.1
.1
5
.2
.2
5
P
ro
po
rt
io
n
18 to 29 30 to 39
40 to 49 50 to 59
60 to 69 70 to 79
[image:10.595.92.461.101.377.2]80 to 89 90 and over
Figure 4: Histogram of patient age. The figure shows a histogram of patient age at baseline
Figure 5: Flow chart showing completion rates at one and six-weeks, chronicity status, and the incidence of self-reported recovery using the health transition question, for participants who also completed eNRS, and eRMDQ and eVAS measurement (red)
Table 1. Baseline, one-week, and six-week scores across the whole sample
Baseline Median (IQR)
n One-week
Median (IQR)
n Six-week
Median (IQR)
n
eRMDQ
4 (6) 247 2 (6) 97 2 (3.5) 40
eVAS
41 (32) 247 24 (19) 97 19 (19) 40
eNRS
5 (4) 441 3 (3.0) 186 2 (2) 91
n (%) n (%)
TQ
(recovery) N/A N/A 101 (54) 187 69 (76) 91
Cumulative recovery (TQ)
N/A N/A 101 (23) 442a 170 (38) 442a
.4 5 .5 .5 5 .6 .6 5 M IC b oo ts tra p S E (N R S )
0 2000 4000 6000
Replications 1. 6 1. 7 1. 8 1. 9 2 M IC b oo ts tra p S E (R M D Q )
0 2000 4000 6000
Replications 7. 5 8 8. 5 9 9. 5 10 M IC b oo ts tra p S E (V A S )
0 2000 4000 6000
[image:12.595.95.457.91.343.2]Replications
Figure 6: MIC standard error convergence. A table of graphs showing MIC bootstrap standard error (SE) convergence from simulations with increasing replication numbers
The addition of baseline score generally explained a significant proportion of the variance in the TQ over and above follow-up score. The TQ correlated with follow-up score but not with
baseline score. Comprehensive results for the Guyatt analyses on the TQ’s performance in measuring change are listed in Note 2 of Multimedia Appendix 1.
Evaluation Outcomes
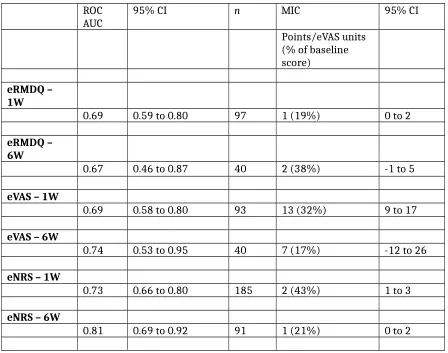
Graphically, SE convergence appeared to be asymptotically complete at around 5,000 bootstrap replications (Figure 6); thus 5,000 replications were used to generate confidence intervals for the MIC estimates in Table 2. Responsiveness point estimates (Table 2) were borderline
adequate (AUC≈0.7) or above adequate for all instruments and time points. The AUC confidence interval for the RMDQ at six-weeks spanned the null value. (Table 2)
ROC
AUC 95% CI n MIC 95% CI
Points/eVAS units (% of baseline score)
eRMDQ – 1W
0.69 0.59 to 0.80 97 1 (19%) 0 to 2
eRMDQ – 6W
0.67 0.46 to 0.87 40 2 (38%) -1 to 5
eVAS – 1W
0.69 0.58 to 0.80 93 13 (32%) 9 to 17
eVAS – 6W
0.74 0.53 to 0.95 40 7 (17%) -12 to 26
eNRS – 1W
0.73 0.66 to 0.80 185 2 (43%) 1 to 3
eNRS – 6W
[image:13.595.65.513.69.422.2]0.81 0.69 to 0.92 91 1 (21%) 0 to 2
n ICCagreement 95% CI MDC95
Points/eVAS units
eRMDQ – per protocol
15 0.87 0.66 to 0.95 4
eRMDQ – allowing slight change
43 0.84 0.73 to 0.91 5
eVAS – per protocol
15 0.31 -0.25 to 0.71 39
eVAS – allowing slight change
43 0.61 0.36 to 0.77 34
eNRS – per protocol 22 0.52 0.14 to 0.77 4
eNRS - allowing slight change
83 0.67 0.51 to 0.78 3
Using ‘no change’ as a criterion for judging stability, we did not achieve our a priori threshold of 50 test-retest data points for comparison across any of the instruments. Of the 23 people who said they had ‘no change’ at one-week, 15 (65%) had chronic pain. Allowing ‘slightly improved’ and ‘slightly worsened’ to count as stable, allowed us to achieve this threshold for the eNRS only. Of 84 people who said they had ‘no or slight change’ at one-week, 53 (63%) had chronic pain. Notwithstanding the lack of data, the eRMDQ reliability (agreement) was excellent using either analysis, with CIs spanning fair to excellent in both analyses (Table 3). For the eVAS per protocol analysis, the agreement was fair with CIs spanning poor to fair, and in the sensitivity analysis the agreement was poor to fair with a CI range spanning poor to fair (Table 3). For the eNRS per protocol analysis the agreement was poor to fair with a CI spanning poor to excellent, and for the sensitivity analysis agreement was fair with a CI spanning poor to fair to excellent (Table 3).
Discussion
Principal Results
The results suggest that the eRMDQ had borderline adequate responsiveness levels and excellent reliability. Conversely, the eNRS had relatively good responsiveness at six-weeks but borderline adequate reliability. The eNRS outperformed the eVAS, which had adequate
responsiveness but relatively poor reliability. As test-retest numbers were few, eVAS confidence intervals spanned poor to excellent and thus further investigation is warranted. While exploring use by age was not a specific study objective, we note the results indicate encouraging use by older people from this population.
Comparison with Prior Work
measures explored. ROC AUC for the RMDQ ranges from 0.64 to 0.93. [45, 47, 67-75] ROC AUC for the NRS ranges from 0.67 to 0.93.[41, 42, 47, 67, 75, 76] ROC AUC for the VAS ranges from 0.71 to 0.93.[47, 72, 77-79] Our results are within these ranges at six-weeks for all but our VAS estimate at one-week, where our point-estimate approaches the lower border of the range. Our eVAS data are nevertheless consistent with the range (i.e insofar as the upper CI overlaps). As estimates of ROC AUC for the VAS are fewer in the literature, which might explain why the range of reported results is narrower than it is for the RMDQ and NRS.
MIC thresholds for RMDQ has ranged between 1.5 and 5;[21, 24, 35, 67, 68, 72, 75, 80-83] for the NRS between 1.5 and 4;[41-43, 67, 75, 81, 84] and for the VAS between 15 and 28mm.[72] Our absolute MIC thresholds are comparable, but are towards the lower side of this range. MIC estimates are known to increase with baseline severity and relatively low baseline scores likely explain our relatively low thresholds.[68, 75, 81, 84] However, MIC thresholds in our results, expressed as percentage change from baseline, averages 28%, which is consistent with Ostelo et al’s suggestion (following a review of MIC and MDC literature) of using an improvement of between 20 and 30% of baseline score for the RMDQ, NRS and the VAS as a MIC threshold.[29] We emphasise that the MIC thresholds relate to the degree of change may be considered
important for an individual, and not what degree of difference may be considered important at a population-level. [27, 85, 86] We note that negative confidence intervals imply consistency of the data with the true MIC thresholds in the opposite direction. This is likely an artifact of low power and we suggest inflated sample sizes below for future studies based on the bootstrapped standard error observations.
Reported ICC estimates for the RMDQ have ranged from 0.42 to 0.95;[45, 67, 81, 87] for the NRS, from 0.92 to 0.98;[67, 81] and an estimate for the VAS of 0.71 has been reported.[88] Our results are within the ranges reported but our ICC point-estimate for the eVAS is lower than the
reported paper VAS estimate. It is conceivable that rendering the eVAS slider in a zero position might lead to additional variance in the case that the outcome is overlooked (i.e. leading to a comparatively lower ICC) and future research might explore whether a ‘touch to confirm zero’ design is acceptable to users. We also note that some of the ICC values in the literature ranges may have been derived from ICCs for consistency rather than agreement; this is a practice that is known to exist (although it is not always clear which approach is used) and known to
overestimate reliability.[53]
MDC95 estimates reported (or, in the case of the NRS only, either reported or where the MDC95
can be readily calculated from reported SEMs) have ranged from 5.0 to 12.1 for the RMDQ;[21, 24, 35, 45, 56, 67, 81, 83] from 2.4 to 11 (i.e. the full width of the scale) for the NRS;[41, 45, 67, 81, 84] and from 21.0 to 33.5 for the VAS.[79, 88, 89] Our estimates are slightly better than average for the RMDQ, towards the lower end of the range for the NRS, and comparable to the available estimates for the VAS.
In terms of comparison to studies assessing these instruments as ePROs, Bird et al conducted a test-retest study among 22 healthy adults of the VAS administered on iPad and found ICCs of 0.90 (0.82 to 0.95) as compared to 0.96 (0.92 to 0.98) in a paper version that participants completed simultaneously.[90] It is difficult to compare the results with this study, as the time between test and retest was less than 30 minutes. A much shorter period between test and retest might be appropriate in some populations (e.g. where change in acute pain must be measured over short spaces of time). In these cases, participants may be more prone to panel conditioning; where second response is affected by recall of the first response.[91] For back pain, most interventions focus on chronic pain and longer time periods. When exploring
work by Bishop et al, who administered the RMDQ on paper and on-line and constructed limits of agreement and explored differences between the instruments demonstrating equivalence with a score difference of only 0.03 points and a Bland-Altman range of -2.77 to 2.83.[94]
Finally, we note that the distribution of the user age of the health outcomes app in this population appears to be higher than the age of health app users.[95]
Implications
None of the results in this study is materially different from those that have been observed in population-similar studies of paper counterparts that are methodologically alike. There is thus some suggestion that the ePROs under evaluation are a suitable substitute for PROMs for measuring change in LBP. The eNRS outperformed the eVAS in terms of both responsiveness and reliability. As such we suggest the eNRS might be preferred the eVAS for the measurement of LBP pain intensity, but we caution that subsequent confirmatory research is warranted.
Limitations
The principal limitation is that in several cases we had small sample sizes. We had intended to recruit sufficient numbers to have at least 50 people for each assessment, in-line with
recommendations, but we failed to meet these targets as we underestimated the incidence of stability.[9] There were high rates of improvement in people receiving treatment and this is a hazard of nesting a test-retest design within a protocol where participants are receiving routine clinical treatment. This was of consequence in the eRMDQ responsiveness analysis, where the data are consistent with a null population parameter and thus six-week responsiveness of the eRMDQ requires confirmation in a larger sample. Having too few data has greater implications for the test-retest assessment of the VAS where the confidence intervals span coefficient values that can be interpreted at their extremes as either poor or excellent. It is less of an issue for the eRMDQ, as while the numbers are low and lower at one and six-weeks respectively, the stronger signal combined with boundary proximity leads to narrower and more useful CIs.
It is not ideal that we permitted slightly worse and slightly improved to indicate stability in our test-retest. Although, we note a similar approach has been observed previously.[45] Further, this was a post hoc decision taken in light of having too few observations to use our more stringent a
priori criteria of only those reporting ‘no change’. The results using our a priori approach, but
with few observations, are offered as sensitivity analyses that may provide useful comparison.
Having relatively few observations also meant that we were unable to explore differences by platform, i.e. iOS, Android, and, web browser, or to explore MIC as a function of baseline score (e.g. stratifying by number in category of severity), or separately by chronicity, which may have been useful and allowed us to explore any differences in these metrics by chronicity. Thus, our focus here is pragmatic and results are generalizable to the population of adults with LBP who consult osteopaths, notwithstanding chronicity.
We recorded in our database only the summed eRMDQ score, rather than individual responses. Had we retained detail of individual response profiles of the eRMDQ we could have also
calculated internal consistency (as well as aspects of modern test theory; e.g. Rasch analysis to examine item performance, or factor analysis to explore data dimensionality). Whereas COSMIN conflate internal consistency with reliability in their taxonomy,[22, 96] we consider internal consistency to be an indication of the unidimensionality of a scale and of item redundancy, rather than the degree to which a scale is free from measurement error. As such, and with respect to the reliability definition, we preferred to consider it separately. We had not
scale digitally may alter the way patients respond. Additionally, there may be self-selection effects of those more familiar with digital media joining the study and this may be a factor that could be confounded with how a person responds.
It is not ideal that our TQ correlates with follow-up score but not with baseline score. This is emerging to be the case generally and is not something particular to evaluating electronic outcome measures.[24, 43, 58] This emergence in our view raises the more general question of whether it is appropriate to use TQs at all to evaluate change in outcome measures. Apart from being overly driven by follow-up score, the assumption that the TQ is sufficiently driven by the same latent construct as the PROM, to the extent that it may be considered a gold standard, may be unrealistic. We have previously explored what people think about when they complete the TQ and what they think about when the complete the paper RMDQ version, and we found
discordance.[97] Pain appears to be a greater driver of the TQ and the wording of the TQ (i.e. attempting to place focus specifically on function or an explicit domain) does not appear to matter. In the current study, we used the term ‘symptoms’. However, in the case that the suggestion arising from our previous research is incorrect, then using a generic wording in the TQ might have the advantage of not favoring any one ePRO over another, but the disadvantage of disassociating the TQ from any specific latent health construct. Use of a generically worded TQ would then introduce some information bias; for example, if people systematically attend more to a particular domain upon reading the word ‘symptoms’. We caution that the logic of this typically taken approach of using one outcome measure as a proxy gold standard of recovery, and then using this proxy to judge domain-specific responsiveness and MIC thresholds in another, may be questionable where there is domain mismatch.
There was a small amount of missing data at baseline and one-week (one person in each case) which should have been impossibility as a selection on the eNRS was a required response. We are uncertain of the cause of this but we suspect that this might have been due to use of an obscure and/or obsolete browser.
This research was conducted solely in private care and people who pay to see osteopaths may differ from those attending publically funded health care, as is more routinely the case in health services research. We note a lower than typical baseline severity (as compared to clinical trials) and thus some caution is indicated before generalizing to typical trial populations. Finally, our focus here was on the most commonly used domains and outcome measures in trials. The VAS is most commonly used overall (pain), RMDQ second most common (disability), and the NRS the fourth most commonly used (pain). We did not include the third most commonly used outcome, the Oswestry Disability Questionnaire, which also measures disability.[8] Unlike the VAS and NRS, which are both single-item instruments, including two full disability questionnaires risked being unduly burdensome for participants. Qualitative work suggests that participants would prefer to spend only 5-10 minutes completing ePROs.[98, 99] Including a direct comparison with paper versions would have permitted direct exploration of criterion validity; however, this approach would likely have been affected by panel condition and further added to participant burden.
Recommendations for future research
Sampling stable participants from people receiving routine clinical treatment allows the nesting of a test-retest design makes for an efficient design. However, it produces some challenges for achieving sufficient recruitment over a realistic time period. It assumes that the TQ classification of unchanged is valid. As data suggest that TQ is driven more by follow-up state than change, the approach has some limitations. It would be scientifically preferable that test-retest studies are conducted within untreated populations. However, this has both ethical and practical
recommend planning for a study that is around three times larger, i.e. seeking around 1,200 people to obtain 50 stable participants. For study of responsiveness alone, around 250 participants should be sufficient to achieve 50 improvements at six-weeks. The most extreme MIC threshold we estimated was 7mm (-12 to 26) for the VAS at 6 weeks. This is lower than has been noted in studies of paper counterparts. Assuming the point estimate is representative of the population parameter, around 300 participants would be required to power a study to confirm the finding.
Retaining data at item level in future studies will permit more sophisticated analytics. There may need to be a cultural change as we transition from paper to digital measurement. The ability to more easily retain greater data resolution is a clear advantage of digital measurement and one that would be sensible to exploit. Further advantages in terms of cost, logistics, form validation, reminders, time logging, environmental factors, and reach, are undeniable and, in our view, make electronic health measurement very attractive. More generally, routine outcome measurement in clinical practice will permit learning healthcare systems and so should be a shared goal by stakeholders across healthcare.[100, 101] To achieve this, greater collaboration may be needed between clinicians, informatics, and policy makers. We also encourage further metric testing of electronic versions these and other legacy PROMs as so that results may inform health services researchers’ and clinicians’ choices of measure.
Conclusion
Each of the electronic outcome measures have metric properties that do not materially differ from values reported in the literature for their paper counterparts. A possible exception may the reliability of the eVAS, for which there is insufficient existing research to make useful
comparisons to the paper version. The eRMDQ is adequate for measuring back-related disability and the eNRS is adequate for measuring pain intensity. The eNRS should be preferred over the eVAS for the measurement of pain intensity.
Acknowledgements
RF and MU conceived of the study, applied for, and were awarded, the funding to do the study. CF undertook the day-to-day management of the study and submitted documents for
consideration by the Queen Mary University of London ethics committee. JF and RF were responsible for the data management for the study. RF performed all the analyses. All authors commented on and approved the manuscript. Part of RF and JF’s time on the study was funded by the Warwick Impact Fund, which administers the same HEIF5 grant. The study was
sponsored by University of Warwick but conducted from Queen Mary University of London that sponsored the remainder of CF’s PhD research. Neither the sponsor nor the funder had any involvement in the study design, analysis, or reporting of results.
Conflicts of Interest
RF, MU, and JF are directors and shareholders of Clinvivo Ltd, the University of Warwick spin-out company that provided the software for data collection in this study. The HEIF5 grant that paid for the development of IP that has been licensed to Clinvivo and has been used in this study and also paid for high-street vouchers that were used as incentives to recruit participants into the study. RF and DC are non-practising osteopaths, CF is a practising osteopath.
Abbreviations
AES: Advanced Encryption Standard AUC: area under the curve
CI: confidence interval
e: electronic; e.g. eRMDQ is the electronic version of the paper RMDQ JMIR: Journal of Medical Internet Research
ICC: Intra-class correlation coefficient IPR: Intellectual Property Rights IQR: Inter-quartile range
PGP: Pretty Good Privacy
RCT: randomized controlled trial
RMDQ: Roland Morris Disability Questionnaire ROC: receiver operator characteristic
RSA: Rivest-Shamir-Aldeman MIC: minimally important change MDC: minimal detectable change NRS: Numerical Rating Scale SE: standard error
SSL: secure socket layer TQ: transition question VAS: Visual Analogue Scale
Multimedia Appendix
Multimedia Appendix 1: Technical appendix – technical notes and extended technical results for Guyatt analyses.
References