© 2019, IRJET | Impact Factor value: 7.211 | ISO 9001:2008 Certified Journal | Page 897
DESIGN ANALYSIS OF FREQUENCY RESPONSE SETUP FOR DEFECT
DETECTION IN CARBON STEEL MATERIAL POLE SHOE
Kalugade S. A
1, Kadane S. M
2, Kamble B. S
31
ME Student, (Mechanical-Production), KIT’s College of Engineering Kolhapur, Maharashtra, India
2,3
Asst Professor, Dept of Production Engineering, KIT’s College of Engineering Kolhapur, Maharashtra, India
---***---Abstract -
Testing and evaluation of components inindustry has one primary objective that to make sure that they are being produced to meet actually required specifications established by the customer. Use of non-destructive testing and evaluation as a means of quality control permits the industries to produce better quality products. Non destructive and evaluation itself cannot produce a better product. However, if inspection department works in close co-operation with the quality control department and advises on any and all deviations in procedure, the quality control department can then make the necessary adjustments in process practice to ensure high quality products. Moreover in order to prevent the excessive scrap products, it is necessary for the inspection department to observe the faulty product as soon as possible. In this way the faulty product can be removed so no further labour or time will be wasted on it, and secondly, the quality control department can make necessary corrections before too many products are produced.
Key Words: NDT testing machine, Vibrometer, frequency,
Pole shoe.
1. INTRODUCTION
Basically there are two types of testing carried out for the product to check the internal and external parameters i.e destructive testing and non-destructive testing. In destructive testing any material with specific qualities are checked. The parameters like hardness test, fatique test , impact test are carried out using instruments like Universal testing machine, Brinell hardness Testing machine and impact testing machine. In non destructive testing the process is totally opposite. The specimen or the products are damaged in destructive testing but in NDT test the defects are checked by using various process without damaging the specimen or the component. These two types of testing are carried out after the specimen is produced. The reason is that the products produced should meet the specified dimensions given by the customer along with reliability. Non-destructive testing and evaluation (NDT&E) is a quality control tool that permits the industries to produce better quality products. Two departments play important role in these process which include quality check department and inspection department. It means that the inspection department should catch the fault in the product at early stage so that
excessive scrap produced will be reduced. In this manner the faulty specimen or the product will be identified with no further labour or time to be wasted. The quality control department can make necessary changes before too many products are produced.
The objective of Non Destructive Testing is to verify that the component will perform at full extent during service span without hampering the operation. In according with detecting any defect without damaging the component fulfills both objective of finding the defective piece and not wasting the material. The customer needs total accuracy in the part as well as the company. The component may serve as a part or whole of any assembly with specific reliability. The interpretation of the data obtained by non destructive testing during inspection is performed to large extent by fracture mechanics concept. According to this concept, defects like any type of crack present in the material grow under vibration or stress during service and leads to failure of the specimen by growing upto extended limit. Also the fracture mechanics permit the remaining life of specimen and also allow to calculate critical size of flaw. Non destructive testing is used to find defect size as well as defect location whereas Non destructive evaluation characterizes defect. The selection of NDT and NDE helps in clear understanding of problem to be sort.
2. Literature review
P. Frojd and P. Ulriksen [2016]presented amplitude and phase of continuous ultrasonic waves with a lock-in amplifier is shown to give similarly sensitive indicators of concrete damage as pulsed coda wave analysis, but maintains its sensitivity at considerably much lower signal levels. Continuous and pulsed measurement was performed on a concrete lab subjected to cyclically increased damage level. In the unloaded phase each measurement type was performed at varying transmit signal levels. The result indicates the possibility of using a larger distance between transducer sin high frequency health monitoring systems of concrete structures, where attenuation of propagating waves is strong. [1]
© 2019, IRJET | Impact Factor value: 7.211 | ISO 9001:2008 Certified Journal | Page 898
detecting damage reliable and efficient. This work focuseson the detection of damage by vibration analysis, whose main objective is to exploit the dynamic response of a structure to detect understand the damage. The experimental results are compared with those predicted by numerical models to confirm the effectiveness of the approach. The area of fault detection by vibration method relies on very different work. Some models require, others are choosing to work without a priori information. Yet these works have in common the multi-disciplinary aspect and state of knowledge of the behaviour of a damaged structure such as the type of composite beam. [2]
Kaushar H. Barad et al. [2013] studied detection of the crack presence on the surface of beam-type structural element using natural frequency is presented. First two natural frequencies of the cracked beam have been obtained experimentally and used for detection of crack location and size. Detected crack locations and size are compared with the actual results and found to be in good agreement. Also, the effect of the crack location and the crack depth on the natural frequency is presented. The present method to detect crack location and size is fast and efficient. Crack with larger crack depth ratio (a/h) imparts greater reductions in natural frequency than that of the smaller crack depth ratio. Hence, the accuracy of results improves as crack depth increases. Crack present near to fixed end imparts greater reductions in natural frequency than that to present at away from the fixed end. [3]
S.J. Swillo and M. Perzyk [2013] the paper presents a vision based approach and neural network techniques in surface defects inspection and categorization. Depending on part design and processing techniques, castings may develop surface discontinuities such as cracks and pores that greatly influence the material’s properties Since the human visual inspection for the surface is slow and expensive, a computer vision system is an alternative solution for the online inspection. The defect inspection algorithm consists of several parameters that allow the user to specify the sensitivity level at which he can accept the defects in the casting. In addition to the developed image processing algorithm and vision system apparatus, an advanced learning process has been developed, based on neural network techniques. Finally, as an example three groups of defects were investigated demonstrates automatic selection and categorization of the measured defects, such as blowholes, shrinkage porosity and shrinkage cavity. [4]
Mr. Siddalingswami and S. Hiremath [2015] studied the casting process is the most widely used process in manufacturing industries especially in automotive products. Production of casting involves various processes like pattern making, molding, and core making and melting. It is very difficult to produce defect free castings.
A defect may be the result of a single cause or a combination of causes. The castings may have one or more defects. Foundries are still using trial and error methods to solve quality problems. There are benefits of using a more disciplined approach to define, identify and determine the root cause of the defect which is an expensive and error-prone process. This project presents a review on literature of different methods adopted by many foundries to reduce the percent of rejection. A new approach is proposed which may be helpful for foundries for controlling and reducing the defects. [5]
3. Non Destructive methods
Visual inspection is the primary non destructive testing method. In this method only surface related discontinuities and surface cracks can be detected. Large numbers of products are produced per day in a factory. Just to sort the product with poor surface finish or surface defect product is easy job for the worker and no extra time or money to be wasted is required. The second most important NDT test is ultrasonic testing in which internal cracks or defects can be identified by the change in frequency of the waves. The change in frequency is shown in wave form and defect size can be identified. Liquid penetrating testing is done on the surface of the material. Large pipe lines carrying gas or petroleum are checked with by liquid penetrant test regularly to identify surface cracks and reduce the defect. X-Ray technique is also one of the useful non destructive techniques to identify the defects in materials. The greater penetration power allows the rays to pass through material and identify defects by filming the ray intensity
4. Problem identification
© 2019, IRJET | Impact Factor value: 7.211 | ISO 9001:2008 Certified Journal | Page 899
4.1 Pole Shoe Carbon Steel
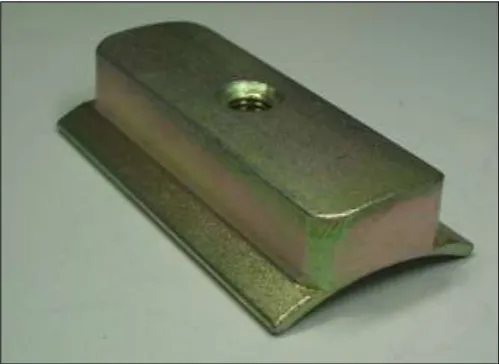
A DC motor like we know converts electrical energy into mechanical energy and this is essentially brought about by many essential parts. One of the major part which plays an important role is pole shoe. The magnetic poles of DC motor are fitted onto inner wall of yoke with screws. The construction of magnetic poles basically comprises of two parts, the pole core and the pole shoe. These two structures are assigned for two different purposes, the pole core is small cross-sectional area and its function is to hold pole shoe over the yoke, whereas pole having large cross-sectional area spreads the flux produced over the air gap between stator and rotor to reduce the loss due to reluctance. The pole shoe also carries slot for the field windings that produce the field flux.
[image:3.595.312.565.241.414.2]Pole shoe enlarges the area of armature core to come across the flux which is necessary to produce larger induced e.m.f. To achieve this, pole shoe has been given a particular shape. The pole shoe is made up of magnetic material like carbon steel. As it requires definite shape and size, laminated construction is used.
Fig.1. Pole shoe structure
5. Description of set-up
The proposed method involves creation of vibration response of pole shoe to be tested by striking a brass tong onto the component at various intensity and study the peak acceleration. Displacement and frequency of the holding pad to determine the maturity and confirm the non-destructive. The motor is a 12 V DC motor variable speed, which will rotate the cam plate, which turns the lever about the hinge thereby deflecting the tension spring during rise of the cam, the cam plate is designed such that the lever is released at the end of rise i.e., the dwell of cam plate is zero at a particular instance thereby releasing the entire energy of the tension spring instantaneously making the lever to travel downward and strike the tong
onto the pole shoe at a particular intensity governed by the speed of the motor. The striking of the tong will generate a set of vibrations in the component which will be transmitted to the nylon-66 pad. These vibrations will be measured for study the peak acceleration, displacement and frequency of the holding pad to determine the maturity and confirm the non-destructive of the component. The probe will either be connected direction to the vibrometer set-up to note the readings of above said parameters manually or logging it to PC by use of RS232 cable.
Fig. 2 Setup schematic diagram
6. Design of set-up components
i) Design of input shaft
Material selection for input shaft
Designation UTS Yield strength
[image:3.595.37.287.380.562.2]© 2019, IRJET | Impact Factor value: 7.211 | ISO 9001:2008 Certified Journal | Page 900
ii) Design of cam plateMaterial selection for cam plate
Designation UTS Yield strength
EN24 800 680
iii) Design of jaw
Material selection for jaw
Designation Tensile strength Yield strength
Nylon-66 62 48
iv) Design of striker arm
Material selection for striker arm
Designation Tensile strength Yield strength
EN9 650 480
v) Design of tong
Material selection for tong
Designation Tensile strength Yield strength
Brass 70 54
7. Design Analysis of set-up components
i) Analysis of input shaft
Part
name Max ther. stress(N/ mm2)
Von-misses stress(N/m m2)
Max deformatio n(mm)
Result
Input
shaft 242 5.7 0.0018 Safe
ii) Analysis of cam plate
Part
name stress(N/Max ther. mm2)
Von-misses stress(N/m
m2)
Max deforma tion(mm
)
Result
Cam
© 2019, IRJET | Impact Factor value: 7.211 | ISO 9001:2008 Certified Journal | Page 901
iii) Analysis of jawPart
name Max ther. stress(N/ mm2)
Von-misses stress(N /mm2)
Max deformati on(mm)
Result
Jaw 0.572 3.59 0.0013 Safe
iv) Analysis of striker arm
Part
name Max ther. stress(N /mm2)
Von-misses stress(N /mm2)
Max deformati on(mm)
Result
Striker
arm 31.2 38.3 0.054 Safe
iv) Analysis of tong
Part
name Max ther. stress(N /mm2)
Von-misses stress(N /mm2)
Max deformati on(mm)
Result
Tong 1.01 0.515 2.65 Safe
8. Experimental set-up
The experimental set-up is shown in the below figure. Various factors are taken into consideration while designing the set-up. Performance of NDT on pole shoe is done by using frequency response setup. Development and analysis of setup is done by using Ansys 15. Frequency, displacement and Acceleration readings are taken by using vibrometer. The setup consists of 12V dc motor, helical spring, fixed and movable jaw, pole shoe components, brass tong and electrical 2 way switch. The pole shoe is held between movable and fixed jaw. Then the pole shoe is placed on nylon pad for vibrations to pass.
Fig.3 . Frequency response set-up
9. CONCLUSION
© 2019, IRJET | Impact Factor value: 7.211 | ISO 9001:2008 Certified Journal | Page 902
ACKNOWLEDGEMENT
The authors would like to thank Mr. Nitin Pardeshi, Owner of Dakshtech Engineering Pvt Ltd Aurangabad, for providing all the necessary facilities to perform experiment with effective support. The inspiration and support helped us to complete the research work.
REFERENCES
[1] P. Frojd and P. Ulriksen, Amplitude and phase measurements of continuous diffuse fields for structural health monitoring of concrete structures, NDT&E International, 77, 2016, pp. 35-41.
[2] Missoum Lakhdar, Djermane Mohammed, Labbaci Boudjemaa, Abdeldjebar Rabia, Moudden Bachir, Damages detection in a composite structure by vibration analysis, TerraGreen 13 International Conference Advancements in Renewable Energy and Clean Environment, 2013, pp. 888-897.
[3] Kaushar H. Barad, D. S. Sharma, Vishal Vyas, Crack detection in cantilever beam by frequency based method, Chemical, Civil and Mechanical Engineering Tracks of 3rd Nirma University International Conference on Engineering, 2013, pp. 770 – 775.
[4] S.J. Świllo and M. Perzyk, Surface Casting Defects Inspection Using Vision System and Neural Network Techniques, Archives Of Foundry Engineering, Volume 13 Issue 4/2013, pp 103 – 106.
[5] Mr. Siddalingswami and S. Hiremath, Advanced Techniques in Casting Defects and Rejection Analysis: A Study in an Industry, IJIERT, Vol. 2, 2015.
BIOGRAPHIES
Mr. Shailendra A Kalugade, PG Student, B.E (Production), M.E. (Mech-Prod) (Pursuing), KIT’s College of Engineering, Kolhapur
Asst Prof. S. M. Kadane (Dept of Production Engineering) KIT’s College of Engineering, Kolhapur M.E(Mech-Prod),C/DAC,
Publications-08