Title page
1Article type: Perspectives
2
Article title: Building up biogeography: pattern to process
3
Running head: Building up biogeography: pattern to process
4
Authors: William D. Pearse1∗, A. M´arcia Barbosa2, Susanne A. Fritz3, Sally A. Keith4,
5
Luke J. Harmon5, John Harte6, Daniele Silvestro7, Xiao Xiao8, & T. Jonathan Davies9
6
1 Department of Biology & Ecology Center, Utah State University, 5305 Old Main Hill,
7
Logan UT, 84322 8
2CIBIO/InBIO, Universidade de ´Evora, 7004-516 ´Evora, Portugal
9
3Senckenberg Biodiversity and Climate Research Centre (BiK-F), Senckenberg Gesellschaft
10
f¨ur Naturforschung, Senckenberganlage 25, 60325 Frankfurt, Germany 11
Institute of Ecology, Evolution and Diversity, Goethe University, Max-von-Laue-Str. 13, 12
60438 Frankfurt (Main), Germany 13
4Center for Macroecology, Evolution & Climate, Natural History Museum of Denmark,
Uni-14
versity of Copenhagen, Copenhagen 2100, Denmark. 15
Lancaster Environment Centre, Lancaster University, Lancaster, LA1 4YQ, UK 16
5Department of Biological Sciences, University of Idaho, 875 Perimeter Lane, MS 3051,
17
Moscow, ID 83843 USA 18
6The Energy and Resources Group, The University of California at Berkeley, Berkeley, CA
19
94720 20
7Department of Biological and Environmental Sciences, University of Gothenburg, Carl
Skottsbergs gata 22B, Gothenburg 413 19, Sweden 22
Gothenburg Global Biodiversity Centre, Box 461, SE-405 30 Gothenburg, Sweden 23
Department of Computational Biology, University of Lausanne, 1015 Lausanne, Switzer-24
land 25
8School of Biology and Ecology, and Senator George J. Mitchell Center for Sustainability
26
Solutions, University of Maine, Orono ME 04469 27
9 Department of Biology, McGill University, Montr´eal, QC, Canada
28
Departments of Botany and Forest & Conservation Sciences, University of British Columbia, 29
6270 University Blvd, Vancouver, BC, V6T 1Z4, Canada 30
∗To whom correspondence should be addressed: [email protected].
31
Word-count: 5680 (abstract, main text, acknowledgements, and references)
Abstract
33Linking pattern to process across spatial and temporal scales has been a key goal of the field of 34
biogeography. In January 2017, the 8thbiennial conference of the International Biogeography
35
Society sponsored a symposium on“Building up biogeography—process to pattern”that aimed 36
to review progress towards this goal. Here we present a summary of the symposium, in which 37
we identified promising areas of current research and suggested future research directions. 38
We focus on (1) emerging types of data such as behavioral observations and ancient DNA, 39
(2) how to better incorporate historical data (such as fossils) to move beyond what we term 40
‘footprint measures’ of past dynamics, and (3) the role that novel modeling approaches (e.g., 41
maximum entropy theory of ecology and approximate Bayesian computation) and conceptual 42
frameworks can play in the unification of disciplines. We suggest that the gaps separating 43
pattern and process are shrinking, and that we can better bridge these aspects by considering 44
the dimensions of space and time simultaneously. 45
Keywords: approximate Bayesian computation (ABC), behavior, fossils, macroecology,
46
Introduction
48Linking pattern to its underlying process has long been the Holy Grail of macroecology. How-49
ever, mechanistic and process-based models are often formulated at small spatio-temporal 50
scales, whereas biogeographic patterns usually emerge at broader scales. Historically, sta-51
tistical models have offered a unifying, predictive framework that can operate across scales, 52
but to do so often requires that we sacrifice explicit consideration of ecological and evo-53
lutionary mechanisms (see McGill 2010). For example, while regional variation in species 54
richness is often readily predicted by environmental conditions (Currie et al. 1999), the pre-55
cise evolutionary and ecological processes underlying such relationships remain unresolved. 56
It is often difficult to understand any kind of pattern in a biogeographical context because 57
it is impossible to conduct experiments at the appropriate temporaland spatial scales, such 58
that we biogeographers (unlike other biologists) are often limited to correlative and observa-59
tional studies. New approaches offer possibilities to integrate evolutionary and biogeographic 60
processes of dispersal, speciation and extinction into dynamic models of community struc-61
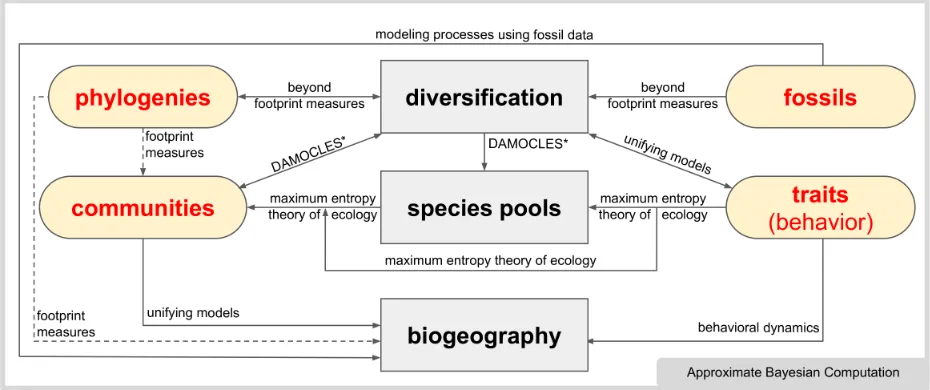
ture (such as the ‘DAMOCLES’ approach described by Pigot & Etienne 2015, see figure 62
1). Scaling up such models to encompass regional biodiversity gradients is an important 63
next step (Cabral et al. 2017). In this and many other cases, we believe that it is possible 64
to better link underlying processes to emerging patterns, and our symposium on Building
65
up biogeography—process to pattern held at the 8th biennial conference of the International 66
Biogeography Society in Tucson, Arizona, described recent progress in this direction. Here, 67
we summarize these advances. Three themes emerge throughout this discussion: (1) the 68
importance of incorporating data from multiple sources and disciplines (e.g., behavioral 69
observations and mini-satellites), (2) the need to move beyond ‘footprint measures’ by incor-70
porating historic processes into models of contemporary data and (3) the power of recently 71
developed models to address biogeographical questions across spatial and temporal scales. 72
thorough review of all the ways in which biogeographic processes act across scales (c.f.Levin 74
1992; Cavender-Bares et al. 2009; Chave 2013; Cabral et al. 2017), but within figure 1 we 75
show how these concepts fit within the broader biogeography framework linking the drivers 76
of biogeographic patterns and processes. We focus on how processes interact across different 77
spatial and temporal scales, not on ascribing processes to particular spatio-temporal scales 78
(c.f.Weiher & Keddy 2001; Swenson et al. 2007; Cavender-Bares et al. 2009), and we believe 79
focusing in this way holds promise in making practical progress fitting mechanistic models 80
to data. We conclude that we are moving towards a productive synthesis of pattern- and 81
process-based methods that will provide new and more generalizable insights into the spatial 82
and temporal distributions of biodiversity. 83
Non-traditional data in biogeography
84Targeted collection of observational data. While macroecology has traditionally
ad-85
vanced through drawing inference from pre-existing data (i.e., data the researcher did not 86
collect themselves), it is increasingly recognized that experiments can also be placed within 87
a macroecological context (Paine 2010; Alexander et al. 2016). Such experiments form one 88
non-traditional source of data in biogeography, but we (uncontroversially, we hope) suggest 89
that macroecologists should not forget the importance of collecting new, carefully consid-90
ered, observational data. Collecting data that directly address a question or mechanism of 91
interest is a more efficient way to understand a problem than implementing post-hoc sta-92
tistical corrections. For example, Keith et al. (2016) collected data on the timing of coral 93
spawning in 34 reefs throughout the Indian and Pacific Oceans and, through a combination 94
of careful site selection and the collection of relevant explanatory data, identified the likely 95
cues of coral spawning (namely, seasonal rise in ocean temperature). These data move us 96
Figure 1: Conceptual overview of the processes involved in the assembly of
bio-geographical patterns. We focus on how data (rounded corners) integrate with biological
ing through the explicit collection of small-grain large-extent data, which in turn can shed 98
light on the spatio-temporal biogeographic distribution of corals. Moreover, this work uses 99
traditional biogeography to set the agenda for future experimental tests (e.g., temperature 100
manipulations)—an approach that is potentially fruitful across biogeography more widely. 101
Such precise data on the timing of coral spawning could (almost certainly) not have been 102
collated from existing sources: testing different mechanisms often requires targeted data 103
collection, not simply the collation of ever-larger data that elucidate general patterns. 104
Behavioral data. One type of data that has been incorporated only rarely in biogeographic
105
studies is behavioral observations. While behavioral data might be measured on very different 106
spatial scales to the data usually included in biogeographic models, such data could provide 107
invaluable insight into the link between pattern and process. Individuals make cognitive 108
decisions to enact particular behaviors given a combination of external stimuli and internal 109
motivation. For instance, the presence of food and motivation of hunger could initiate 110
foraging behavior. However, these behaviors, and their underlying decision-making processes, 111
can become sub-optimal in novel environments because of an inability to accurately process 112
novel external information [such as mistaken mate identification as described by Gwynne 113
& Rentz (1983); see also Whitehead et al. (2004)]. Sub-optimal behavior at the individual 114
level could feasibly scale up to cause population level declines and subsequent shifts in 115
biogeographical patterns such as species’ distributions. Using, for example, coupled dynamic 116
individual-based and species distribution models it is possible to propagate the outcomes 117
of such local-scale behavioral dynamics to produce biogeographic patterns (see ‘behavioral 118
dynamics’ in figure 1). For example, individual-based models can be used to generate decision 119
rules that can inform about species’ environmental preferences and tolerances, which can be 120
propagated through into distribution models to improve predictions, and to test whether 121
behavior is constant through space and time (reviewed in Keith & Bull 2017). The kinds 122
of behavioral data to best inform such models will depend on the particular question and 123
may be best gathered specifically to shed light on, for example, the dispersal mechanisms 125
for the clade of interest. Data on phenology or other physiological responses to changing 126
environmental stimuli are already informing the study of biogeography in organisms other 127
than animals (Chuine 2010). 128
Emerging data sources. There are perhaps three additional kinds of data that, we
be-129
lieve, have the potential to fundamentally change the way in which biogeography operates, 130
but it is of course too soon to be certain. The first is ancient DNA: DNA extracted and 131
sequenced from historic specimens (Gugerli et al. 2005; P¨a¨abo et al. 2004). Such data form 132
a natural bridge between phylodynamic models commonly used to infer historic population 133
size (Archie et al. 2009; Lemey et al. 2010, which are commonly used in epidemiology;) and 134
the fossil data whose use we advocate below. The second is intra-specific trait variation; ad-135
vances in automated image analysis and measurement protocols (Bucksch et al. 2014; Pearse 136
et al. 2016) allow researchers to collect more data than previously thought possible. This 137
has given biogeographers the data to move beyond the simplifying assumption that varia-138
tion within a species is negligible and random with respect to environment (Bolnick et al. 139
2011). It is difficult (but, of course, not impossible) to extend the modeling approaches to 140
incorporate variation of species traits in response to environmental conditions; it may be 141
more straightforward to do so by collecting data on how species’ traits are non-stationary 142
and modeling those data themselves. Finally, drones (Anderson & Gaston 2013; Linchant 143
et al. 2015) and small satellites (Baker & Worden 2008; Sandau 2010) are expanding both 144
the temporal and spatial grain across which we can measure biogeographical patterns. If 145
we are to truly bridge spatial scales and wish to model uncertainty in species’ distributions 146
(particularly using quantum approaches—see below), then the increased resolution provided 147
Beyond ‘footprint measures’ of past dynamics
149Integrating phylogenetic information. Biogeographers often try to infer underlying
150
processes from stationary present-day patterns, but it is increasingly clear that deep-time 151
history is important (Ricklefs 2004; Wiens & Donoghue 2004). Such deep-time history have 152
been accounted for in two key ways: by measuring (1) species’ shared evolutionary history 153
(Webb et al. 2002), or (2) past environmental change and dispersal lags (e.g., Sandel et al. 154
2011; Kissling et al. 2016). Yet in both of these cases, biogeographic history, macroevolution-155
ary processes, or past environmental dynamics are reduced to “footprint measures” that sum 156
up accumulated change [see ‘(beyond) footprint measures’ in figure 1]. Thus, for purposes 157
here, we consider any metric that sums across an entire time series or phylogeny and reduces 158
it to a single datum as a ‘footprint measure’. Historical data have transformed our under-159
standing of recent environmental change (Foley et al. 2005; Parmesan 2006) and species’ 160
invasions (Duncan et al. 2003; Dehnen-Schmutz et al. 2007), but new data and methods 161
mean there is no need to limit ourselves to historical footprints when addressing processes 162
operating over longer timescales (Hunt & Slater 2016). For example, Fritz et al. (2016) use 163
long-term paleontological datasets to show a consistent diversity-productivity relationship 164
within North American and European mammal and plant fossil records between 23 and 2 165
million years ago. Present-day data do not match this relationship, likely because Pleis-166
tocene climatic oscillations and human impacts reduced mammalian diversity and terrestrial 167
primary production (Barnosky 2008; Faurby & Svenning 2015; Doughty et al. 2016). Simi-168
larly, Pearse et al. (2013) used information from phylogeny to show a tendency for members 169
of younger clades to co-occur with one-another more often than older clades, even millions 170
of years after the clade originated. This perhaps reflects rapid niche evolution of diversify-171
ing clades, and, by examining the interaction between evolutionary history and community 172
structure, exposes an observable link between niche evolution and ecological assembly (see 173
diversified more rapidly in the recent evolutionary past, in terms of both number of species 175
and traits, co-occur more frequently or form more/less stable assemblages in the present day. 176
Both these examples show how general ecological rules ought not to be inferred exclusively 177
from past or extant data, but rather from the mapping of past onto extant data. 178
Modeling processes using fossil data. Another aspect of biogeography that is being
179
revolutionized by moving beyond footprints is the evolution of species’ geographic ranges, 180
where (unlike the examples given above) process-based models are increasingly being fit to 181
data. While methodological development in this field has been tremendous (e.g., Matzke 182
2014; Tagliacollo et al. 2015), the ability of purely phylogenetic methods to reliably infer 183
rates of dispersal and extirpation remains limited, even when we simulate data under very 184
simple models (e.g., constant and symmetric rates). Fossil occurrence data provide an al-185
ternative source of information about the evolution of biogeographic ranges through time, 186
and arguably represent the most direct evidence of the processes under study, but fossil data 187
are notoriously incomplete. Silvestro et al. (2016) have shown that dispersal and extirpation 188
rates can be accurately estimated from fossil lineages if fossil preservation is explicitly mod-189
eled, and that dispersal rates are more variable through time and between geographic areas 190
than commonly assumed in purely phylogenetic models. Perhaps most importantly, Silvestro 191
et al. also show that fossil-estimated extirpation rates are much higher than the near-zero 192
estimates typically obtained from neontological data. Thus fossil data need not only be used 193
to improve the dating of phylogenetic trees (as is common; reviewed in Donoghue et al. 1989; 194
Rutschmann 2006), but can also be used to augment phylogenetic inferences of historical bio-195
geography and more accurately measure variation in dispersal and extinction through time. 196
Fossils provide data that shed light on the processes that affect diversification (of species 197
and of traits) and range evolution, providing information on both time and place that can 198
inform models fit jointly to phylogenetic and fossil data (Hunt & Slater 2016). Many open 199
access databases of fossils that contain data on location, age, and morphology/traits are now 200
rich seam for biogeographical analysis. 202
Unifying models and concepts
203Maximum entropy theory in ecology (METE). The integration of mechanism into
204
statistical models has long been a major challenge in macroecology. Rapid progress means 205
that we now possess conceptual frameworks that combine the explanatory power of statis-206
tical tools with the biological insight that mechanistic models can provide. Starting only 207
with a small number of measured state variables and no parameters, the maximum entropy 208
theory in ecology (METE; Harte et al. 2015, ; see also ‘METE’ in figure 1) predicts the func-209
tional form of multiple macroecological patterns, such as the species abundance distribution 210
and variation in individual body size. These statistical insights have informed debates that 211
have raged for decades within ecology, such as what underlies variation in the species-area 212
curve (Harte et al. 2009). From hundreds of empirical tests a generalization has emerged: 213
in ecosystems with constant state variables METE performs well, but in ecosystems under-214
going shifts METE fits data poorly. For those ecosystems in which the state variables are 215
changing, a hybrid METE–mechanism-based approach (DynaMETE) might be more appro-216
priate, in which dynamic state variables are driven by explicit mechanisms. This promising 217
theory of ecosystems undergoing change, either in response to human influence or to natural 218
disturbance regimes, has the potential to unify statistical and mechanistic approaches. More 219
detail on the expanding range of METE-like models that can incorporate non-equilibrium 220
dynamics can be found in (Rominger et al. 2017). 221
Quantum biogeography. An alternative framework which, like METE, also draws from
222
the physics literature, is to treat species as analogous to quantum particles. As species 223
distributions are dynamic, precise locations are only known when they are observed and 224
species’ distribution may be better represented by a wave-function, or an analogous dis-226
tribution function, that describes the relative likelihood of presence at given locations (see 227
‘quantum biogeography’ in figure 1; Real et al. 2017). Acknowledging that species’ like-228
lihood of occurrence is continuous, not discrete, has advanced prediction and inference of 229
species’ distributions (Guillera-Arroita et al. 2015) and assembly patterns (Karger et al. 230
2016), and quantum-inspired approaches may continue this trend. A fruitful next step may 231
be to incorporate behavior into similar waveform functions, unifying uncertainty, behavior, 232
and macro-scale distribution data. 233
Approximate Bayesian computation. METE and the frameworks developed from it
234
have been criticized for their mathematical complexity. For those who prefer to simulate 235
rather than to solve, approximate Bayesian computation (ABC) has emerged as a way to 236
contrast the influence of different mechanisms [see Beaumont (2010) for a thorough review; 237
but also Robert et al. (2011)]. Informally, ABC involves simulating a system (e.g., pop-238
ulations migrating at specified rates) with existing data as starting points under different 239
parameters (e.g., migration rates) and defined statistical metrics (e.g., average range size). 240
ABC is thus a model-fitting framework, like maximum likelihood, and not a particular model 241
formulation. An ABC model is declared a good fit if the metrics of the simulations and data 242
are similar, and so ABC does require the careful selection of sensitive and appropriate sum-243
mary statistics. While ABC is computationally intensive, its flexibility allows the testing of 244
almost any model we can conceive and implement. Clarke et al. (2017) used ABC to model 245
inter-specific competition on phylogenies, addressing theory that has proven difficult to test 246
[Nuismer & Harmon (2015); but see Drury et al. (2016)]. There is a pressing need for more 247
such work, testing, for example, whether clades whose trait evolution has been shaped by 248
competition are still competing in the present, or whether that past evolution has mitigated 249
competition in the present. 250
Integration through concepts rather than equations. Building cross-scale models
that produce broad-scale patterns from process-based models may seem challenging, but it 252
can be done. Alongside the approaches outlined above, Albert et al. (2017) provide another 253
excellent example of cross-scale modeling. Focusing on a single process—the effects of river 254
capture in changing species’ geographic distributions—Albert et al. simulate realistic broad-255
scale diversification dynamics using local-scale dispersal limitation. Such approaches that 256
connect disparate ideas and processes (in this case, dispersal limitation and river capture) 257
have more potential than approaches that only connect to specific patterns (e.g., changes 258
in diversification rate). Scales and disciplines are united by concepts formalized as equa-259
tions, but even if two disciplines use similar terms it does not necessarily follow that the 260
processes are the same. For example, Ornstein-Uhlenbeck (OU) models of trait evolution 261
have a parameter,α, that describes the tendency of evolution to remain near some optimum. 262
This parameter is often referred to as a ‘selection’ parameter, largely because OU models 263
are used to represent constant stabilizing selection in quantitative genetics. However, em-264
pirical studies have shown conclusively that the quantitative genetics version of OU models 265
differs from the macroevolutionary version [e.g., Harmon et al. (2010), but see also Uyeda 266
& Harmon (2014)]. Shared terminology and models alone do not unify the two fields of 267
quantitative genetics and macroevolution: unification comes not from models or equations, 268
but from concepts. To give another example, incorporating equations from quantum theory 269
into species distribution modeling, as proposed by Real et al. (2017), may be a useful way 270
to advance one field by borrowing concepts from another, but does not reflect a meaningful 271
unification of quantum and biogeographic theory. Biogeography has greatly benefited from 272
the sharing of theory across disciplines, and we hope that this continues, but such exchange 273
will be more fruitful when we consider whether not just mathematics but also concepts are 274
Conclusion and future directions
276We frequently consider biogeographic processes operating at different temporal and/or spa-277
tial scales, but it is often difficult in practice to ‘scale up’ (or down). By including new data 278
into process-based models, especially those with a temporal dimension, we might be able to 279
better connect across scales. The paleontological record has always informed our understand-280
ing of species’ biogeographical histories and can greatly enhance inference from phylogeny 281
(Lieberman 2002; Jackson & Erwin 2006; Brewer et al. 2012; Fritz et al. 2013), but the inte-282
gration of fossil data within newer macroecological methods has tended to lag behind that of 283
phylogenetic data. Data not typically incorporated within biogeographic analyses, such as 284
species’ behavioral responses, provide information at a much finer temporal resolution, but 285
can similarly be used to construct scale-able process-based models. Despite recent advances 286
and exciting prospects for the future, the identification of generalizable models that can 287
improve the link from process to pattern remains elusive (Cabral et al. 2017). However, the 288
gaps that artificially separate pattern and process in our concepts and analyses are shrinking, 289
and by considering the dimensions of space and time simultaneously, we will be able to link 290
them with stronger bridges. The development of new methodological frameworks, such as 291
METE and ABC, provides the power and flexibility to move us towards a more complete 292
understanding of how processes produce patterns across spatio-temporal scales. It is exciting 293
to think that many of the conceptual linkages we outlined in figure 1 can now be explicitly 294
modeled, as we outline in figure 2. What strikes us most when looking at this figure is the 295
linkages across data-types: it is now possible to integrating so many different kinds of data in 296
a single model that the range of questions we can now ask has increased substantially. 297
We do not wish to suggest that the concepts we discuss here encompass all the exciting new 298
advances in the field of biogeography, but throughout this essay we have articulated three 299
areas that we have focused upon in our own research and that inspired our symposium at 300
Figure 2: Questions that can be answered about the nature of spatio-temporal
scaling using the approaches outlined in this essay. As an accompaniment to
figure 1, we present here a figure with the same layout, only now each source of data has been replaced with a published dataset [Breeding Bird Survey—(Sauer et al. 1966); PaleoDB—https://paleobiodb.org/; global bird phylogeny—(Jetz et al. 2012); global bird traits—(Wilman et al. 2014)] and each methodological arrow with a question that can be answered.
of non-traditional data, such as the dispersal behaviors of species on a landscape, which 302
has improved our understanding of the mechanisms underlying biogeographical patterns. 303
(2) Moving beyond ‘footprint measures’ of deep-time patterns to shed light on how past 304
mechanisms have shaped present-day ecological dynamics. (3) Utilizing empirical frameworks 305
such as METE and ABC to test specific hypotheses that, even a decade ago, were only 306
conceptual frameworks (e.g., figure 1). It is our hope that these three avenues provide a way 307
forward for biogeographers to continue to advance our understanding of how processes vary 308
across spatial and temporal scales. 309
Acknowledgements
310We are grateful to the International Biogeography Society for funding and organizing the 311
(Peter Linder) for encouraging us to submit this summary. We are grateful to all who 313
attended the symposium, and in particular James Albert. BG Waring provided useful feed-314
back, as did two anonymous reviewers and Juliano Sarmento Cabral. AMB is supported 315
by FCT (Portugal) and by FEDER/COMPETE 2020 through contract IF/00266/2013, ex-316
ploratory project CP1168/CT0001, and funds POCI-01-0145-FEDER-006821 to research 317
unit UID/BIA/50027. SAK is supported by the VILLUM Foundation (grant number 10114) 318
and the Danish National Research Foundation through support to the Center for Macroecol-319
ogy, Evolution and Climate (grant number DNRF96). LJH is supported under a grant from 320
the National Science Foundation (NSF DEB 1208912). DS is supported by a grant from the 321
Swedish Research Council (2015-04748). SF is supported by the German Research Foun-322
dation (DFG Emmy Noether grant FR 3246/2-1). TJD is funded by Fonds de Recherche
323
References
325Albert, J. S., Schoolmaster JR., D. R., Tagliacollo, V., & Duke-Sylvester, S. M. (2017). 326
Barrier displacement on a neutral landscape: toward a theory of continental biogeography. 327
Systematic Biology 66.2, 167. 328
Alexander, J. M., Diez, J. M., Hart, S. P., & Levine, J. M. (2016). When climate reshuffles 329
competitors: a call for experimental macroecology. Trends in Ecology & Evolution 31.11, 330
831–841. 331
Anderson, K. & Gaston, K. J. (2013). Lightweight unmanned aerial vehicles will revolutionize 332
spatial ecology.Frontiers in Ecology and the Environment 11.3, 138–146. 333
Archie, E. A., Luikart, G., & Ezenwa, V. O. (2009). Infecting epidemiology with genetics: a 334
new frontier in disease ecology.Trends in Ecology & Evolution 24.1, 21–30. 335
Baker, D. N. & Worden, S. P. (2008). The Large Benefits of Small-Satellite Missions. EOS,
336
Transactions American Geophysical Union 89.33, 301–302. 337
Barnosky, A. D. (2008). Megafauna biomass tradeoff as a driver of Quaternary and future 338
extinctions. Proceedings of the National Academy of Sciences 105.Supplement 1, 11543– 339
11548. 340
Beaumont, M. A. (2010). Approximate Bayesian Computation in evolution and ecology. 341
Annual Review of Ecology, Evolution, and Systematics 41, 379–406. 342
Bolnick, D. I., Amarasekare, P., Ara´ujo, M. S., B¨urger, R., Levine, J. M., Novak, M., Rudolf, 343
V. H., Schreiber, S. J., Urban, M. C., & Vasseur, D. A. (2011). Why intraspecific trait 344
variation matters in community ecology.Trends in ecology & evolution 26.4, 183–192. 345
Brewer, S., Jackson, S. T., & Williams, J. W. (2012). Paleoecoinformatics: applying geohis-346
torical data to ecological questions.Trends in Ecology & Evolution 27.2, 104–112. 347
Bucksch, A., Burridge, J., York, L. M., Das, A., Nord, E., Weitz, J. S., & Lynch, J. P. 348
(2014). Image-based high-throughput field phenotyping of crop roots. Plant Physiology
349
Cabral, J. S., Valente, L., & Hartig, F. (2017). Mechanistic simulation models in macroecol-351
ogy and biogeography: state-of-art and prospects. Ecography 40.2, 267–280. 352
Cavender-Bares, J., Kozak, K., Fine, P. V. A., & Kembel, S. W. (2009). The merging of 353
community ecology and phylogenetic biology.Ecology Letters 12, 693–715. 354
Chave, J. (2013). The problem of pattern and scale in ecology: what have we learned in 20 355
years? Ecology Letters 16.s1, 4–16. 356
Chuine, I. (2010). Why does phenology drive species distribution?Philosophical Transactions
357
of the Royal Society of London B: Biological Sciences 365.1555, 3149–3160. 358
Clarke, M., Thomas, G. H., & Freckleton, R. P. (2017). Trait evolution in adaptive radi-359
ations: modeling and measuring interspecific competition on phylogenies. The American
360
Naturalist 189.2, 121–137. 361
Currie, D. J., Francis, A. P., & Kerr, J. T. (1999). Some general propositions about the study 362
of spatial patterns of species richness. Ecoscience 6.3, 392–399. 363
Dayan, T. & Simberloff, D. (2005). Ecological and community-wide character displacement: 364
the next generation.Ecology Letters 8.8, 875–894. 365
Dehnen-Schmutz, K., Touza, J., Perrings, C., & Williamson, M. (2007). A century of the 366
ornamental plant trade and its impact on invasion success. Diversity and Distributions
367
13.5, 527–534. 368
Donoghue, M. J., Doyle, J. A., Gauthier, J., Kluge, A. G., & Rowe, T. (1989). The importance 369
of fossils in phylogeny reconstruction.Annual review of Ecology and Systematics 20.1, 431– 370
460. 371
Doughty, C. E., Faurby, S., Wolf, A., Malhi, Y., & Svenning, J.-C. (2016). Changing NPP 372
consumption patterns in the Holocene: from megafauna-‘liberated’ NPP to ‘ecological 373
bankruptcy’.The Anthropocene Review 3.3, 174–187. 374
Drury, J., Clavel, J., Manceau, M., & Morlon, H. (2016). Estimating the effect of competition 375
Duncan, R. P., Blackburn, T. M., & Sol, D. (2003). The Ecology of Bird Introductions. 377
Annual Review of Ecology, Evolution, and Systematics 34.1, 71–98. 378
Faurby, S. & Svenning, J.-C. (2015). Historic and prehistoric human-driven extinctions have 379
reshaped global mammal diversity patterns.Diversity and Distributions21.10, 1155–1166. 380
Foley, J. A., DeFries, R., Asner, G. P., Barford, C., Bonan, G., Carpenter, S. R., Chapin, 381
F. S., Coe, M. T., Daily, G. C., Gibbs, H. K., et al. (2005). Global consequences of land 382
use. science 309.5734, 570–574. 383
Fritz, S. A., Eronen, J. T., Schnitzler, J., Hof, C., Janis, C. M., Mulch, A., B¨ohning-Gaese, K., 384
& Graham, C. H. (2016). Twenty-million-year relationship between mammalian diversity 385
and primary productivity.Proceedings of the National Academy of Sciences 113.39, 10908– 386
10913. 387
Fritz, S. A., Schnitzler, J., Eronen, J. T., Hof, C., B¨ohning-Gaese, K., & Graham, C. H. 388
(2013). Diversity in time and space: wanted dead and alive.Trends in Ecology & Evolution
389
28.9, 509–516. 390
Gill, J. L., Williams, J. W., Jackson, S. T., Lininger, K. B., & Robinson, G. S. (2009). 391
Pleistocene megafaunal collapse, novel plant communities, and enhanced fire regimes in 392
North America.Science 326.5956, 1100–1103. 393
Goldberg, E. E., Roy, K., Lande, R., & Jablonski, D. (2005). Diversity, endemism, and age 394
distributions in macroevolutionary sources and sinks.The American Naturalist 165.6, 623– 395
633. 396
Goring, S., Dawson, A., Simpson, G., Ram, K., Graham, R. W., Grimm, E. C., & Williams, 397
J. W. (2015). Neotoma: a programmatic interface to the neotoma paleoecological database. 398
Open Quaternary 1, 1–17. 399
Gugerli, F., Parducci, L., & Petit, R. J. (2005). Ancient plant DNA: review and prospects. 400
New Phytologist 166.2, 409–418. 401
Guillera-Arroita, G., Lahoz-Monfort, J. J., Elith, J., Gordon, A., Kujala, H., Lentini, P. E., 402
for purpose? Matching data and models to applications.Global Ecology and Biogeography
404
24.3, 276–292. 405
Gwynne, D. & Rentz, D. (1983). Beetles on the bottle: male buprestids mistake stubbies for 406
females (Coleoptera). Austral Entomology 22.1, 79–80. 407
Harmon, L. J., Losos, J. B., Jonathan Davies, T., Gillespie, R. G., Gittleman, J. L., Bryan 408
Jennings, W., et al. (2010). Early bursts of body size and shape evolution are rare in 409
comparative data.Evolution 64.8, 2385–2396. 410
Harte, J., Rominger, A., & Zhang, W. (2015). Integrating macroecological metrics and com-411
munity taxonomic structure.Ecology Letters 18.10, 1068–1077. 412
Harte, J., Smith, A. B., & Storch, D. (2009). Biodiversity scales from plots to biomes with 413
a universal species–area curve.Ecology Letters 12.8, 789–797. 414
Hunt, G. & Slater, G. (2016). Integrating paleontological and phylogenetic approaches to 415
macroevolution. Annual Review of Ecology, Evolution, and Systematics 47, 189–213. 416
Jackson, J. B. & Erwin, D. H. (2006). What can we learn about ecology and evolution from 417
the fossil record?Trends in Ecology & Evolution 21.6, 322–328. 418
Jetz, W., Thomas, G., Joy, J., Hartmann, K., & Mooers, A. (2012). The global diversity of 419
birds in space and time.Nature 491.7424, 444. 420
Karger, D. N., Cord, A. F., Kessler, M., Kreft, H., K¨uhn, I., Pompe, S., Sandel, B., Sarmento 421
Cabral, J., Smith, A. B., Svenning, J.-C., et al. (2016). Delineating probabilistic species 422
pools in ecology and biogeography.Global Ecology and Biogeography. 423
Keith, S. A. & Bull, J. W. (2017). Animal culture impacts species’ capacity to realise climate-424
driven range shifts.Ecography 40.2, 296–304. 425
Keith, S. A., Maynard, J. A., Edwards, A. J., Guest, J. R., Bauman, A. G., Van Hooidonk, R., 426
et al. (2016). Coral mass spawning predicted by rapid seasonal rise in ocean temperature. 427
Kissling, W. D., Blach-Overgaard, A., Zwaan, R. E., & Wagner, P. (2016). Historical colo-429
nization and dispersal limitation supplement climate and topography in shaping species 430
richness of African lizards (Reptilia: Agaminae).Scientific Reports 6. 431
Kraft, N. J., Adler, P. B., Godoy, O., James, E. C., Fuller, S., & Levine, J. M. (2015). 432
Community assembly, coexistence and the environmental filtering metaphor. Functional
433
Ecology 29.5, 592–599. 434
Lemey, P., Rambaut, A., Welch, J. J., & Suchard, M. A. (2010). Phylogeography takes a 435
relaxed random walk in continuous space and time.Molecular biology and evolution 27.8, 436
1877–1885. 437
Levin, S. A. (1992). The problem of pattern and scale in ecology: the Robert H. MacArthur 438
award lecture. Ecology 73.6, 1943–1967. 439
Lieberman, B. S. (2002). Phylogenetic biogeography with and without the fossil record: gaug-440
ing the effects of extinction and paleontological incompleteness. Palaeogeography,
Palaeo-441
climatology, Palaeoecology 178.1, 39–52. 442
Linchant, J., Lisein, J., Semeki, J., Lejeune, P., & Vermeulen, C. (2015). Are unmanned 443
aircraft systems (UASs) the future of wildlife monitoring? A review of accomplishments 444
and challenges.Mammal Review 45.4, 239–252. 445
Matzke, N. J. (2014). Model selection in historical biogeography reveals that founder-event 446
speciation is a crucial process in island clades.Systematic Biology 63.6, 951. 447
McGill, B. J. (2010). Towards a unification of unified theories of biodiversity.Ecology Letters
448
13.5, 627–642. 449
Nuismer, S. L. & Harmon, L. J. (2015). Predicting rates of interspecific interaction from 450
phylogenetic trees.Ecology Letters 18.1, 17–27. 451
P¨a¨abo, S., Poinar, H., Serre, D., Jaenicke-Despr´es, V., Hebler, J., Rohland, N., Kuch, M., 452
Krause, J., Vigilant, L., & Hofreiter, M. (2004). Genetic analyses from ancient DNA.Annu.
453
Paine, R. T. (2010). Macroecology: does it ignore or can it encourage further ecological 455
syntheses based on spatially local experimental manipulations? The American Naturalist
456
176.4, 385–393. 457
Parmesan, C. (2006). Ecological and evolutionary responses to recent climate change.Annual
458
Review of Ecology, Evolution, and Systematics, 637–669. 459
Pearse, W. D., Cavender-Bares, J., Hobbie, S. E., Avolio, M., Bettez, N., Chowdhury, R. R., 460
Groffman, P. M., Grove, M., Hall, S. J., Heffernan, J. B., et al. (2016). Ecological homogeni-461
sation in North American urban yards: vegetation diversity, composition, and structure. 462
bioRxiv, 061937. 463
Pearse, W. D., Jones, A., & Purvis, A. (2013). Barro Colorado Island’s phylogenetic assem-464
blage structure across fine spatial scales and among clades of different ages.Ecology 94.12, 465
2861–2872. 466
Pigot, A. L. & Etienne, R. S. (2015). A new dynamic null model for phylogenetic community 467
structure. Ecology Letters 18.2, 153–163. 468
Real, R., Barbosa, A. M., & Bull, J. W. (2017). Species distributions, quantum theory, and 469
the enhancement of biodiversity measures.Systematic Biology 66.3, 453–462. 470
Ricklefs, R. E. (2004). A comprehensive framework for global patterns in biodiversity.Ecology
471
Letters 7.1, 1–15. 472
Robert, C. P., Cornuet, J.-M., Marin, J.-M., & Pillai, N. S. (2011). Lack of confidence in 473
approximate Bayesian computation model choice.Proceedings of the National Academy of
474
Sciences 108.37, 15112–15117. 475
Rominger, A., Overcast, I., Krehenwinkel, H., Gillespie, R., Harte, J., & Hickerson, M. (2017). 476
Linking evolutionary and ecological theory illuminates non-equilibrium biodiversity.arXiv
477
preprint arXiv:1705.04725. 478
Rutschmann, F. (2006). Molecular dating of phylogenetic trees: a brief review of current 479
Sandau, R. (2010). Status and trends of small satellite missions for Earth observation. Acta
481
Astronautica 66.1, 1–12. 482
Sandel, B., Arge, L., Dalsgaard, B., Davies, R. G., Gaston, K. J., Sutherland, W. J., & Sven-483
ning, J.-C. (2011). The influence of Late Quaternary climate-change velocity on species 484
endemism.Science 334.6056, 660–664. 485
Sauer, J., Hines, J., & Fallon, J. (1966). The North American breeding bird survey. Results
486
and analysis 2003. 487
Silvestro, D., Zizka, A., Bacon, C. D., Cascales-Minana, B., Salamin, N., & Antonelli, A. 488
(2016). Fossil biogeography: a new model to infer dispersal, extinction and sampling from 489
palaeontological data. Philosophical Transactions of the Royal Society B: Biological
Sci-490
ences 371.1691, 20150225. 491
Swenson, N. G., Enquist, B. J., Thompson, J., & Zimmerman, J. K. (2007). The influence of 492
spatial and size scale on phylogenetic relatedness in tropical forest communities. Ecology
493
88.7, 1770–1780. 494
Tagliacollo, V. A., Duke-Sylvester, S. M., Matamoros, W. A., Chakrabarty, P., & Albert, 495
J. S. (2015). Coordinated dispersal and pre-isthmian assembly of the central american 496
ichthyofauna. Systematic Biology, syv064. 497
Uyeda, J. C. & Harmon, L. J. (2014). A novel Bayesian method for inferring and interpret-498
ing the dynamics of adaptive landscapes from phylogenetic comparative data.Systematic
499
Biology 63.6, 902–918. 500
Webb, C. O., Ackerly, D. D., McPeek, M. A., & Donoghue, M. J. (2002). Phylogenies and 501
community ecology. Annual Review of Ecology and Systematics 33.1, 475–505. 502
Weiher, E. & Keddy, P. (2001). Ecological assembly rules: perspectives, advances, retreats. 503
Cambridge University Press. 504
Whitehead, H., Rendell, L., Osborne, R. W., & W¨ursig, B. (2004). Culture and conservation 505
of non-humans with reference to whales and dolphins: review and new directions.Biological
506
Wiens, J. J. & Donoghue, M. J. (2004). Historical biogeography, ecology and species richness. 508
Trends in Ecology & Evolution 19.12, 639–644. 509
Williams, J. W., Kharouba, H. M., Veloz, S., Vellend, M., McLachlan, J., Liu, Z., Otto-510
Bliesner, B., & He, F. (2013). The ice age ecologist: testing methods for reserve prioriti-511
zation during the last global warming. Global Ecology and Biogeography 22.3, 289–301. 512
Wilman, H., Belmaker, J., Simpson, J., Rosa, C. de la, Rivadeneira, M. M., & Jetz, W. 513
(2014). EltonTraits 1.0: Species-level foraging attributes of the world’s birds and mammals. 514