© 2019, IRJET | Impact Factor value: 7.211 | ISO 9001:2008 Certified Journal | Page 2401
Multi-Objective Optimization of WEDM Process Parameters of Ti-Ni
Shape Memory Alloy for Biomedical Application
Pankaj J. Patil
1, Prof. V. A. Kamble
21
PG Student Department of Mechanical Engineering Department of Mechanical Engineering D.K.T.E.’S Textile &
Engineering institute, Ichalkaranji, Shivaji University, Kolhapur, India
2
Assistant Professor Department of Mechanical Engineering Department of Mechanical Engineering D.K.T.E.’S
Textile & Engineering institute, Ichalkaranji, Shivaji University, Kolhapur, India
---***---
Abstract - The present work deals with the optimization of WEDM process parameters for machining Ti44.20-Ni55.80 shape memory alloy (SMA) for application of the biomedical. Effect of WEDM parameters viz. pulse on time (Ton), pulse off time (Toff),
servo voltage, wire feed and wire tension on the response variables such as material removal rate, surface roughness and dimensional deviation is determined. As Ti-Ni SMA has captivating properties and bio-compatibility, has been considered. Eighteen experiments have been performed on WEDM based on an orthogonalarray of Taguchi method. Subsequently, the grey relational analysis (GRA) method is applied todetermine an optimal set of process parameters.
It is observed that optimized set of parameters A2B1C3D3E2 viz. 110 machine unit pulse on time, 20 machine unit pulse off time, spark gap set voltage 40 V, wire feed 10 μm/sec and 4 μm/sec of wire tension determined by using GRA offers maximum MRR and minimum SR and DD. From the Analysis of Variance, it is seen that the process parameter pulse on time is the most significant parameter for multi-response optimization with a percentage contribution of 47.85%. Young’smodulus also checked for biocompatibility. Also, SEM image are taken to confirm the resultsoffering better surface quality.
Key Words: Wire electro-discharge machining, TiNi shape memory alloy, Taguchi Design, ANOVA, Grey relational analysis.
1. INTRODUCTION
Wire electrical discharge machining (WEDM) involves a series of complex physical process including heating and cooling. The electrical discharge energy, affected by the spark plasma intensity and the discharging time, will determine the crater size, which in turn will influence the machining efficiency and surface quality. Hence, the machining parameters, including pulse-on time, pulse-off time, table feed rate, flushing pressure, wire tension, wire velocity, etc. should be chosen properly so that a better performance can be obtained. However, the selection of appropriate machining parameters for WEDM is difficult and relies heavily on the operators’ experience and machining parameters table provided by the machine-tool builder.Ti-Ni shape memory alloy is one of the widely used materials for various engineering products as well as in biomedical application because of its unique and captivating properties such as corrosion resistance, shape memory effect, good wear resistance and biocompatibility.
Selection of optimum machining parameter combinations for obtaining higher cutting efficiency and other dimensional accuracy characteristics is a challenging task in WEDM due to presence of large number of process variables and complicated stochastic process mechanism [1]. The temperature increases during machining of titanium because of low thermal conductivity and high chemical reactivity of titanium. Thus, the probability of wire breakage increases during machining of titanium when the cutting temperature at wire/work piece enhances [2]. Using current WEDM technology employing ultra-high frequency/short duration pulses it may be found the extremely low level of work piece damage [3]. The thermal stresses exceed the yield strength of the workpiece mostly in an extremely thin zone near the spark [4]. It has been reported that the MRR increases with increase in voltage and /or capacitance and higher values of wire tension and wire feed lead to better surface quality with the increase in voltage and capacitance, the energy supplied into the discharge gap increases which results in increasing MRR [6-7]. The use of traditional machining processes to machine hard composite materials causes serious tool wear due to abrasive nature of reinforcing particles thus shortening tool life [8, 9]. Although, nontraditional machining techniques such as water jet machining (WJM) and laser beam machining (LBM) can be used but the machining equipment is expensive, height of the work piece is a constraint, and surface finish obtained is not good [10, 11]. Titanium is also incredibly durable and long-lasting. When titanium cages, rods, plates and pins are inserted into the body, they can last for upwards of 20 years. Titanium non-ferromagnetic property is another benefit, which allows patients with titanium implants to be safely examined with MRIs [12-14]. WEDM has been acquiring wide acceptance for the machining of various conductive materials used in real applications such as metals, ceramics, silicon and metal matrix composites [15–19].
© 2019, IRJET | Impact Factor value: 7.211 | ISO 9001:2008 Certified Journal | Page 2402
In this context, the present work is carried out on;
i. Manufacturing of Ti44.20 Ni55.80SMA
ii. Mechanical properties of Ti44.20 Ni55.80for biocompatibility
iii. The effect of five WEDM process parameters viz. Ton, Toff, SV, wire feed and wire tension on MRR, SR and DD while machining Ti-Ni SMA.
iv. Multi-response optimization of WEDM process parameters for machining Ti-Ni SMA. v. Surface integrity of WEDMed surfaces of optimized parameters for biocompatibility. The work carried out is elucidated in the following sections.
2 Experimental Procedure
2.1 Sample preparation
[image:2.595.176.421.339.479.2]Ti44.20 Ni55.80(Ti-Ni in short) SMAs were prepared by using the vacuum arc melting technique Titanium (purity 99.7 wt%) and nickel (purity 99.9 wt%), totaling about 120 gm, were melted and remeltedsix times in an argon atmosphere to confirm material homogeneity. Tungsten electrode was used for sparking and melting in an inertargon atmosphere. The vacuum up to 10-5 Torr vacuum was created before allowing the argon gas into the chamber and melting was started. The materials were melted in button shape followed byfurther melting into rectangular blocks of size 10 x 20 x 100 mm. Figure 1 shows energy dispersiveX-ray (EDX) analysis of as-cast Ti-Ni alloy clearly indicates the percentage of alloying elements ofTi and Ni alloy.
Fig. 1: EDX analysis of as-cast Ti44.20 Ni55.80 alloy
Shape memory effect to 33°C (austenite finish temperature) was achieved by subsequent heat treatment processes which include annealing to 525°C for 3 hours followed by aging at 375°C for 1 hour with water quench after each heat treatment on the material. The shape memory effect has the ability to return the material to a predetermined shape whenheated and also to create a more reliable barrier for Ni release from Ti-Ni. For the experimental analysis, WEDM is used toprepare a punch specimen of the size of 2mm×3mm×10mm.
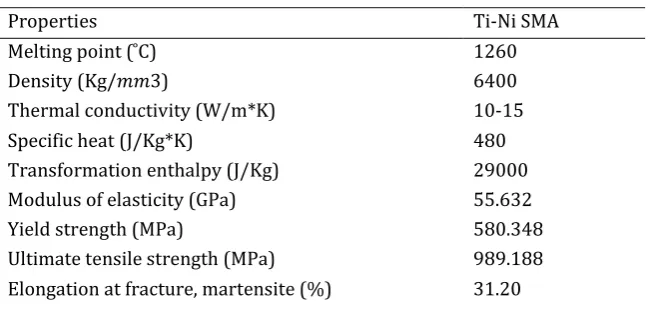
A new biomedical material as Ti-Ni is recommended for stent, which is machined with the micro-WEDM. Physical and mechanical properties of materials are shown in Table 1.
Table 1: Physical and mechanical properties of materials
Properties Ti-Ni SMA
elting point C 1260
Density (Kg/𝑚𝑚3) 6400
Thermal conductivity (W/m*K) 10-15
Specific heat (J/Kg*K) 480
Transformation enthalpy (J/Kg) 29000
Modulus of elasticity (GPa) 55.632
Yield strength (MPa) 580.348
Ultimate tensile strength (MPa) 989.188
[image:2.595.137.464.628.784.2]© 2019, IRJET | Impact Factor value: 7.211 | ISO 9001:2008 Certified Journal | Page 2403
2.2 Parametric analysis based Taguchi Design
In Taguchi method, the raw data is transformed into S/N ratio values which determine the most significant parameters affecting the material MRR, SR and DD during the machining of Ti-Ni SMAs. The purpose of conducting an orthogonal experiment is to find the comparative significance of an individual factor, using analysis of variance (ANOVA) on the performance characteristics of the process under consideration.
2.3 Machining setup
[image:3.595.194.401.256.424.2]The experimental set-up is shown in figure 2.
Fig.2: Experimental setup
A setup on WEDM machine has been developed on as shown in figure. The machine consist of wire electrode, spool to supply wire from which the zinc coated brass wire is constantly fed, tension arm for keeping wire in tension, wire guides for to guide thewire, dielectric nozzles for to supply dielectric fluids, wire collector spool for collecting used wire,Worktable to rest the workpiece material and tank to collect dielectric fluid. In this process, a metallic wire is fed into the workpiece, which is submerged in a tank of dielectric fluid as deionized water. The work table is CNC-controlled and moves in the x–y plane. A special Fixture was used to hold the workpiece. The zinc coated brass wire electrode of 250μm diameter has been used.
2.4 Machining parameter selection
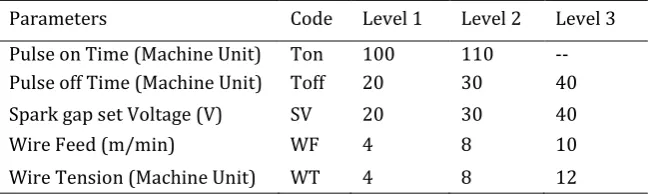
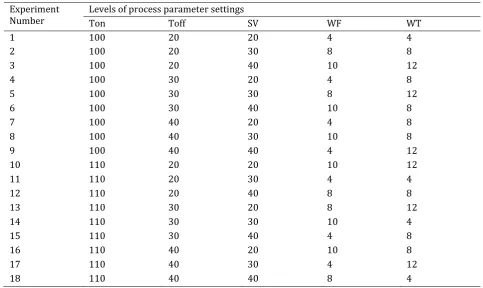
The experiments were carried out based on the Taguchi design of experiments. Five controllable three-level factors and three response variables were considered. The selected process parameters and their identified levels for single pass cutting operation are given in Table 2. Nine experimental runs based on the L18 orthogonal array were performed (Refer Table 3).
Table 2: Controllable parameters considered
Parameters Code Level 1 Level 2 Level 3
Pulse on Time (Machine Unit) Ton 100 110 -- Pulse off Time (Machine Unit) Toff 20 30 40
Spark gap set Voltage (V) SV 20 30 40
Wire Feed (m/min) WF 4 8 10
Wire Tension (Machine Unit) WT 4 8 12
Transformation temperature range (C) -100 to +110
Corrosion resistance Excellent
[image:3.595.136.462.624.721.2]© 2019, IRJET | Impact Factor value: 7.211 | ISO 9001:2008 Certified Journal | Page 2404
Table 3: Experimental design using L18 orthogonal array
Experiment
Number Levels of process parameter settings Ton Toff SV WF WT
1 100 20 20 4 4
2 100 20 30 8 8
3 100 20 40 10 12
4 100 30 20 4 8
5 100 30 30 8 12
6 100 30 40 10 8
7 100 40 20 4 8
8 100 40 30 10 8
9 100 40 40 4 12
10 110 20 20 10 12
11 110 20 30 4 4
12 110 20 40 8 8
13 110 30 20 8 12
14 110 30 30 10 4
15 110 30 40 4 8
16 110 40 20 10 8
17 110 40 30 4 12
18 110 40 40 8 4
3. Machining Performance Evaluation
3.1 Measurement of Material Removal Rate (MRR)
Material removal rate can be achieved by using weight difference of workpiece before and after machining. The weight loss of workpiece during the WEDM process was measured using Sansui digital weigh scale having least count 0.001mg. Knowing the density of Nitinol shape memory alloy (workpiece) material removal rate is estimated. The material removal rate is obtained by equation (1). In this equation, MRR is Material Removal Rate based on mm3/min. The material removal rate (MRR) is calculated as follows:
Where W1 is the weight of the workpiece before machining, W2 is the final weight of the workpiece after machining in gram,
ρniinol is the density of Nitinol shape memory alloy in gm/cm3 (6.45gm/cm3) and Tm is the machining time in minutes.
3.2 Measurement of Surface Roughness (Ra)
The surface roughness was measured as per JIS 2001 standard by using ‘ itutoyo’ surface roughness tester SJ-210 model shown in Fig.2. The average surface roughness (Ra), are considered for the current study. GRA solves multi-attribute decision-making problems by combining the entire range of performance attribute values being considered for every alternative into one single value. The cutoff length of 0.8 mm was selected and an evaluation length of 4 mm was used to measure the surface roughness with a stylus speed of 0.25 mm/s.
3.3 Measurement of dimensional deviation (DD)
© 2019, IRJET | Impact Factor value: 7.211 | ISO 9001:2008 Certified Journal | Page 2405
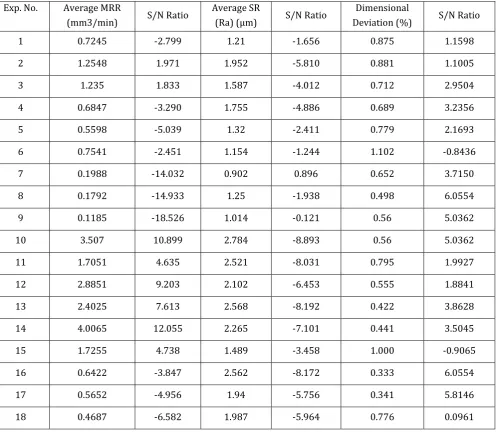
4. Experimental Results, Analysis and Discussion
The experimental results of mean and their associated S/N ratios values are shown in Table 4. Table 4: S/N ratio for MRR, SRand DD
Exp. No. Average MRR
(mm3/min) S/N Ratio
Average SR
Ra μm S/N Ratio
Dimensional
Deviation (%) S/N Ratio
1 0.7245 -2.799 1.21 -1.656 0.875 1.1598
2 1.2548 1.971 1.952 -5.810 0.881 1.1005
3 1.235 1.833 1.587 -4.012 0.712 2.9504
4 0.6847 -3.290 1.755 -4.886 0.689 3.2356
5 0.5598 -5.039 1.32 -2.411 0.779 2.1693
6 0.7541 -2.451 1.154 -1.244 1.102 -0.8436
7 0.1988 -14.032 0.902 0.896 0.652 3.7150
8 0.1792 -14.933 1.25 -1.938 0.498 6.0554
9 0.1185 -18.526 1.014 -0.121 0.56 5.0362
10 3.507 10.899 2.784 -8.893 0.56 5.0362
11 1.7051 4.635 2.521 -8.031 0.795 1.9927
12 2.8851 9.203 2.102 -6.453 0.555 1.8841
13 2.4025 7.613 2.568 -8.192 0.422 3.8628
14 4.0065 12.055 2.265 -7.101 0.441 3.5045
15 1.7255 4.738 1.489 -3.458 1.000 -0.9065
16 0.6422 -3.847 2.562 -8.172 0.333 6.0554
17 0.5652 -4.956 1.94 -5.756 0.341 5.8146
18 0.4687 -6.582 1.987 -5.964 0.776 0.0961
4.1Analysis of variance (ANOVA) and Mean effect plots
To calculate the S/N ratios, larger the better function is used for MRR and smaller the better for SR, DD. The S/N ratio for the larger the better type and smaller the better type of response can becomputed by using Eq. (3) and Eq. (4), respectively as,
n = -10 Log10 [mean of sum squares of reciprocal of measured data}
[image:5.595.54.552.178.611.2]© 2019, IRJET | Impact Factor value: 7.211 | ISO 9001:2008 Certified Journal | Page 2406
n = -10 Log10 [mean of the sum of squares of measured data]
Eq. (4),
Where, yj is the response value
The results were statistically analyzed using ANOVA at 95 % confidence level and the effects were evaluated. P-value establishes whether the process parameter is significant or not at a particular confidence level. For a 95 % confidence level P-value must be less than 0.05 for the significant parameter.
4.1.1 Analysis of Material Removal Rate
From ANOVA table (Refer Table 5) indicates that pulse on time and pulse off time are the most significant
[image:6.595.176.418.288.581.2]parameters with a percentage contribution of 35.39% and 35.39% respectively. Other parameters have a negligible effect on MRR.
Table 5. Analysis of Variance for MRR
Source DF Adj SS Adj MS
F-Value P-Value Ton 1 8.2667 8.26672 14.00 0.006 Toff 2 8.2667 4.11882 6.97 0.018 SV 2 0.1185 0.05925 0.10 0.906 WF 2 1.9230 0.96152 1.63 0.255 WT 2 0.0862 0.04308 0.07 0.930 Error 8 4.7249 0.59062
Total 17 23.3570
fig. 3: Effect of process parameters on MRR
From the above method, more amount of material is removed when pulse on time is increased. It has been found that at a high level of voltage (40 V) due to high gap pollution and insufficient flushing condition cause to decrease in MRR within the work interval.
4.1.2 Analysis of Surface Roughness
ANOVA Table 6 results revealed that the pulse on time is the most significant parameter for the surface roughness with a percentage contribution of 61.27%. All other parameters are not as significant as their effect on SR is less.
Table 6: Analysis of Variance for SR Source DF Adj SS Adj MS F-Value
© 2019, IRJET | Impact Factor value: 7.211 | ISO 9001:2008 Certified Journal | Page 2407
SV 2 0.5524 0.27622 2.67 0.129 WF 2 0.2337 0.11686 1.13 0.369 WT 2 0.1409 0.07044 0.68 0.533 Error 8 0.8263 0.10329
[image:7.595.151.428.74.305.2]Total 17 5.9102
fig. 4: Effect of process parameters on SR
The effect of Ton, Toff, SV, WF and WT on SR are as shown in Figure 4. Increase in discharge energy with an increase in Ton leads to eroding the workpiece material at a faster rate due to the high temperature of spark. This results in a higher value of surface roughness. A fine value of surface roughness is achieved at 40V. At a higher value of voltage, Carbon gets formed on the surface to be machined which leads to the components inaccuracies.
4.1.3 Analysis of dimensional deviation
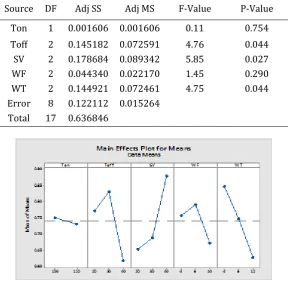
[image:7.595.153.442.476.757.2]Table 7 shows the ANOVA results for dimensional deviation. The dimensional deviation is significantly affected by spark gap set voltage that contributes 28.05%. Percentage contribution of pulse on time is 0.25% which indicates that change in pulse on time has very lower effect on dimensional deviation.
Table 7: Analysis of Variance for DD
Source DF Adj SS Adj MS F-Value P-Value
Ton 1 0.001606 0.001606 0.11 0.754
Toff 2 0.145182 0.072591 4.76 0.044
SV 2 0.178684 0.089342 5.85 0.027
WF 2 0.044340 0.022170 1.45 0.290
WT 2 0.144921 0.072461 4.75 0.044
Error 8 0.122112 0.015264 Total 17 0.636846
© 2019, IRJET | Impact Factor value: 7.211 | ISO 9001:2008 Certified Journal | Page 2408
Figure 5 shows the effect of process parameter on the dimensional deviation. A higher value of wire tension produces the less wire vibration & forms narrow width. In case of wire feed value of dimensional deviation first increase & then decrease.
5. Grey Relational Analysis for the Experimental Results
WEDM has a number of parameters which affect the performance characteristics. Thus, it is necessary to find the optimal condition for machining of Ni-Ti Alloy, which can be found by multi response analysis in grey rational method. The most influential factors for an individual quality target of cutting operation can be identified by analyzing the grey relational grade matrix.
Grey relational analysis is carried out in the following steps
1)Normalizes the experimental results of each performance characteristic. 2)Determination of deviation sequence
3)Calculate the grey relational coefficient (GRC)
4)Calculate the grey relational grade (GRG)
5)Selection of the optimal level of parameters and Analysis of variance of GRG
6)Confirmation Test
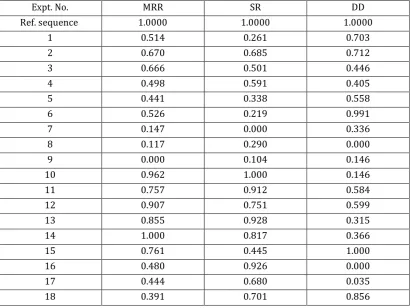
Step 1. Normalizes the experimental results of each performance characteristic
[image:8.595.93.504.433.741.2]The first step of GRA consists of normalizing the experimental data i.e. S/N ratio in order to transfer the original sequence to a comparable sequence (i.e. Dimensionless data sequence). Measured values of response characteristics are normalized between zero to one. There are different methods of data processing in GRA depending on the characteristics.
Table 8: Normalization for MRR, SR, KW, and DD
Expt. No. MRR SR DD
Ref. sequence 1.0000 1.0000 1.0000
1 0.514 0.261 0.703
2 0.670 0.685 0.712
3 0.666 0.501 0.446
4 0.498 0.591 0.405
5 0.441 0.338 0.558
6 0.526 0.219 0.991
7 0.147 0.000 0.336
8 0.117 0.290 0.000
9 0.000 0.104 0.146
10 0.962 1.000 0.146
11 0.757 0.912 0.584
12 0.907 0.751 0.599
13 0.855 0.928 0.315
14 1.000 0.817 0.366
15 0.761 0.445 1.000
16 0.480 0.926 0.000
17 0.444 0.680 0.035
18 0.391 0.701 0.856
© 2019, IRJET | Impact Factor value: 7.211 | ISO 9001:2008 Certified Journal | Page 2409
In contrast, the surface roughness, kerf width and dimensional deviation are “Smaller the better” type characteristics. Hence its original sequence can be normalized by using Eq. (6).
Where, Xi0(k) represents an original sequence, Xi*(k) represents comparability sequence,
i = 1,2,3,…m [m be the total no. experiment performed ],
k =1,2,3,…n [n be the number of parameter considered], In present work m=9 and n=4.
Step2. Determination of deviation sequence
Before calculating GRG it is necessary to calculate deviation sequence , which is the absolute difference between the reference sequence x0* (k) and the comparability sequence xi*(k) after normalization.
[image:9.595.60.545.396.713.2]Note: Reference sequence x0* (k)=1
Table 9: The deviation sequence
Deviation sequence GRC and GRG
Deviation sequence
MRR SR DD
MRR SR DD Grade
Values Rank
No.1, i=1 0.486 0.739 0.297 0.507 0.403 0.627 0.513 12
No.2,i=2 0.330 0.315 0.288 0.603 0.614 0.634 0.617 9
No.3,i=3 0.334 0.499 0.554 0.599 0.501 0.474 0.525 11
No.4, i=4 0.502 0.409 0.595 0.499 0.550 0.457 0.502 13
No.5,i=5 0.559 0.662 0.442 0.472 0.430 0.531 0.478 14
No.6, i=6 0.474 0.781 0.009 0.513 0.390 0.982 0.628 7
No.7,i=7 0.853 1.000 0.664 0.370 0.333 0.430 0.377 16
No.8,i=8 0.883 0.710 1.000 0.362 0.413 0.333 0.369 17
No.9, i=9 1.000 0.896 0.854 0.333 0.358 0.369 0.354 18
No.10, i=10 0.038 0.000 0.854 0.930 1.000 0.369 0.766 1
No.11,i=11 0.243 0.088 0.416 0.673 0.850 0.546 0.690 5
No.12,i=12 0.093 0.249 0.401 0.843 0.667 0.555 0.688 6
No.13, i=13 0.145 0.072 0.685 0.775 0.875 0.422 0.691 4
No.14,i=14 0.000 0.183 0.634 1.000 0.732 0.441 0.724 2
No.15, i=15 0.239 0.555 0.000 0.676 0.474 1.000 0.717 3
No.16,i=16 0.520 0.074 1.000 0.490 0.872 0.333 0.565 10
No.17,i=17 0.556 0.320 0.965 0.473 0.609 0.341 0.475 15
No.18, i=18 0.609 0.299 0.144 0.451 0.626 0.776 0.618 8
Step3. Calculate the grey relational coefficient (GRC)
© 2019, IRJET | Impact Factor value: 7.211 | ISO 9001:2008 Certified Journal | Page 2410
And,
0 < ≤ 1
Where, Δ0i(k) is the deviation sequence of the reference sequence x0*(k) and comparability sequence xi*(k) (Refer Eq. 5).
And, = 1
= 0
= Distinguishing coefficient, (0, 1) for present study, was set as 0.5 based.
Step4. Calculate the grey relational grade (GRG)
The Grey relational grade help to determine the best set of parameters with which experiment is performed i.e. higher GRG shows that the concerned parameter combination is very nearer to the optimum value. An average some of the grey relational coefficients is termed as GRG and can be expressed by Eq. (9).
Where,
( ) is the GRG for j experiment, j = 1,2,3,..n m = no. of performance characteristics = 4
Step5. Selection of the optimal level of parameters and Analysis of variance of GRG
Table 8 shows the grey relational grade for all comparability sequence, larger the grey relational grade, better the corresponding multi-objective characteristics, the value of GRG for experiment No. 9 is more which indicate that the process parameter “Setting of experiment A2B1C3D3E1” offers best multiple performance characteristics among the eighteen experiments.
[image:10.595.174.422.594.747.2]The response table based on Taguchi method for the S/N ratios of the grey relational grade is shown in Table 10. The effect of each level of process parameter on grey relational grade can be identified from the table. From the response table for GRG; the best set of combination of the process parameter is A2B1C3D3E1.
Table 10: Response table for the grey relational grade (GRG)
Levels Ton Toff SV WF WT
1 0.485 0.633 0.569 0.542 0.592 2 0.659 0.623 0.559 0.578 0.576 3 - 0.503 0.588 0.596 0.548 Max 0.659 0.633 0.588 0.596 0.592 Min 0.485 0.503 0.559 0.542 0.548 Delta 0.174 0.130 0.029 0.055 0.044
Rank 1 2 5 3 4
© 2019, IRJET | Impact Factor value: 7.211 | ISO 9001:2008 Certified Journal | Page 2411
Step5.1. Analysis of results
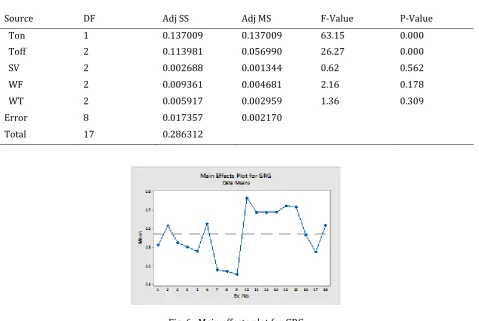
The obtained GRG is considered a single response for the designed experiment and analysis of variance is carried out in to know which parameters significantly affect the multi-objective response. ANOVA for GRG is given in Table 10. From the table, it can be seen that pulse on time is most significant for the optimum multi-response. All other parameters have less effect on machining performance.
Table 11: ANOVA of GRG
Source DF Adj SS Adj MS F-Value P-Value
Ton 1 0.137009 0.137009 63.15 0.000
Toff 2 0.113981 0.056990 26.27 0.000
SV 2 0.002688 0.001344 0.62 0.562
WF 2 0.009361 0.004681 2.16 0.178
WT 2 0.005917 0.002959 1.36 0.309
Error 8 0.017357 0.002170
[image:11.595.61.541.169.490.2]Total 17 0.286312
Fig. 6: Main effects plot for GRG
Figure 6 shows the main effects plot for GRG. The maximum GRG values were observed at a gap voltage of 20 V, Ton time 110, Toff time 20, wire feed of 10µm/sec and wire tension of 12. Hence the combination of these process parameter values gives the optimal result for multi-response.
Step6. Confirmation Test
After evaluating the optimal parameters set, the next step is to predict and variety an improvement of quality characteristics. The optimal Grey Relational grade is predicted using Equation 10
(10)
Where,
= Total mean of the response
© 2019, IRJET | Impact Factor value: 7.211 | ISO 9001:2008 Certified Journal | Page 2412
In present work, = 0.541
= 0.8150
[image:12.595.84.514.225.392.2]Finally, a confirmation test is carried out using the optimum combination of the parameter (A3B3C3D1). Table 12 shows the comparison of predicted GRG with the actual one obtained from the experimental results of the optimal test parameter. The improvement in GRG from initial parameter combination A2B1C1D3E3 (110, 20, 20V, 20µm/sec and 12) to the optimal parameter combination A2B1C3D3E1 (110, 20, 40V, 10 µm/sec, 4) is 0.021, which is 4.961% of initial setting. This improvement is observed because of the increase in wire feed from 10µm/sec to 20µm/sec.
Table 12: Predicted and Experimental Results
Process Parameters Initial Setting Predicted Value Experimental Validation
Optimal parameters A2B1C1D3E3 A2B1C3D3E1 A2B1C3D3E1
Ton 110 110 110
Toff 20 20 20
SV 20 40 40
WF 10 10 10
WT 12 4 4
Grey Relational Grade 0.766 0.8150 0.8040
Improvement of the grey relational grade = 4.961%
9. CONCLUSIONS
The effect of pulse on time, pulse of time, spark gap voltage wire feed and wire tension on micro-WEDM performance characteristics in the machining of Ti44.20-Ni55.80
SMA has been experimentally investigated. The Taguchi method integrated with grey relational analysis was used to optimize the micro-WEDM process parameters for Ni-Ti SMA.
Based on the results of the experimental study, the following conclusions are drawn
1) Ti44.20Ni55.80 SMA is more suitable for the biomedical implant (stent), having Young's modulus (55.632 GPa) is less than other
implant material like Ti (E = 105 GPa) and SS316L (210 GPa).
2) The ANOVA tables for MRR and SR reveal that pulse on time is the most significant factor with a percentage contribution of 35.39 and 61.27 respectively. DD reveal that spark gap set voltage is the most significant factor with a percentage contribution of 28.04.
3) The ANOVA of GRG for multi-performance characteristics reveals that the percentage contribution of pulse on time is 47.85%. Hence capacitance is an identically most significant parameter. Increase in pulse on time, discharge energy per pulse results in higher MRR, SR and DD.
4) Using the GRA initial setting (A2B1C1D3E3), grey relational grade 0.766 is increased by using a new optimum combination (A2B1C3D3E1) to 0.8040. It means that there is an increment in the grade of 4.961%. Therefore, using the GRA approach of analysis, process parameters have been successfully optimized for better machining performance characteristics.
REFERENCES
1. S. Sarkar, S. Mitra, B. Bhattacharyya Parametric analysis and optimization of wire electrical discharge machining of titanium aluminide alloy Journal of Materials Processing Technology 159 (2005) 286–294
© 2019, IRJET | Impact Factor value: 7.211 | ISO 9001:2008 Certified Journal | Page 2413
3. D.K. Aspinwall , S.L. Soo a, A.E. Berrisford a, G. walder workpiece surface roughness and integrity after WEDM of Ti– 6Al–4V and Inconel 718 using minimum damage generator technology CIRP Annals - Manufacturing Technology 57 (2008) 187–190
4. Vinod Yadav 1, Vijay K. Jain ∗, Prakash M. Dixit Thermal stresses due to electrical discharge machining International Journal of Machine Tools & Manufacture 42 (2002) 877–888
5. S. F. Hsieh, S .L. Chen, H. C. Lin, M. H. Lin, S. Y. Chiou The machining characteristics and shape recoverability of Ti–Ni–X (X ¼ Zr, Cr) ternary shape memory alloys using the wire electro-discharge machining International Journal of Machine Tools & Manufacture 49 (2009) 509–514
6. Preetam Selmokar, Sujit Pardeshi, Experimental Investigation for Difficult-to-Machine Materials Using Micro-WEDM, IJRMET Vol. 4(2014), 178-181.
7. T.U. Siddique, J. Ramkumar, Micro-wire electric discharge machining of Mg alloy used in biodegradable orthopedic implants, Materials Today: Proceedings 4 (2017) 10273-10277
8. Yan BH and Wang CC. Machinability of SiC particle reinforced aluminum alloy composite material. Journal of Japan Institute Light Metals 1993; 43 (4): 187-192.
9. Monaghan JM. and Reilly PO. The drilling of an Al/SiC Metal matrix composite. Journal of Materials Processing Technology 1992; 33 (4): 469-480.
10. Muller F and Monaghan J. Non- conventional machining particle metal matrix composite. International Journal of Machine tool and Manufacture 2000; 40 (9): 1351-1366.
11. Lau WS and Lee WB. Comparison between EDM wire cut and laser cutting of carbon fiber composite materials. Materials and Manufacturing Processes 1991; 6 (2): 331-342.
12. Rahman, M.M., 2012. Modeling of Machining Parameters of Ti-6Al-4V for Electric Discharge Machining: A Neural Network Approach. Scientific Research and Essays 7(8), p.881-890.
13. www.tatanium.org, International Titanium Association-Medical Data Sheet, 1999. 14. http://www.supraalloys.com
15. S. Kuriakose, K. Mohan, M. S. Shunmugam, Data mining applied to wire-EDM process, J. Mater. Process.Technol.142(2003)182–189.
16. Y. S. Liao, J. H. Huang, Y. H. Chen, A study to achieve a fine surface finish In wire- EDM, J. Mater. Process. Technol.149(2004)165–171.
17. Y. K. Lok, T. C. Lee, Processing of advanced ceramics using the wire-cut EDM process, J. Mater. Process.Technol.63(1997)839–843.
18. W. Y. Peng, Y. S. Liao, Study of electrical discharge machining technology for slicing silicon ingots, J. Mater. Process. Technol.140(2003)274–279.