Original Article
Influence of red blood cell distribution on short-term
functional outcome in patients with acute
ischemic stroke and atrial fibrillation
Wenjie Tian1, Xiaoshuang Xia1, Santao Wang1, Xiaolin Tian1, Gary Tse2,3,4, Miaomiao Wei1, Tong Liu5, Xin Li1
1Department of Neurology, The Second Hospital of Tianjin Medical University, Tianjin 300211, P.R. China; 2 Depart-ment of Medicine and Therapeutics, Chinese University of Hong Kong, Hong Kong, SAR, P.R. China; 3Li Ka Shing Institute of Health Sciences, Faculty of Medicine, Chinese University of Hong Kong, Hong Kong, SAR, P.R. China; 4School of Health Sciences, University of Manchester, United Kingdom; 5Tianjin Key Laboratory of Ionic-Molecular Function of Cardiovascular Disease, Department of Cardiology, Tianjin Institute of Cardiology, The Second Hospital of Tianjin Medical University, Tianjin 300211, P.R. China
Received November 7, 2017; Accepted April 2, 2018; Epub August 15, 2018; Published August 30, 2018
Abstract:Background and aim: Accurate risk stratification and prognostication are important for managing patients with atrial fibrillation (AF) and acute ischemic stroke. Red blood cell distribution width (RDW) has previously been found to predict long-term clinical outcomes in these conditions. This study investigated its role in predicting short-term outcomes. Methods: This was a retrospective study examining all patients who were admitted to our hospital with a clinical diagnosis of AF and acute ischemic stroke. Baseline characteristics including RDW and short-term outcome variables were recorded. Logistic regression and propensity score-matched analyses were used to identify the independent predictors of outcome variables. Results: A total of 258 patients were included in this study, in whom a significant association between RDW and the National Institutes of Health Stroke Scale (NIHSS) scores at admission (rs = 0.199, p < 0.001) was observed. Multivariate analysis confirmed the value of RDW for predicting the occurrence of severe stroke (NIHSS ≥ 8). RDW ≥ 13.1% was associated with a higher modified Rankin Scale score at discharge (3 versus 4, p = 0.007), higher rate of adverse prognosis (75.3% versus 87.6%, p = 0.034), and lower rate of independent ambulation (55.2% versus 37.8%, p = 0.024). Modified Charlson’s comorbidity index (CCI) was also an independent factor of mRS scores at discharge (OR = 0.589, 0.451-0.767, p < 0.001). Conclusions: RDW is an inexpensive marker that can be used to predict stroke severity and short-term functional outcomes in patients with AF and acute ischemic stroke.
Keywords: Red blood cell distribution width, ischemic stroke, atrial fibrillation, severity, outcome
Introduction
Red blood cell distribution width (RDW) is a parameter of complete blood count that quanti
-tatively describes the variability in the size of
circulating erythrocytes and plays a role in the
differential diagnosis of anemia. It has been recently found a strong predictor in many path
-ological states, for example coronary deaths, nonfatal myocardial infarction, stroke [1, 2], heart failure [3, 4], peripheral artery disease [5], cancer [6], hemodialysis [7], infection [8] and diabetes mellitus [9]. More recently, RDW
has been shown to be an independent
predic-tor of the incidence and clinical outcomes in atrial fibrillation (AF) [10-12]. However, the
remains controversial [11, 13-17]. Ntaio et al. performed a study including 1504 patients with acute stroke, and demonstrated that RDW did not significantly predict the stroke severity and functional outcome [14]. By contrast, other studies showed an association between RDW
and the incidence, severity and long term
out-comes of stroke [13, 17-19]. While these previ
-ous studies have focused on the longer term outcomes, typically at three months or more fol -lowing acute ischemic stroke events, little is known regarding its association with short-term outcomes. Above all, it remains unclear
wheth-er the association is influenced by the intwheth-erac
-tion between stroke and AF. At that point, the
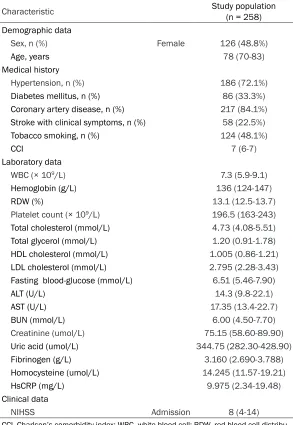
Table 1. Baseline characteristics and clinical data
Characteristic Study population (n = 258)
Demographic data
Sex, n (%) Female 126 (48.8%)
Age, years 78 (70-83)
Medical history
Hypertension, n (%) 186 (72.1%)
Diabetes mellitus, n (%) 86 (33.3%)
Coronary artery disease, n (%) 217 (84.1%)
Stroke with clinical symptoms, n (%) 58 (22.5%)
Tobacco smoking, n (%) 124 (48.1%)
CCI 7 (6-7)
Laboratory data
WBC (× 109/L) 7.3 (5.9-9.1)
Hemoglobin (g/L) 136 (124-147)
RDW (%) 13.1 (12.5-13.7)
Platelet count (× 109/L) 196.5 (163-243)
Total cholesterol (mmol/L) 4.73 (4.08-5.51) Total glycerol (mmol/L) 1.20 (0.91-1.78)
HDL cholesterol (mmol/L) 1.005 (0.86-1.21)
LDL cholesterol (mmol/L) 2.795 (2.28-3.43)
Fasting blood-glucose (mmol/L) 6.51 (5.46-7.90)
ALT (U/L) 14.3 (9.8-22.1) AST (U/L) 17.35 (13.4-22.7)
BUN (mmol/L) 6.00 (4.50-7.70)
Creatinine (umol/L) 75.15 (58.60-89.90)
Uric acid (umol/L) 344.75 (282.30-428.90)
Fibrinogen (g/L) 3.160 (2.690-3.788)
Homocysteine (umol/L) 14.245 (11.57-19.21)
HsCRP (mg/L) 9.975 (2.34-19.48)
Clinical data
NIHSS Admission 8 (4-14)
CCI, Charlson’s comorbidity index; WBC, white blood cell; RDW, red blood cell distribu -tion width; HDL, High density lipoprotein; LDL, Low density lipoprotein; ALT, alanine aminotransferase; AST, aspartate aminotransferase; BUN, blood urea nitrogen; HsCRP, high sensitivity C reactive protein; NIHSS, the National Institutes of Health Stroke Scale.
tive for short-term outcomes in patients with AF
and acute ischemic stroke. Materials and methods
Study population
In this retrospective study, data were obtained
from the database for all hospitalized patients with acute stroke in the second hospital of Tianjin Medical University, which is one of the
major stroke centers in Tianjin. The study
popu-nths, missing information on basal characteris -tics. The study was approved by the Ethics
Committee of the Second Hospital of Tianjin Medical University and written informed con
-sent was obtained from all patients.
Data collection
Baseline characteristics were recorded includ -ing demographic data, medical history (hyper-tension, diabetes mellitus, coronary artery
dis-ease, atrial fibrillation, symptomatic stroke,
lation was based on con-secutive patients with a
final diagnosis of AF and
acute ischemic stroke at discharge between Janua- ry, 2010 and November, 2016. All patients admitted to the hospital within 72
hours of symptoms onset through the Emergency De-partment (ED) or the Out-Patient Department were included. For each patient,
computed tomography (CT) scan and baseline electro-cardiogram (ECG) were
per-formed at admission.
Pa-tients initially admitted to the intensive care unit underwent permanent ECG monitoring. Through the method above or the 24-
hour Holter ECG, patients without known AF had con
-tinuous ECG monitoring for
at least 24 hours. The
diag-nosis of AF at discharge
was based on medical his-tory, initial and supple- mental ECG during hospi- talization, ECG monitoring
and 24-hour Holter ECG findings.
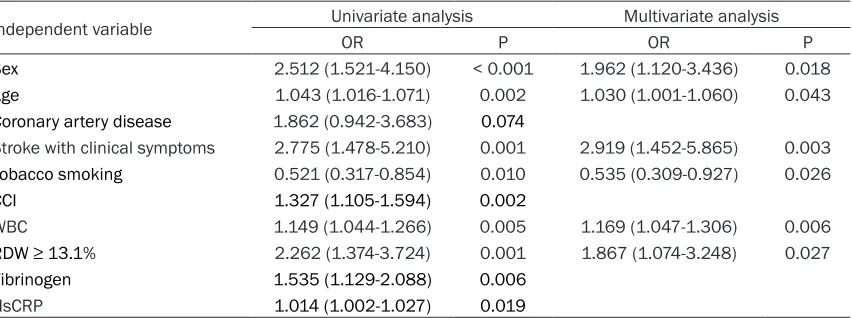
Table 2. Binary logistic regression analysis to identify independent factors of NIHSS ≥ 8 in patients with AF and AIS
Independent variable Univariate analysis Multivariate analysis
OR P OR P
Sex 2.512 (1.521-4.150) < 0.001 1.962 (1.120-3.436) 0.018
Age 1.043 (1.016-1.071) 0.002 1.030 (1.001-1.060) 0.043
Coronary artery disease 1.862 (0.942-3.683) 0.074
Stroke with clinical symptoms 2.775 (1.478-5.210) 0.001 2.919 (1.452-5.865) 0.003
Tobacco smoking 0.521 (0.317-0.854) 0.010 0.535 (0.309-0.927) 0.026
CCI 1.327 (1.105-1.594) 0.002
WBC 1.149 (1.044-1.266) 0.005 1.169 (1.047-1.306) 0.006
RDW ≥ 13.1% 2.262 (1.374-3.724) 0.001 1.867 (1.074-3.248) 0.027
Fibrinogen 1.535 (1.129-2.088) 0.006
HsCRP 1.014 (1.002-1.027) 0.019
AF, atrial fibrillation; AIS, acute ischemic stroke; NIHSS, the National Institutes of Health Stroke Scale; CCI, modified Charlson’s comorbidity index; WBC, white blood cell; RDW, red blood cell distribution width; HsCRP, high sensitivity C reactive protein.
mRS ≥ 3. In the ordinal logistic model for mRS scores, patients were divided into four groups
(0, 1 to 2, 3 to 5 and 6). As a secondary
out-come, independent ambulation was defined as ambulation without assistance from another person, with or without the use of a walking aid,
and the analysis was restricted to patients with documented ability to ambulate independently prior to symptom onset (10 patients excluded).
Statistical analysis
Continuous variables are reported as median
(interquartile range), and categorical variables
were reported as counts (percentage value).
Comparison between groups was performed with independent-sample t tests (for normally distributed variables), Wilcoxon’s two-sample nonparametric test or Kruskal-Wallis test (for
continuous variables and ordinal variables),
Chi-square test, or Fisher’s exact test for cate -gorical and dichotomous variables, respective-ly. Spearman Rank correlation was used to
determine the correlation between different variables. Binomial or ordinal logistic regres
-sion was performed to evaluate independent effects of RDW on stroke severity or functional outcome, respectively, with adjustment for
basal characteristics and clinical variables. Variables with p < 0.10 in the univariate analy-sis were entered the multivariate logistic re- gression. Receiver operating characteristic
(ROC) curves were constructed to assess the predictive value of RDW. The optimal cut-off value was identified by Youden index. To bal
-tobacco smoking), modified Charlson’s comor
-bidity index [20] and laboratory examinations at ED or admission. The severity of stroke was evaluated by the National Institutes of Health Stroke Scale (NIHSS) score at admission and the functional outcome by the modified Rankin
Scale (mRS) score at discharge. All the scoring
procedures were performed independently by
two neurologists, and disagreements were resolved by negotiation.
Common medical complications associated with acute ischemic stroke during
hospitaliza-tion were identified by searching the secon-dary diagnoses from the medical records. Com-plications were categorized into one of the fol
-lowing categories: infectious (pneumonia, uri
-nary tract infection), gastrointestinal (stress
ulcer, alimentary tract hemorrhage), cardiac
(acute myocardial infarction), thrombotic (deep
vein thrombosis, pulmonary embolism), neuro-logical (symptomatic epilepsy), internal environ-ment (electrolyte disturbance), miscellaneous
(pressure ulcer). For most of the statistical
analysis, patients were divided into two groups: no medical co-morbidity and those with at least one medical condition.
Short-term outcome variables included
dis-charge destination, length of stay (LOS) and mRS at discharge. Discharge destination was
analyzed as discharge to rehabilitation center
or home, hospice, death or others (i.e. left against medical advice or transferred to anoth
ance the characteristics of patients classified according to the median of RDW, a propensity
score was created with a 0.15 caliper width and
a matching ratio 1:1. Statistical analysis was
[image:4.612.91.523.95.608.2]performed by IBM SPSS 23.0 software. Two-sided < 0.05 was considered significant.
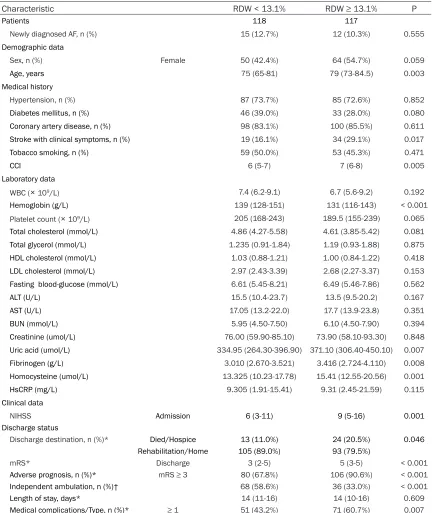
Table 3. Baseline characteristics, clinical data and discharge status of patients classified according to RDW levels before matched
Characteristic RDW < 13.1% RDW ≥ 13.1% P
Patients 118 117
Newly diagnosed AF, n (%) 15 (12.7%) 12 (10.3%) 0.555 Demographic data
Sex, n (%) Female 50 (42.4%) 64 (54.7%) 0.059
Age, years 75 (65-81) 79 (73-84.5) 0.003
Medical history
Hypertension, n (%) 87 (73.7%) 85 (72.6%) 0.852
Diabetes mellitus, n (%) 46 (39.0%) 33 (28.0%) 0.080
Coronary artery disease, n (%) 98 (83.1%) 100 (85.5%) 0.611
Stroke with clinical symptoms, n (%) 19 (16.1%) 34 (29.1%) 0.017
Tobacco smoking, n (%) 59 (50.0%) 53 (45.3%) 0.471
CCI 6 (5-7) 7 (6-8) 0.005
Laboratory data
WBC (× 109/L) 7.4 (6.2-9.1) 6.7 (5.6-9.2) 0.192
Hemoglobin (g/L) 139 (128-151) 131 (116-143) < 0.001
Platelet count (× 109/L) 205 (168-243) 189.5 (155-239) 0.065
Total cholesterol (mmol/L) 4.86 (4.27-5.58) 4.61 (3.85-5.42) 0.081 Total glycerol (mmol/L) 1.235 (0.91-1.84) 1.19 (0.93-1.88) 0.875 HDL cholesterol (mmol/L) 1.03 (0.88-1.21) 1.00 (0.84-1.22) 0.418 LDL cholesterol (mmol/L) 2.97 (2.43-3.39) 2.68 (2.27-3.37) 0.153 Fasting blood-glucose (mmol/L) 6.61 (5.45-8.21) 6.49 (5.46-7.86) 0.562
ALT (U/L) 15.5 (10.4-23.7) 13.5 (9.5-20.2) 0.167
AST (U/L) 17.05 (13.2-22.0) 17.7 (13.9-23.8) 0.351
BUN (mmol/L) 5.95 (4.50-7.50) 6.10 (4.50-7.90) 0.394
Creatinine (umol/L) 76.00 (59.90-85.10) 73.90 (58.10-93.30) 0.848 Uric acid (umol/L) 334.95 (264.30-396.90) 371.10 (306.40-450.10) 0.007
Fibrinogen (g/L) 3.010 (2.670-3.521) 3.416 (2.724-4.110) 0.008
Homocysteine (umol/L) 13.325 (10.23-17.78) 15.41 (12.55-20.56) 0.001
HsCRP (mg/L) 9.305 (1.91-15.41) 9.31 (2.45-21.59) 0.115
Clinical data
NIHSS Admission 6 (3-11) 9 (5-16) 0.001 Discharge status
Discharge destination, n (%)* Died/Hospice 13 (11.0%) 24 (20.5%) 0.046 Rehabilitation/Home 105 (89.0%) 93 (79.5%)
mRS* Discharge 3 (2-5) 5 (3-5) < 0.001 Adverse prognosis, n (%)* mRS ≥ 3 80 (67.8%) 106 (90.6%) < 0.001
Independent ambulation, n (%)† 68 (58.6%) 36 (33.0%) < 0.001
Length of stay, days* 14 (11-16) 14 (10-16) 0.609
Medical complications/Type, n (%)* ≥ 1 51 (43.2%) 71 (60.7%) 0.007
Results
The study population consisted of 258 pati-ents with a final diagnosis of AF and acute isch
-emic stroke, of which on admission 227 patients had known AF and 31 patients with newly diagnosed AF. Baseline characteristics
and clinical data are shown in Table 1. A signifi
-cant association was found between RDW lev-els and the NIHSS scores at admission (rs = 0.199, p < 0.001). Univariate logistic
regres-sion was performed to identify the predictor factors for the NIHSS scores at admission. NIHSS scores were classified into two groups using the median, into 0-7 and ≥ 8, and RDW levels into RDW < 13.1% and RDW ≥ 13.1%. A
stepwise multivariate analysis showed that
RDW ≥ 13.1% remained significantly associat
-ed with stroke severity after adjusting for con
-founders (Table 2).
To determine the relationship between RDW
and discharge status variables, patients whose discharge destinations were categorized into others were excluded. The baseline
character-istics, clinical data, and discharge status of patients classified by the median of RDW are
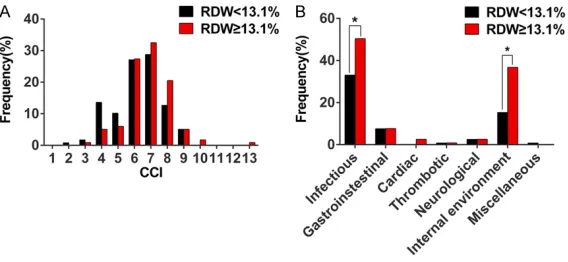
showed in Table 3. Age, proportion of symptom -atic stroke and CCI (Figure 1A) were significant
-ly increased in patients with RDW ≥ 13.1%, whilst LOS was similar between the two groups. RDW was found to be significantly associated
with discharge destination (rs = 0.131, p = 0.045), mRS score at discharge (rs = 0.272, p < 0.001) and medical complication (rs = 0.188, p
tomized mRS scores was performed. This dem
-onstrated quartiles of RDW were independent factors for both adverse outcome (odds ratio [OR] 2.198, 95% confidence interval [CI] =
1.410-3.427, p = 0.001) and independent
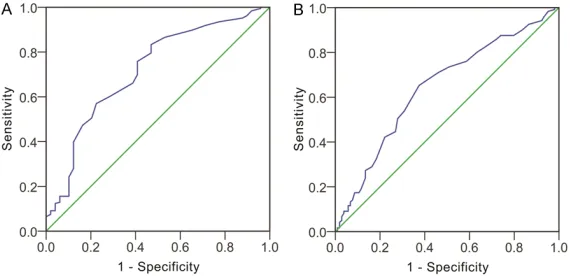
ambulation (OR = 0.666, 95% CI = 0.465-0.954, p = 0.026). The ROC curves of RDW for
predicting adverse outcome and independent
ambulation yielded an AUC of 0.717 (95% CI = 0.634-0.801, p < 0.001) and 0.643 (95% CI =
0.570-0.715, p < 0.001) respectively (Figure 2). The best cut-off value was 12.45% with a sensitivity of 0.833 and specificity of 0.531 for adverse outcome, and 12.95% with a sensitivi
-ty of 0.653 and specifici-ty of 0.625 for no inde -pendent ambulation.
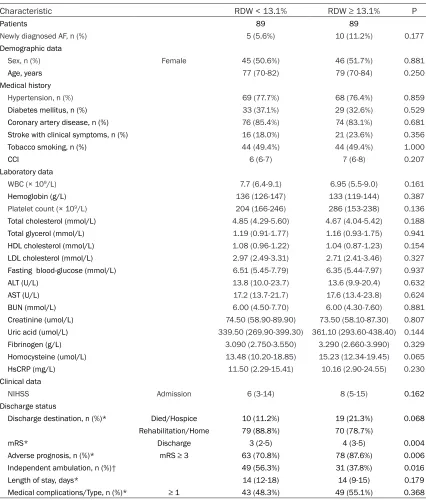
As the study was non-randomized, a propen-
sity score matching was performed, yielding 89 matched pairs of patients (excluding th-ose categorized into others). Characteristics of
matched patients were shown in Table 5. There
was no significant difference in the variables
generally considered to determine outcome variables (sex, age, diabetes mellitus, CCI, hemoglobin, total cholesterol, creatinine, uric
acid, fibrinogen, homocysteine and NIHSS), except for RDW (12.4%, 12.0%-12.7%; 13.6%, 13.3%-14.2%; p < 0.001). Patients with differ
-ent levels of RDW showed no significant differ
-ence in the LOS whether before or after match
-ing. The proportion of discharge to home/ hospice and at least 1 type of medical compli
-cation both became similar after matching. Only the mRS score at discharge, the propor
-tion of adverse prognosis and independent
Figure 1. Distribution of modified Charlson’s comorbidity index and medi-cal complication type in patients classified by the median of red blood cell distribution width. Distribution of modified Charlson’s comorbidity index (A) and medical complication type (B) in patients classified by the median of red blood cell distribution width (excluding whose discharge destination were categorized into others). Results are shown as frequency (%). *indicates p < 0.05.
= 0.004). Among those types
of medical complications, infection and electrolyte dis -turbance were the top two
and occurred more frequently in patients with RDW ≥ 13.1%
(Figure 1B).
Furthermore, in the ordinal
logistic regression analysis
for mRS scores, the parame
-ters significantly associated with functional outcome were diabetes mellitus, CCI, RDW ≥ 13.1% and NIHSS scores at
admission (Table 4). To enable
[image:5.612.92.376.71.202.2]dicho-ambulation remained significantly higher in
matched patients. Discussion
Stroke is one of the most common causes of
disability and death around the world. A better
understanding of the factors that may have an
impact on the clinical outcomes is necessary
for accurate risk stratification and prognostica
-tion, which may provide great help for manag -ing patients as well as communicate with
patients and families about the condition. For the past few years, red cell distribution width (RDW) has been found an independent factor for predicting clinical outcomes in patients with
ischemic stroke. Several studies demonstrated
but did not eliminate the association between
higher RDW levels and the adverse clinical out
-comes. As RDW is a simple and cost-effective
laboratory test assessed rapidly by automated
cell counters, its predictive value for the func -tional outcome at discharge may provide a
novel means for prognostication in acute
stroke.
In addition, our data demonstrated RDW as a marker for stroke severity (NIHSS scores at
admission), which was not shown in the
previ-ous study [14]. This difference may be attri-buted to differing cohorts studied. Many stud
-ies have demonstrated significant increases in RDW in patients with AF [10, 12], indicat-ing that AF may have a potentially
confound-Figure 2. Receiver operating characteristic curves analysis of red blood cell distribution width. ROC curve analysis of red blood cell distribution width for predicting adverse outcome (A) and independent ambulation (B).
that RDW was significantly
associated with neurological
improvement, 3-month unfa -vorable outcome and 1-year all-cause mortality in patients
with ischemic stroke [17, 21]. To the best of our knowledge, this study is the first to dem
-onstrate a significant associa
-tion between RDW and func -tional outcomes (mRS scores, adverse prognosis or inde-pendent ambulation) at
dis-charge in patients with AF
and acute ischemic stroke.
Adjustment for multiple poten
[image:6.612.92.523.97.268.2]-tial confounders attenuated
Table 4. Ordinal logistic regression analysis to identify independent factors of mRS scores in patients with AF and AIS
Independent variable Univariate analysis Multivariate analysis
OR P OR P
Sex 1.630 (0.955-2.781) 0.073 0773 (0.414-1.442) 0.418
Age 0.955 (0.931-0.981) 0.001 0.997 (0.965-1.030) 0.874
Diabetes mellitus 0.575 (0.328-1.008) 0.053 0.460 (0.228-0.928) 0.030
Stroke with clinical symptoms 2.240 (1.167-4.301) 0.015 1.160 (0.530-2.541) 0.710
CCI 0.547 (0.449-0.667 < 0.001 0.589 (0.451-0.767) < 0.001
WBC 0.930 (0.866-0.999) 0.045 1.010 (0.931-1.096) 0.815
RDW ≥ 13.1% 3.368 (1.891-5.998) < 0.001 2.060 (1.090-3.893) 0.026
Fasting blood-glucose 0.910 (0.836-0.990) 0.029 0.931 (0.839-1.034) 0.183
AST 0.974 (0.953-0.996) 0.020 0.982 (0.959-1.006) 0.133
Fibrinogen 0.766 (0.559-1.048) 0.096 1.198 (0.839-1.711) 0.321
NIHSS/Admission 0.788 (0.742-0.835) < 0.001 0.812 (0.762-0.865) < 0.001
[image:6.612.91.376.323.461.2]ing effect on the association between RDW
and acute ischemic stroke. The previous stu-
dy by Ntaio et al. did not specifically focus on the confounding effect of AF [14], whereas
the present study excluded patients without
AF, which may exclude the confounding effect of AF and lead to more homogenous results in
the latter. The disagreement exactly points
[image:7.612.93.519.93.593.2]towards a complex relationship between RDW, AF and ischemic stroke.
Table 5. Baseline characteristics, clinical data and discharge status of patients classified according to RDW levels after matched
Characteristic RDW < 13.1% RDW ≥ 13.1% P
Patients 89 89
Newly diagnosed AF, n (%) 5 (5.6%) 10 (11.2%) 0.177 Demographic data
Sex, n (%) Female 45 (50.6%) 46 (51.7%) 0.881
Age, years 77 (70-82) 79 (70-84) 0.250
Medical history
Hypertension, n (%) 69 (77.7%) 68 (76.4%) 0.859
Diabetes mellitus, n (%) 33 (37.1%) 29 (32.6%) 0.529
Coronary artery disease, n (%) 76 (85.4%) 74 (83.1%) 0.681
Stroke with clinical symptoms, n (%) 16 (18.0%) 21 (23.6%) 0.356
Tobacco smoking, n (%) 44 (49.4%) 44 (49.4%) 1.000
CCI 6 (6-7) 7 (6-8) 0.207
Laboratory data
WBC (× 109/L) 7.7 (6.4-9.1) 6.95 (5.5-9.0) 0.161
Hemoglobin (g/L) 136 (126-147) 133 (119-144) 0.387
Platelet count (× 109/L) 204 (166-246) 286 (153-238) 0.136
Total cholesterol (mmol/L) 4.85 (4.29-5.60) 4.67 (4.04-5.42) 0.188 Total glycerol (mmol/L) 1.19 (0.91-1.77) 1.16 (0.93-1.75) 0.941 HDL cholesterol (mmol/L) 1.08 (0.96-1.22) 1.04 (0.87-1.23) 0.154 LDL cholesterol (mmol/L) 2.97 (2.49-3.31) 2.71 (2.41-3.46) 0.327 Fasting blood-glucose (mmol/L) 6.51 (5.45-7.79) 6.35 (5.44-7.97) 0.937
ALT (U/L) 13.8 (10.0-23.7) 13.6 (9.9-20.4) 0.632
AST (U/L) 17.2 (13.7-21.7) 17.6 (13.4-23.8) 0.624
BUN (mmol/L) 6.00 (4.50-7.70) 6.00 (4.30-7.60) 0.881
Creatinine (umol/L) 74.50 (58.90-89.90) 73.50 (58.10-87.30) 0.807 Uric acid (umol/L) 339.50 (269.90-399.30) 361.10 (293.60-438.40) 0.144
Fibrinogen (g/L) 3.090 (2.750-3.550) 3.290 (2.660-3.990) 0.329
Homocysteine (umol/L) 13.48 (10.20-18.85) 15.23 (12.34-19.45) 0.065
HsCRP (mg/L) 11.50 (2.29-15.41) 10.16 (2.90-24.55) 0.230
Clinical data
NIHSS Admission 6 (3-14) 8 (5-15) 0.162 Discharge status
Discharge destination, n (%)* Died/Hospice 10 (11.2%) 19 (21.3%) 0.068 Rehabilitation/Home 79 (88.8%) 70 (78.7%)
mRS* Discharge 3 (2-5) 4 (3-5) 0.004
Adverse prognosis, n (%)* mRS ≥ 3 63 (70.8%) 78 (87.6%) 0.006
Independent ambulation, n (%)† 49 (56.3%) 31 (37.8%) 0.016
Length of stay, days* 14 (12-18) 14 (9-15) 0.179
Medical complications/Type, n (%)* ≥ 1 43 (48.3%) 49 (55.1%) 0.368
Moreover, the present study showed that
high-er RDW levels are associated with highhigh-er pro
-portions of death/hospice destination and more than 1 type of medical complication, but the association diminished after adjustment for various confounders. It might be due to a
relatively small sample size. Although we could
not come to the conclusion that RDW was pre
-dictive for in-hospital mortality and medical
complications during hospitalization, it
remind-ed us of the possible association between RDW
and those outcome variables. Studies with a larger sample size should be conducted to get a better understanding.
RDW is conventionally calculated by the ratio of the standard deviation (SD) and the mean of erythrocyte volumes, which reflects the degree of heterogeneity of erythrocyte volume, in other
words, anisocytosis. Although the clinical
sig-nificance of RDW has been studied in many
conditions, the underlying mechanisms have
not been fully elucidated. An increased RDW mirrors a dysregulation of erythrocyte homeo -stasis that may be attributed to telomere sh- ortening, higher oxidative stress, increased
inflammation, poor nutritional status, dyslipid
-emia, hypertension, erythrocyte fragmentation and impaired erythropoietin function. In fact, many of these metabolic abnormalities are involved in the pathogenesis of both AF and
ischemic stroke. Impaired erythropoiesis, ab- normal erythrocyte survival, and delayed eryth-rocyte clearance might be important control
points in the pathogenesis [22, 23]. RDW may be a simple marker of an underlying disrupted
homeostasis.
There may be causal association between RDW
and a cardiovascular disorder. Anisocytosis is
associated with higher levels of cholesterol
content in erythrocyte membrane, which
par-ticipates in the formation and growth of the ath
-erosclerotic plaques [24]. Enhanced inhibition of nitric oxide bioactivity and reduced erythro
-cyte deformability [25] caused by anisocytosis might ultimately result in reduced flow-depen -dent artery dilatation and oxygenation in pe-
ripheral organs, thus triggering or amplifying the adverse consequence of ischemic dam-age [26]. In summary, RDW is a simple and inexpensive marker for predicting the progno
-sis and risk stratification in patients with those pathologies including AF and ischemic stroke [22, 27, 28].
Other than RDW, the modified Charlson’s comorbidity index (CCI) was also found to be an independent factor of mRS scores at discharge (OR = 0.589, 0.451-0.767, p < 0.001). CCI is a
weighted comorbid disease severity score
com-posed of 17 comorbid conditions, which was initially developed as an applicable method for classifying comorbid conditions associated with the risk of mortality in longitudinal studies.
It has been extensively used in clinical research
to assess the confounding influence of comor
-bidities and predictor of outcomes. In clinical
practice, comorbidity was common in patients
with AF and ischemic stroke, as both diseases affect the elderly mainly. For that reason, we used CCI as a measure of the overall condition of patients and burden of disease including baseline risk of developing in-hospital compli
-cations. These were not included in most of the previous studies. Our data support that CCI is a predictive factor for mRS scores at discharge.
The association might indicate the possible
influence of comorbidities on clinical outcome,
particularly in the elderly.
There are some limitations in our study. First,
although multiple ECG measurements were
taken, some patients with AF might have been undetected. Second, the proportion of death
or hospice destination and medical compli-
cation were higher but not significant after
matching, which may be attributed to the sm- all sample size. Larger prospective studies are needed to better elucidate these issues
further.
Our study demonstrates the prediction value of RDW in identifying stroke severity and function
-al outcome in patients with AF and acute isch
-emic stroke. However, the mechanism of RDW involved remains unclear, and further investiga -tions are needed to establish a more
conve-nient and accurate system for risk stratification to better guide management of these patients.
Acknowledgements
The study was supported by Tianjin Municipal
Natural Science Foundation (16JCYBJC25500), the Key Project of Tianjin Municipal Health and Family Planning Commission (15KG136) and
Tianjin Science and Technology Commission
Hospital of Tianjin Medical University for col
-lecting the data for this study.
Disclosure of conflict of interest
None.
Address correspondence to: Dr. Xin Li, Department of Neurology, The Second Hospital of Tianjin Medi- cal University, 23 Pingjiang Road, Hexi District, Tianjin 300211, P.R. China. Tel: +86-22-88328514; Fax: +86-22-28309286; E-mail: [email protected]; Dr. Tong Liu, Tianjin Key Laboratory of Ionic-Molecular Function of Cardiovascular disease, De- partment of Cardiology, Tianjin Institute of Car- diology, The Second Hospital of Tianjin Medical University, 23, Pingjiang Road, Hexi District, Tianjin 300211, P.R. China. Tel: +86-22-88328648; Fax: +86-22-28261158; E-mail: [email protected]
References
[1] Tonelli M, Sacks F, Arnold M, Moye L, Davis B, Pfeffer M; for the Cholesterol and Recurrent Events (CARE) Trial Investigators. Relation be-tween red blood cell distribution width and car-diovascular event rate in people with coronary disease. Circulation 2008; 117: 163-168. [2] Borne Y, Smith JG, Melander O and Engstrom
G. Red cell distribution width in relation to inci-dence of coronary events and case fatality rates: a population-based cohort study. Heart 2014; 100: 1119-1124.
[3] Felker GM, Allen LA, Pocock SJ, Shaw LK, Mc-Murray JJ, Pfeffer MA, Swedberg K, Wang D, Yusuf S, Michelson EL, Granger CB and Investi-gators C. Red cell distribution width as a novel prognostic marker in heart failure: data from the CHARM program and the duke databank. J Am Coll Cardiol 2007; 50: 40-47.
[4] Turcato G, Zorzi E, Prati D, Ricci G, Bonora A, Zannoni M, Maccagnani A, Salvagno GL, San-chis-Gomar F, Cervellin G and Lippi G. Early in-hospital variation of red blood cell distribution width predicts mortality in patients with acute heart failure. Int J Cardiol 2017; 243; 306-310. [5] Ye Z, Smith C and Kullo IJ. Usefulness of red cell distribution width to predict mortality in pa-tients with peripheral artery disease. Am J Car-diol 2011; 107: 1241-1245.
[6] Hu L, Li M, Ding Y, Pu L, Liu J, Xie J, Cabanero M, Li J, Xiang R and Xiong S. Prognostic value of RDW in cancers: a systematic review and meta-analysis. Oncotarget 2016; 8: 16027-16035.
[7] Vashistha T, Streja E, Molnar MZ, Rhee CM, Moradi H, Soohoo M, Kovesdy CP and Kalan-tar-Zadeh K. Red cell distribution width and
mortality in hemodialysis patients. Am J Kid-ney Dis 2016; 68: 110-121.
[8] Kim CH, Park JT, Kim EJ, Han JH, Han JS, Choi JY, Han SH, Yoo TH, Kim YS, Kang SW and Oh HJ. An increase in red blood cell distribution width from baseline predicts mortality in pa-tients with severe sepsis or septic shock. Crit Care 2013; 17: R282.
[9] Engstrom G, Smith JG, Persson M, Nilsson PM, Melander O and Hedblad B. Red cell distribu-tion width, haemoglobin A1c and incidence of diabetes mellitus. J Intern Med 2014; 276: 174-183.
[10] Liu T, Shao Q, Miao S, Liu E, Xu G, Yuan R and Li G. Red cell distribution width as a novel, in-expensive marker for paroxysmal atrial fibrilla-tion. Int J Cardiol 2014; 171: e52-53.
[11] Lee KH, Park HW, Cho JG, Yoon NS, Kim SS, Kim MR, Kim MC, Cho KH, Kim HK, Kim CH, Kim KH, Jun SJ, Kim WJ, Lee KJ, Jeong HC, Cho JY, Park KH, Sim D, Yoon HJ, Kim KH, Hong YJ, Kim JH, Ahn Y, Jeong MH and Park JC. Red cell distribution width as a novel predictor for clini-cal outcomes in patients with paroxysmal atrial fibrillation. Europace 2015; 17 Suppl 2: ii83-88.
[12] Korantzopoulos P, Sontis N, Liu T, Chlapouta-kis S, Sismanidis S, SiminelaChlapouta-kis S and Aposto-lakis E. Association between red blood cell dis-tribution width and postoperative atrial fibrillation after cardiac surgery: a pilot obser-vational study. Int J Cardiol 2015; 185: 19-21. [13] Ani C and Ovbiagele B. Elevated red blood cell
distribution width predicts mortality in persons with known stroke. J Neurol Sci 2009; 277: 103-108.
[14] Ntaios G, Gurer O, Faouzi M, Aubert C and Mi-chel P. Red cell distribution width does not pre-dict stroke severity or functional outcome. Int J Stroke 2012; 7: 2-6.
[15] Soderholm M, Borne Y, Hedblad B, Persson M and Engstrom G. Red cell distribution width in relation to incidence of stroke and carotid ath-erosclerosis: a population-based cohort study. PLoS One 2015; 10: e0124957.
[16] Saliba W, Barnett-Griness O, Elias M and Rennert G. The association between red cell distribution width and stroke in patients with atrial fibrillation. Am J Med 2015; 128: 192 e111-198.
[17] Turcato G, Cervellin G, Cappellari M, Bonora A, Zannoni M, Bovi P, Ricci G and Lippi G. Early function decline after ischemic stroke can be predicted by a nomogram based on age, use of thrombolysis, RDW and NIHSS score at admis-sion. J Thromb Thrombolysis 2017; 43: 394-400.
be-tween red blood cell distribution width and ischemic stroke-a case control study. Int J Stroke 2013; 8: E36.
[19] Kara H, Degirmenci S, Bayir A, Ak A, Akinci M, Dogru A, Akyurek F and Kayis SA. Red cell dis-tribution width and neurological scoring sys-tems in acute stroke patients. Neuropsychiatr Dis Treat 2015; 11: 733-739.
[20] Charlson M, Szatrowski TP, Peterson J and Gold J. Validation of a combined comorbidity index. J Clin Epidemiol 1994; 47: 1245-1251. [21] Turcato G, Cappellari M, Follador L, Dilda A,
Bonora A, Zannoni M, Bovo C, Ricci G, Bovi P and Lippi G. Red blood cell distribution width is an independent predictor of outcome in pa-tients undergoing thrombolysis for ischemic stroke. Semin Thromb Hemost 2017; 43: 30-35.
[22] Salvagno GL, Sanchis-Gomar F, Picanza A and Lippi G. Red blood cell distribution width: a simple parameter with multiple clinical appli-cations. Crit Rev Clin Lab Sci 2015; 52: 86-105.
[23] Patel HH, Patel HR and Higgins JM. Modulation of red blood cell population dynamics is a fun-damental homeostatic response to disease. Am J Hematol 2015; 90: 422-428.
[24] Tziakas D, Chalikias G, Grapsa A, Gioka T, Tentes I and Konstantinides S. Red blood cell distribution width: a strong prognostic marker in cardiovascular disease: is associated with cholesterol content of erythrocyte membrane. Clin Hemorheol Microcirc 2012; 51: 243-254. [25] Patel KV, Mohanty JG, Kanapuru B, Hesdorffer
C, Ershler WB and Rifkind JM. Association of the red cell distribution width with red blood cell deformability. Adv Exp Med Biol 2013; 765: 211-216.
[26] Owusu BY, Stapley R, Honavar J and Patel RP. Effects of erythrocyte aging on nitric oxide and nitrite metabolism. Antioxid Redox Signal 2013; 19: 1198-1208.
[27] Lippi G and Plebani M. Red blood cell distribu-tion width (RDW) and human pathology. One size fits all. Clin Chem Lab Med 2014; 52: 1247-1249.